Market Notes

Market Charts – January 31/22

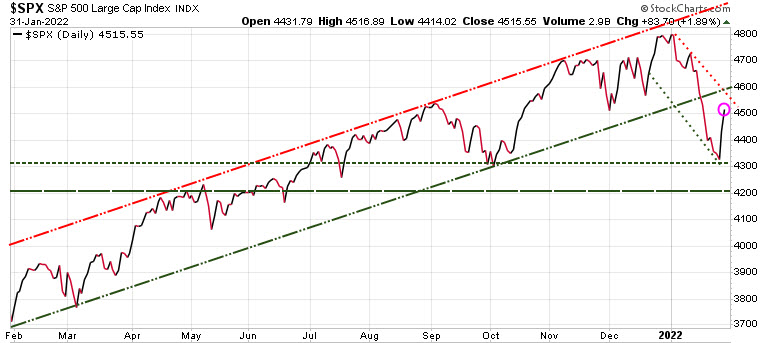
Since 1950, the market followed its January performance 85% of the time. As we can see on the chart, this January is a down month,  suggesting the year will be a down year.  But interestingly, in the previous two years the January performances were down, but the performance for the rest of the year were positive. So there are no guarantees, but it is one trend to keep an eye on, one of many we update our subscribers on throughout the year.

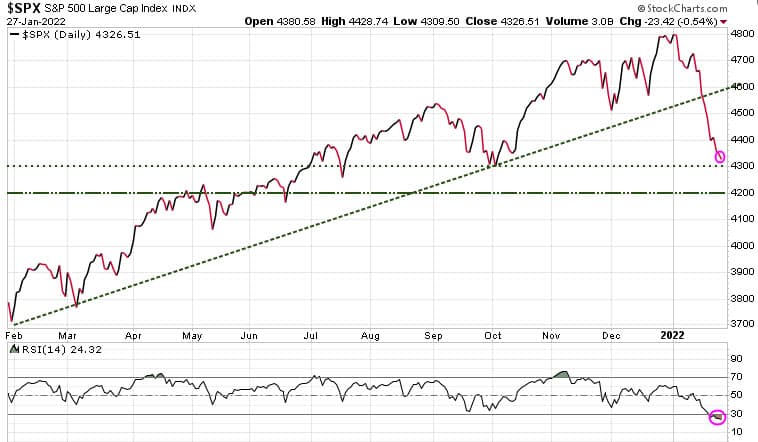
As we told subscribers in Sunday’s report the S&P 500 was technically oversold, so a short-term rally was to be expected. We need to keep a keen eye on the 4300 and 4200 support levels for the S&P 500 (green horizontal lines). If we do see a test of 4200, we should then see a rally to the 4400 level.
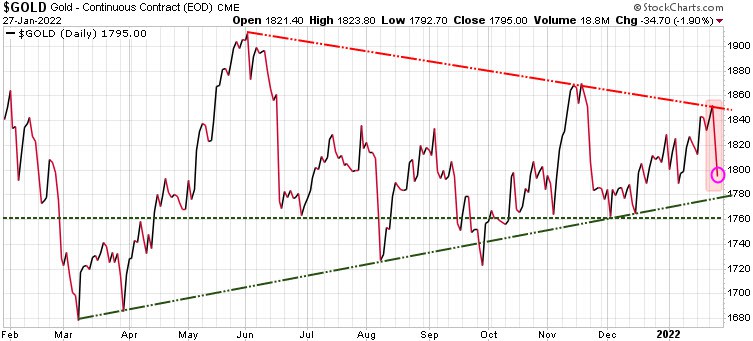
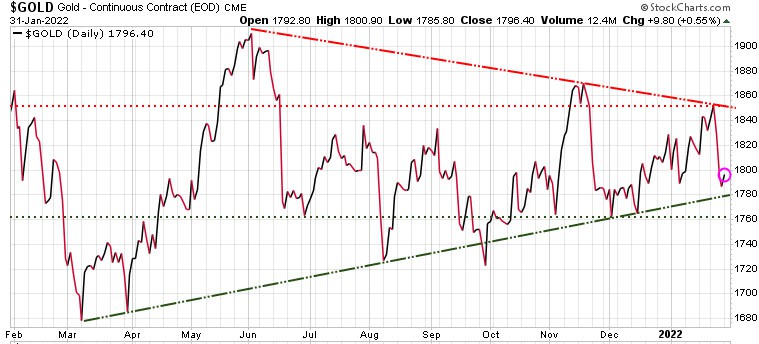
Gold has been very choppy, having a tough time due mainly to the strength in the $US. We are in a strong seasonal period for gold, but it cannot gain any tractions with that strong $US. We are still bullish, but we need to see it break out of its wedge pattern to the upside.
Stay tuned!

Market Notes

Market Charts – January 27/22

The market continues to struggle making any gains and seems to still be very concerned with the US Fed plans to start tightening and raising rates. We continue to see wide volatility, with the market unable to hold intra-day gains, nor does it want to close on the lows.  Intra-day we are seeing investors selling the high and buying the low, each with little conviction.

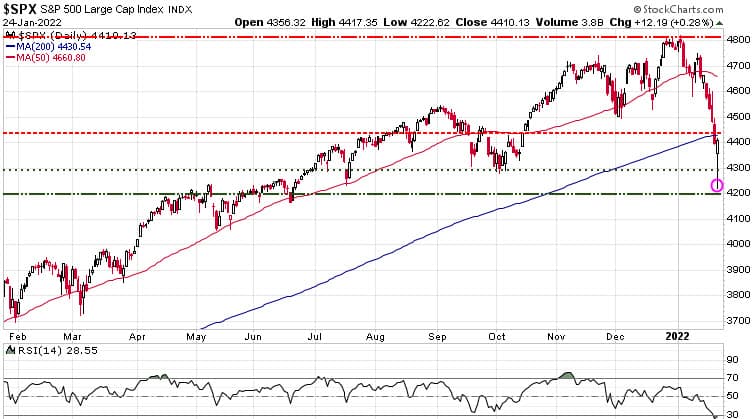
The S&P 500 is approaching our initial near-term support at 4300, but the key support is at 4200.  Note at bottom of chart the Relative Strength Index (RSI) is at 24.32 and any reading below 30 is considered oversold.

Note: Trend Letter subscribers should keep an eye out for a new BUY Alert, possibly tomorrow. 

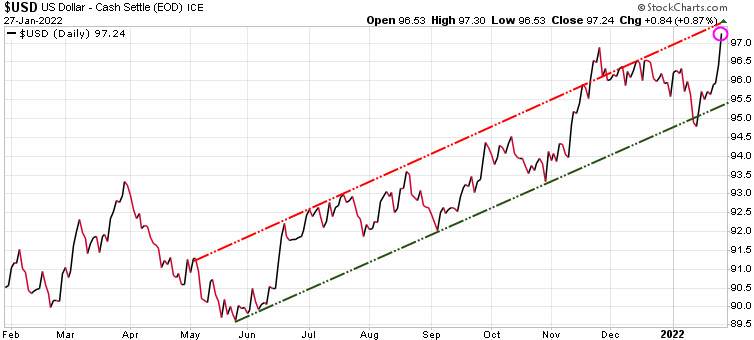
With expectations of the Fed raising rates in March, the $USD has surged.

We are in a seasonally strong period for gold, but with the $USD surging, it has been a strong headwind for gold, which was down down 34.70 today.  Watch the 1760 level (horizontal green line) it is key support for gold.

Note: All investors should have a hedging or exit strategy. If you do not have a hedging strategy for if /when the markets resume their steep sell off after a brief rally, seriously consider subscribing to Trend Technical Trader, the best hedging service we know of. To ensure all readers have access to this hedge service, we are reducing the price by $300. Click button below to subscribe. It’s your money – take control!

Stay tuned!

Market Notes

Market Charts – January 25/22

Equity markets had another down day, unable to rally above yesterday’s close, suggesting the near-term bottom is not likely in just yet. Tomorrow is the Fed meeting where Powell will take questions from the press and he will likely try to calm the markets, but must also address the inflation problem. The Fed is really between a rock and a hard place.

Most Americans do not own stocks other than those who have pension funds, so they do not care if the stock markets are getting hammered, but they care very much about how their food and gas prices are rising.  So their priority is for the Fed to fight inflation, not save the stock markets

The  markets have been extremely volatile the last two days, especially yesterday where we saw major swings, with the S&P 500 recovering from a loss of 3.98% and finished the day positive. That was only the 3rd time in history that has happened, and the previous two times happened just before the financial crisis on 2008.  So be warned, as this suggests there will be more losses to come.

We do expect that we will see a bounce very soon, and while this bounce could be a short-term buying opportunity, do understand that the risk for any rally being just a ‘dead cat bounce’ are quite strong.

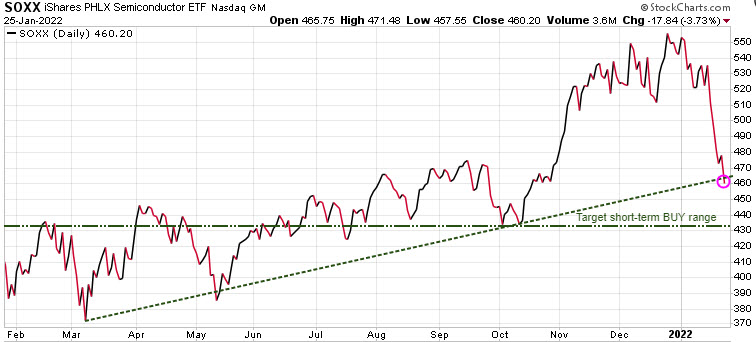
One sector we are watching for a rally is the Semiconductors. They are been hit hard and are approaching what our models target as a potential short-term Buy target just above the 430 level.  If you are interested in making this trade, do not buy it until you see that 430 support level hold. And if you do buy this range, be sure to set a SELL Stop to exit the trade if/when it turns back down. Trend Disruptor subscribers will be sent an alert if this trade is triggered.

If you do not have a hedging strategy for if /when the markets resume their steep sell off after a brief rally, seriously consider subscribing to Trend Technical Trader, the best hedging service we know of. To ensure all readers have access to this hedge service, we are reducing the price by $300. Click button below to subscribe.

Stay tuned!

Market Notes

Market Charts – January 24/22

In our last Trend Letter, we noted that the key support level for the S&P 500 was 4200 and if it hit that level, we could expect a solid rally.  Today, the S&P 500 dropped close to that 4200 level at 4222, before rallying to close the day at 4410.  Watch the 4435 (first red dashed line)  level as initial resistance, which represents at 38% retracement to the early January high.  Investors must be careful as we typically see that after an initial bounce, the low often gets re-tested.

The Fed meeting is on Wednesday and depending on the decision from that meeting there is still room for plenty of volatility. There is still risk of lower lows.

Stay tuned!