Market Charts – January 31/22
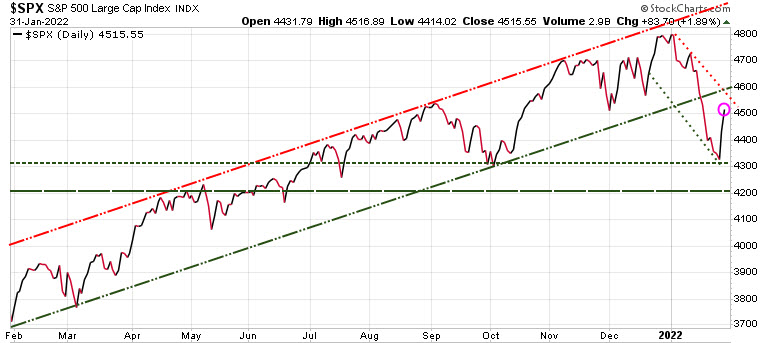
Since 1950, the market followed its January performance 85% of the time. As we can see on the chart, this January is a down month, suggesting the year will be a down year. But interestingly, in the previous two years the January performances were down, but the performance for the rest of the year were positive. So there are no guarantees, but it is one trend to keep an eye on, one of many we update our subscribers on throughout the year.
As we told subscribers in Sunday’s report the S&P 500 was technically oversold, so a short-term rally was to be expected. We need to keep a keen eye on the 4300 and 4200 support levels for the S&P 500 (green horizontal lines). If we do see a test of 4200, we should then see a rally to the 4400 level.
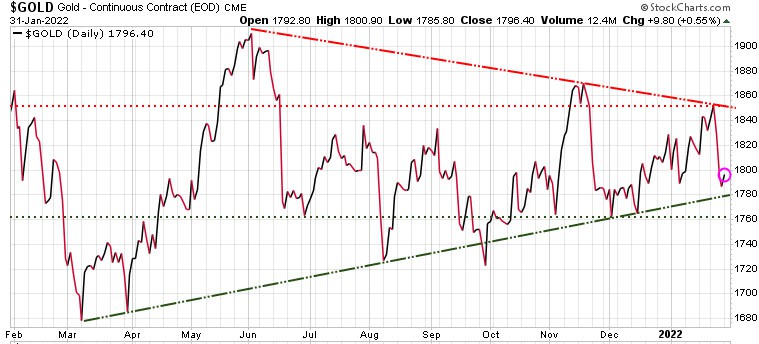
Gold has been very choppy, having a tough time due mainly to the strength in the $US. We are in a strong seasonal period for gold, but it cannot gain any tractions with that strong $US. We are still bullish, but we need to see it break out of its wedge pattern to the upside.
Stay tuned!