Market Charts – January 27/22
The market continues to struggle making any gains and seems to still be very concerned with the US Fed plans to start tightening and raising rates. We continue to see wide volatility, with the market unable to hold intra-day gains, nor does it want to close on the lows. Intra-day we are seeing investors selling the high and buying the low, each with little conviction.
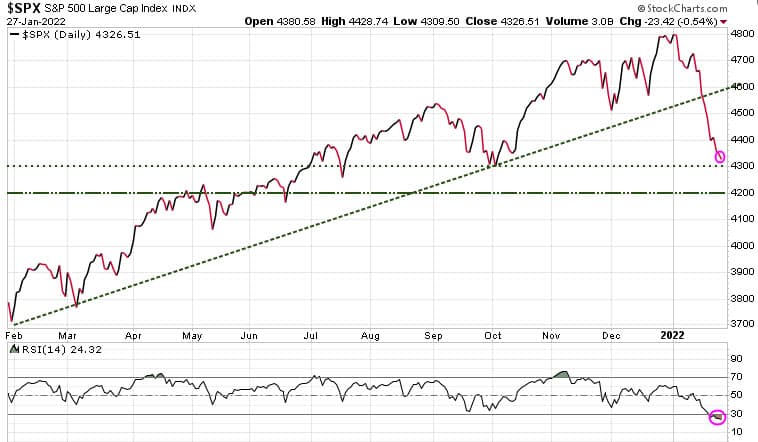
The S&P 500 is approaching our initial near-term support at 4300, but the key support is at 4200. Note at bottom of chart the Relative Strength Index (RSI) is at 24.32 and any reading below 30 is considered oversold.
Note: Trend Letter subscribers should keep an eye out for a new BUY Alert, possibly tomorrow.
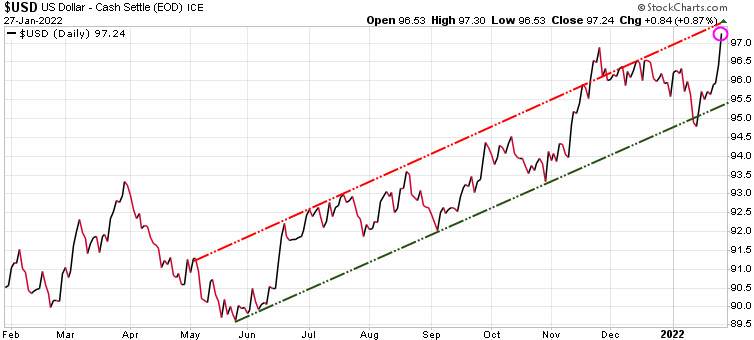
With expectations of the Fed raising rates in March, the $USD has surged.
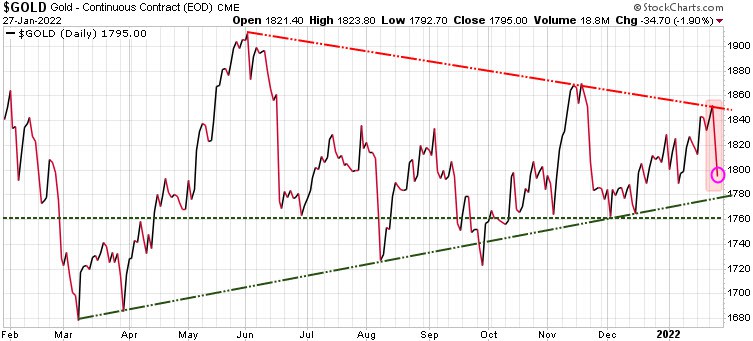
We are in a seasonally strong period for gold, but with the $USD surging, it has been a strong headwind for gold, which was down down 34.70 today. Watch the 1760 level (horizontal green line) it is key support for gold.
Note: All investors should have a hedging or exit strategy. If you do not have a hedging strategy for if /when the markets resume their steep sell off after a brief rally, seriously consider subscribing to Trend Technical Trader, the best hedging service we know of. To ensure all readers have access to this hedge service, we are reducing the price by $300. Click button below to subscribe. It’s your money – take control!
Stay tuned!