Market Charts – February 7/22
Stock turned lower to close a choppy session at the start of another busy week for corporate earnings and fresh economic data, as investors continue to assess the Federal Reserve’s path forward for monetary policy.
The S&P 500 declined after posting its best weekly rise of the year last week. The Dow traded little changed, and the Nasdaq underperformed as technology shares fell anew.
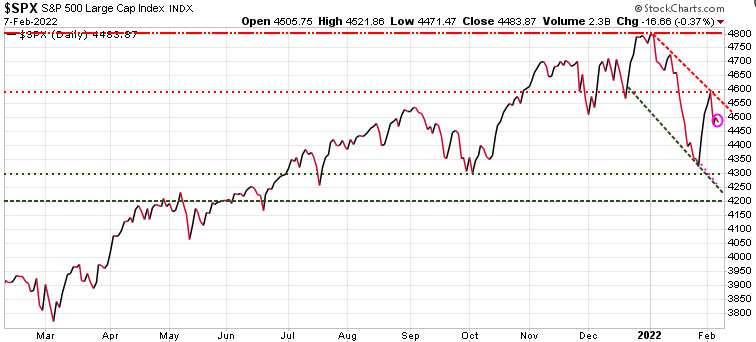
Looking at the S&P 500 chart, we can see that it is in a near-term downtrend channel and needs to break above near-term resistance at 4600 to decisively break out of that channel. Ultimately, the S&P 500 needs to break through to a new high to confirm the resumption of the bull market. Near-term support sits at 4300 and key support is the 4200 level. A break below that 4200 level opens the door for a significant decline.
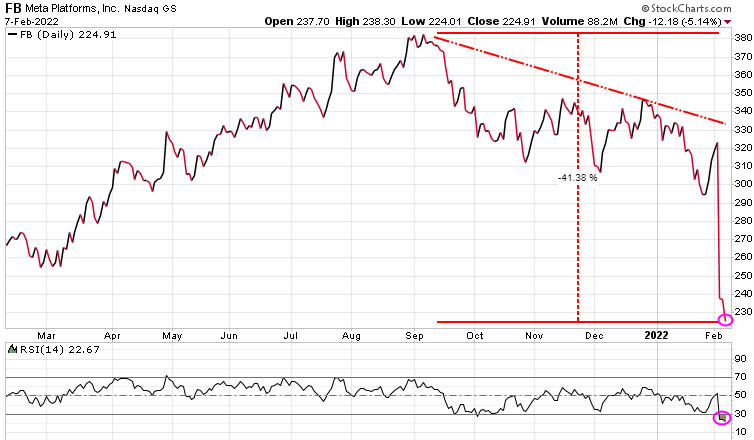
Tech stocks were down led by Meta (Facebook) again. Meta is now down over 41% from its September high. At the bottom of the chart, we can see that based on RSI, Meta is now oversold. If you are looking to dip your toe in here understand the this is like a falling knife, you need to wait till you see it start to turn higher.
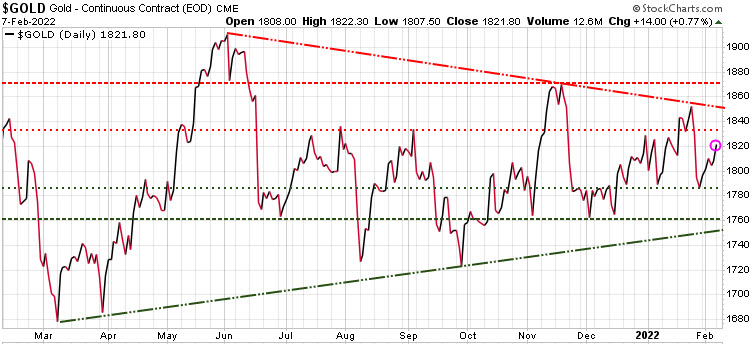
Gold was up 14.00 today, and is slowly trying to work its way to test near-term resistance of 1830, and then key support at 1870. We are in a seasonal period of strength for gold, but it has had a tough time trying to break out of this wedge pattern it has been in since last May.
Note: All investors should have a hedging or exit strategy. If you do not have a hedging strategy seriously consider subscribing to Trend Technical Trader, the best hedging service we know of. To ensure all readers have access to this hedge service, we are reducing the price by $300. Click button below to subscribe. It’s your money – take control!
Stay tuned!