Market Charts – February 8/22
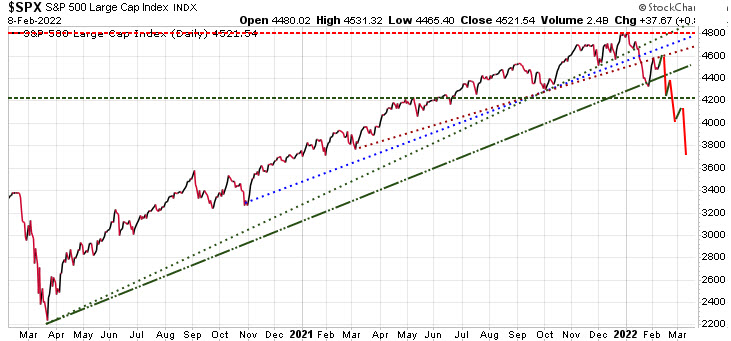
The S&P 500 was up ~38 points today, but the markets are still quite nervous. Watch the 4600 level as near-term resistance as our model sees this as a key short-term resistance level and if we can’t push past this level we could see the market start to break down with a potential near-term low in the next 6 weeks.
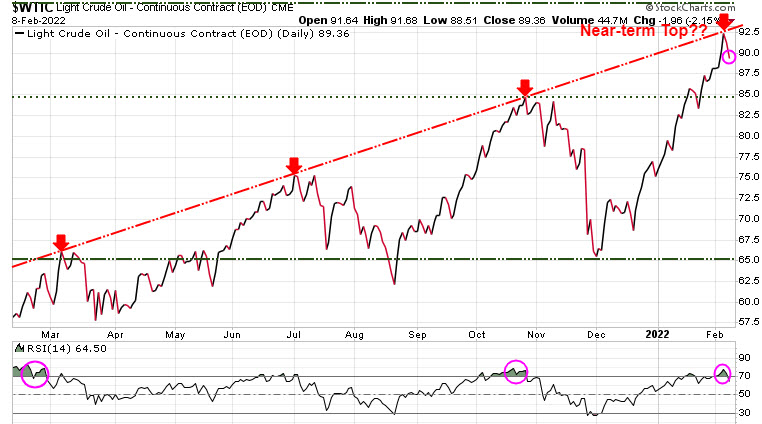
Oil has been on an absolute tear in the last year+ but is now hitting some strong technical resistance. The uptrend line (red diagonal) has shown to be strong resistance the last three times oil challenged it. Is this a near-term top? It certainly could be. If so, the first level of support would be 85.00, and then there is a big gap down to 65.00. Any invasion of Ukraine by Russia would negate any correction and most likely give oil a push higher, although much of a potential Russian invasion is already priced in.
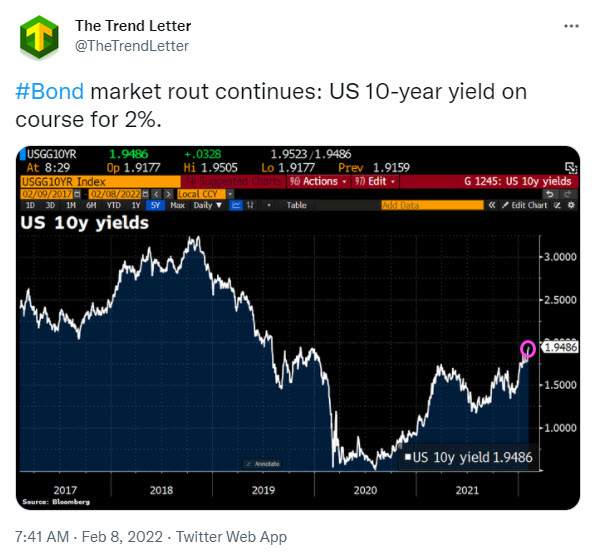
The yield on the benchmark 10-year Treasury is approaching 2%. January 2020 was the last time we saw the 10-year Treasury yields were above 2%. There has been over $8 trillion of new debt added (government & corporations) since the pandemic. If the 10-year U.S. Treasury yield hits 2%, with the Fed looking to raise rate, investors are likely to get very nervous.
If you are overweight in equities seriously consider subscribing to our premier hedging service, Trend Technical Trader. To ensure all readers have access to this hedge service, we are reducing the price by $300. Click button below to subscribe. It’s your money – take control!
Stay tuned!