Market Charts – February 18/22
Stocks extended declines Friday to close a second straight week in negative territory with geopolitical tensions intensifying to contribute to a further risk-off tone in markets.
The S&P 500 fell 0.71% to 4,348.97, building on a 2% loss in the previous session, while the Dow Jones index closed down 0.68% to 34,079.12 after erasing 1.8% Thursday for its worst day in nearly three months. The Dow also closed at its lowest level since September. The Nasdaq Composite shed 1.23% to 13,548.07 — its lowest level since January. Meanwhile, the CBOE Volatility Index (VIX), or “fear gauge,” spiked back to hover near 28 Friday.
The S&P continues to trade in its near-term downtrend channel. We are seeing lower highs, and lower lows, which is bearish. Near-term support remains at 4300, then 4200. Near-term resistance sits at 4600, which has been tested twice, and each time that resistance level has held. If the 4200 level is breached, then a much deeper correction is possible.
Note that is we do test the 4200 level, at least a temporary rally should follow.

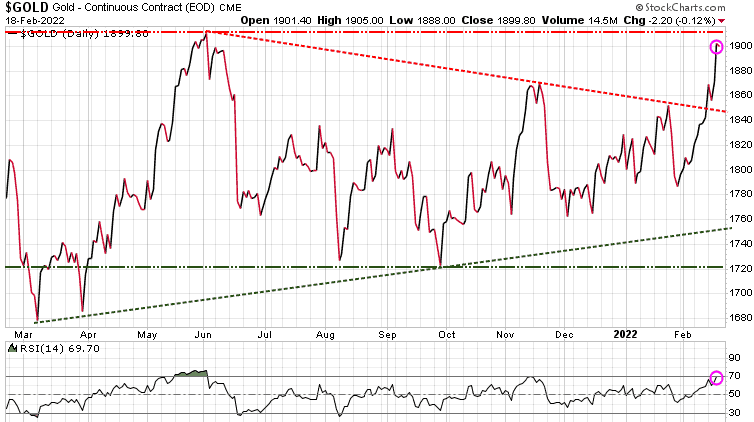
Gold was down 4.00 today, a little profit taking after its impressive run this month. Russia-Ukraine tensions are certainly contributing to this rally. Note at the bottom of the chart, RSI is very close to being technically overbought.
Stay tuned!