Market Charts – February – 21/22
North American markets were closed today, but we wanted to give investors a heads up as we head into a new week of trading. As we have been highlighting the last couple of weeks, near-term support for the S&P 500 sits at 4300, then 4200 (green horizontal lines on chart). As Martin highlighted in his interview on Mike Campbell’s Money Talks this weekend (click here to listen), if the 4200 level does not hold, WATCH OUT! 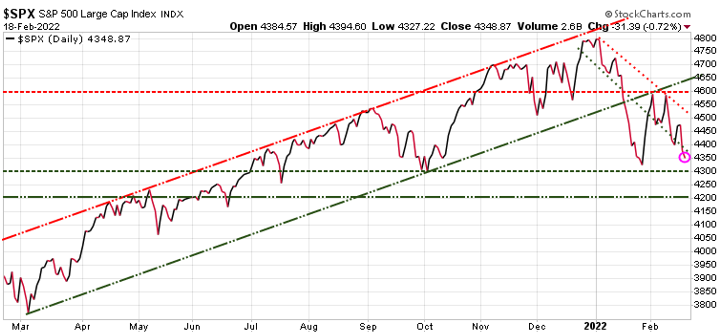
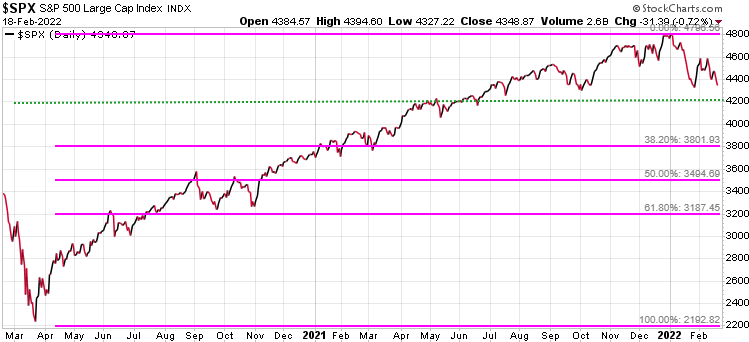
Many have asked if the 4200 support level is breached, how low is the S&P 500 likely to go? A potential answer could where the Fed Put kicks in; the level the S&P 500 would drop to before the Fed reverses policy to support the market.
Using Fibonacci retracement level from the March 2020 low as a guide, from the December 2021 high, the first level the Fed might act could be a 38.2% retracement to 3800. A 50% retracement would take it to 3494 & a 61.8% retracement would see the S&P 500 drop to 3187.
Be sure to have a hedging or exit strategy to protect your wealth. If you do not have a hedging strategy, seriously consider subscribing to Trend Technical Trader (TTT) which offers numerous hedging options. Note also, TTT includes the Gold Technical Indicator (GTI).
To ensure all readers have access to this hedge service, we temporarily reduced the price by $300. Click button below to subscribe. It’s your money – take control!
Stay tuned!