Market Charts – February 23/22
(From Yahoo Finance)…Stocks extended losses on Wednesday after a steep sell-off during Tuesday’s trading day, which pushed the S&P 500 and Dow to their lowest settlements so far of 2022.
The S&P 500 wiped out early advances to trade sharply lower in afternoon trading. The blue-chip index had also closed lower by just over 1% on Tuesday, bringing it more than 10% from its record closing high from Jan. 3 — or below the threshold to enter a correction.
Hopes of a diplomatic resolution for tensions between Russia and Ukraine appeared to deteriorate this week, as President Joe Biden publicly called Russia’s move to deploy troops to separatist regions of Ukraine “the beginning of a Russian invasion” of the region. The US unleashed a first tranche of sanctions on Russian financial institutions, sovereign debt and several key individuals in the country. Late Tuesday, US Secretary of State Antony Blinken also said he called off a meeting with his Russian counterpart, Foreign Minister Sergei Lavrov, that was supposed to take place this week.
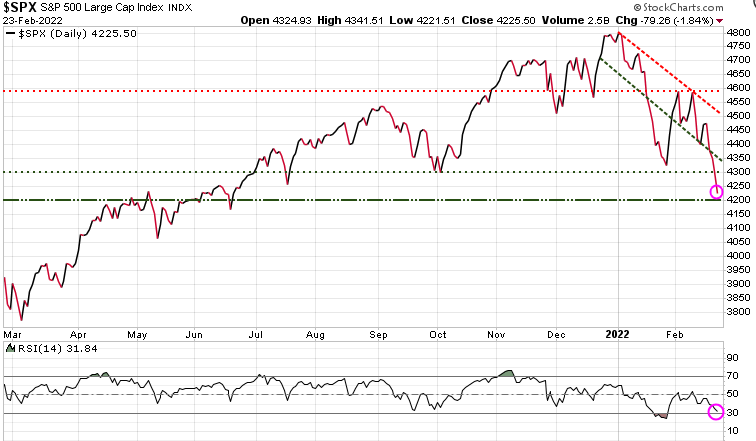
The S&P 500 has now broken through the 4300 support level and is just 25 points from testing critical support at 4200. Note at the bottom of the chart that based on RSI, the S&P 500 is close to being oversold. This suggests that if we hit 4200, we could form a temporary bottom at that level.
If you are a trader and are looking for a short-term bottom, do not buy until you see the market form a bottom and then start to turn up. You do not want to try and catch a falling knife.
Hopefully, you have taken our advise and established exit or hedging strategies. If you do not have a hedging strategy, seriously consider subscribing to Trend Technical Trader (TTT) which offers numerous hedging strategies. Note also, TTT includes the Gold Technical Indicator (GTI).
To ensure all readers have access to this hedge service, we temporarily reduced the price by $300. Click button below to subscribe. It’s your money – take control!
Stay tuned!