Market Charts – March 1/22
(From CNN)… March is looking a lot like January and February on Wall Street. That’s not good news for investors.
The Dow fell nearly 600 points Tuesday, or 1.8%, one day after stocks capped off their second straight month of declines to start the year. The Dow managed to finish off its lows of the day though.
The Nasdaq and S&P 500 were also hit hard, with each index falling about 1.6%.
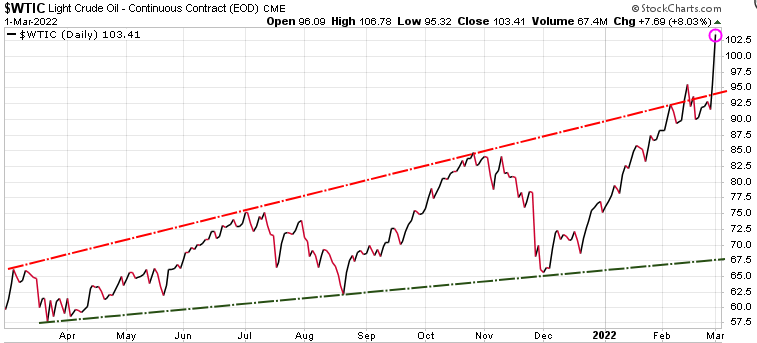
Rising oil prices, which spiked nearly 10% Tuesday to above $104 a barrel for the first time in more than seven years, are hurting sentiment. So is the rapid drop in long-term bond yields. The 10-year Treasury rate fell to about 1.7%, the lowest level since early January.
Oil has been parabolic, up another 8.03% today. OPEC meets tomorrow and it will be interesting to see if they agree to raise production. Another option is with Iran and if sanctions are lifted, they could add an additional 1.3 million b/d to supply.
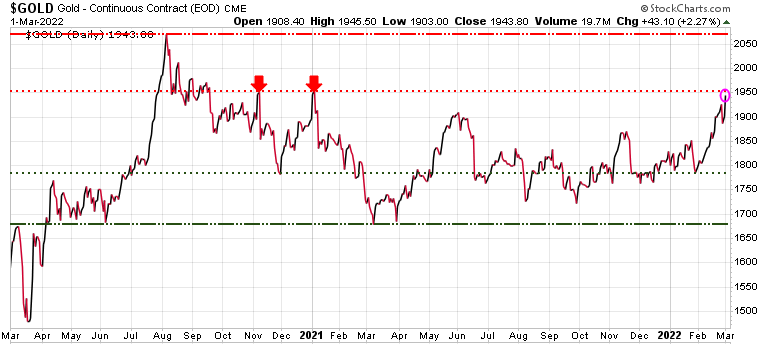
Gold has exploded due to geopolitical events that suggest investors are not just nervous about what Putin is doing, but also whether the Western leaders are a match for him. The real concern here is that they back Putin into a corner where he feels he needs to save face and then we end of with a much bigger issue, such as a world war.
Gold was up another 43.10 and is now testing the key resistance established in November and December 2020 (red arrows). If gold can break through that resistance level, then we have a good shot of testing the all-time closing high of 2069 set in August 2020.
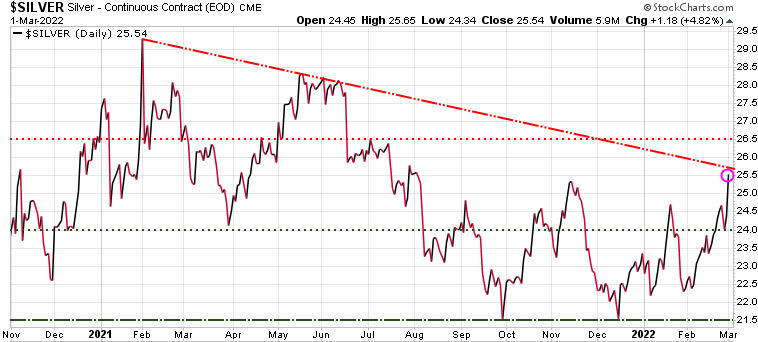
While gold was up 2.27% today, silver more than doubled that rise, up 4.82%.
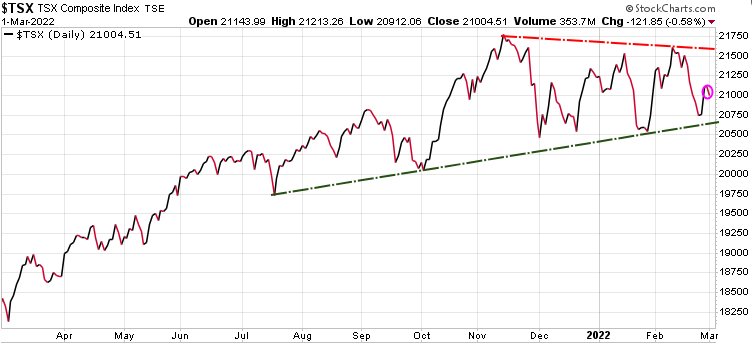
The Canadian TSX continues to fare better than most global markets, given its heavy commodity and energy exposure.
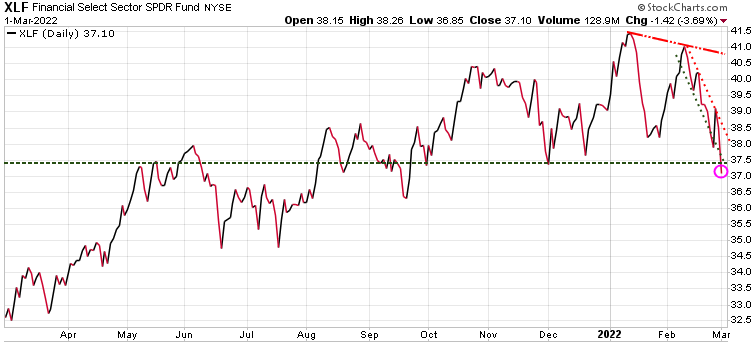
US financials were the biggest losers today with the XLF fund down 3.69% for the day, its worst performance since June 2020.
Hopefully, you have taken our advise and established exit or hedging strategies. If you do not have a hedging strategy, seriously consider subscribing to Trend Technical Trader (TTT) which offers numerous hedging options. Note also, TTT includes the Gold Technical Indicator (GTI).
To ensure all readers have access to this hedge service, we temporarily reduced the price by $300. Click button below to subscribe. It’s your money – take control!
Stay tuned!