
Market Charts – March 8/22
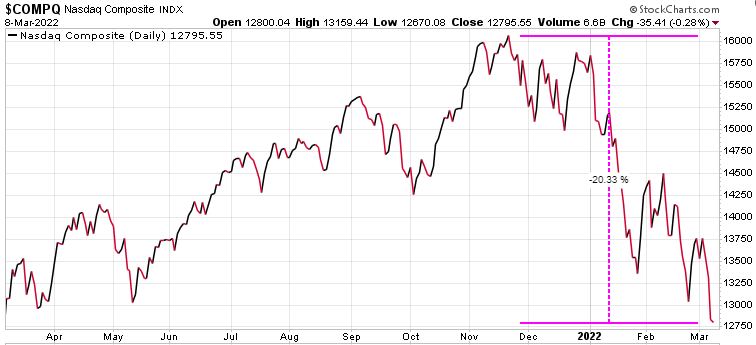
(From Yahoo finance)…Concerns over the impact that the punitive measures countries and companies have taken against Russia have weighed on US equity markets. The S&P 500 dropped another 0.7% on Tuesday to bring its year-to-date losses to 12.5%. The Dow shed more than 0.5% to sink further into a correction, while the Nasdaq Composite extended losses after sliding into a bear market earlier this week.
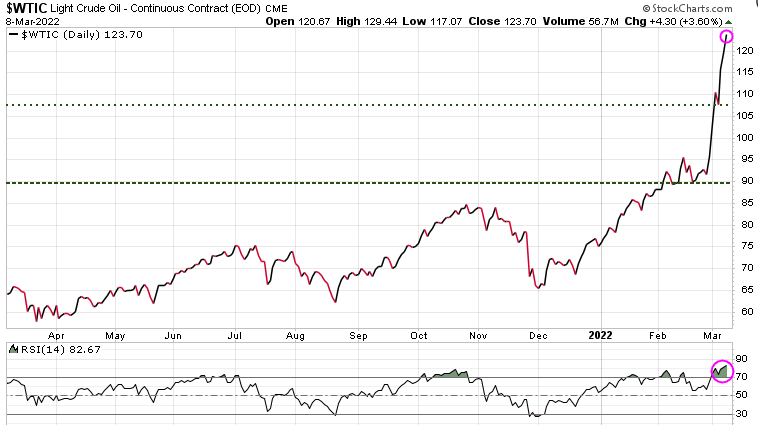
President Joe Biden’s formal announcement that the US would be banning Russian imports of crude oil and other energy products confirmed speculation from earlier this week, and sent oil prices up to hold near 14-year highs. West Texas intermediate crude held well above $120 per barrel, and Brent crude hovered around $130 per barrel. Gas prices at the pump also spiked to a fresh high across the US.
The Nasdaq is now in a bear market, having dropped over 20% from its November high. While we could see a bounce soon, be very cautious jumping back in with both feet. Although all corrections become buying opportunities, you want to make sure the bottom is in before getting aggressive. If you do not have an exit or hedging strategy, serious think about subscribing to our Technical Trader service. See special offer at bottom of this page.
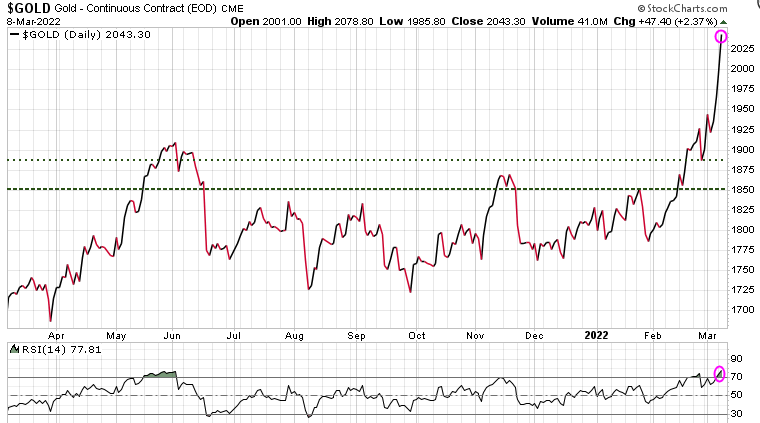
Gold had another great day, up over 47.00 to close the session at 2043.30. As noted yesterday, gold is now technically overbought, so a pullback soon would be expected, as soon as we get some positive news out of Ukraine.
With the US and allies banning the import of Russian oil, the price of oil moved higher again today, reaching almost 130.00 intra-day before settling at 123.70. At the bottom of the chart we can see that oil is extremely overbought technically.
If you do not have a hedging strategy, seriously consider subscribing to Trend Technical Trader (TTT) which offers numerous hedging options. Note also, TTT includes the Gold Technical Indicator (GTI).
To ensure all readers have access to this hedge service, we temporarily reduced the price by $300. Click button below to subscribe. It’s your money – take control!
Stay tuned!