Market Charts – March 29/22
(From Yahoo)…Stocks rose while US crude oil prices fell for a back-to-back session amid signs of progress in Russia-Ukraine talks. Russia said it was easing military action in Ukraine’s capital Kyiv and northern city Chernihiv and was prepared to set a meeting between Russian President Vladimir Putin and Ukraine’s President Volodymyr Zelensky following a draft peace agreement.
The latest batch of US economic data offered a mixed picture on the state of the economy amid still-elevated inflation, ongoing geopolitical uncertainty and tightening monetary policy out of the Federal Reserve. Job openings held little changed at about 11.3 million in March, far outpacing new hires at 6.7 million to reflect persistently rampant labor supply shortages. And while the Conference Board’s latest monthly index showed a slight uptick in consumer confidence in March, the index remained below last year’s average. Plus, consumers’ one-year inflation expectations soared to an all-time high of 7.9%.
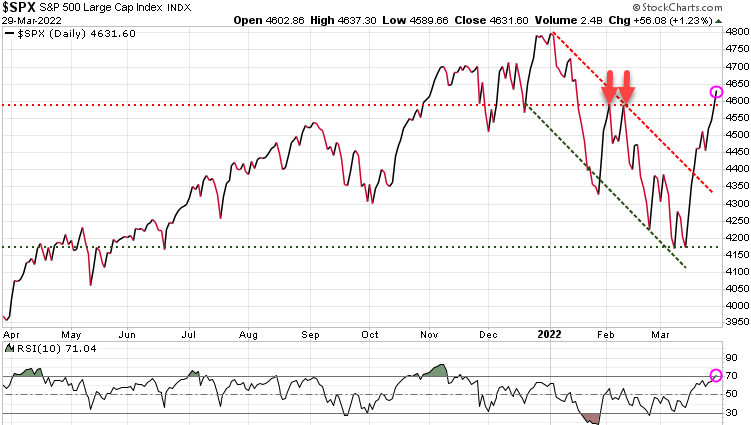
The S&P 500 has pushed through the 4600 level, which had acted as strong resistance, having held the two previous tests (red arrows). While this is a bullish move, if we look at the RSI at the bottom of the chart, we can see that it is now technically overbought, suggesting a pullback is likely soon.
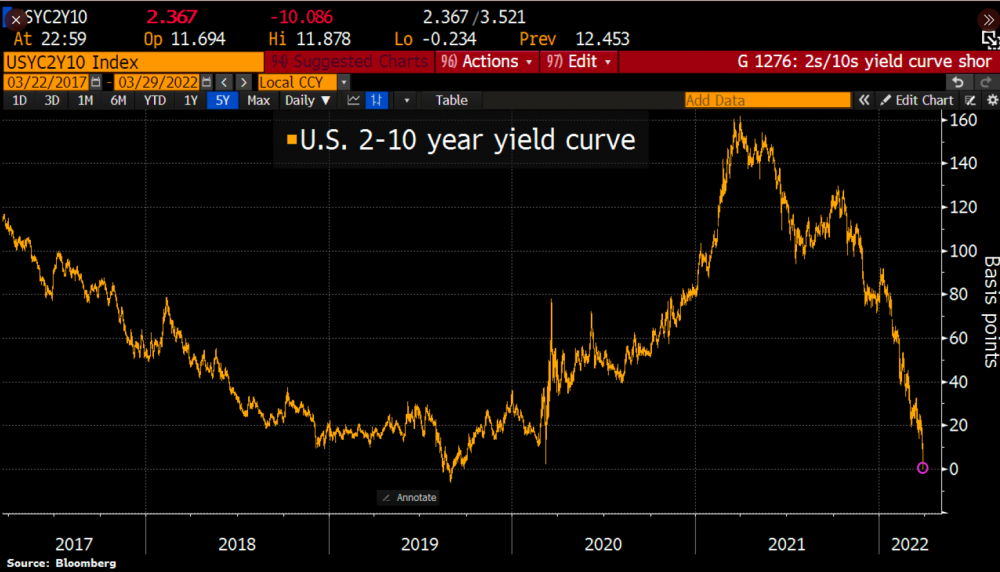
A closely watched measure of the yield curve that serves as one of the bond market’s most reliable recession indicators inverted today. The 2-year/10- yield spread intermittently dipped below zero and is down from more than 160 basis points a year ago for 1st time since 2019.
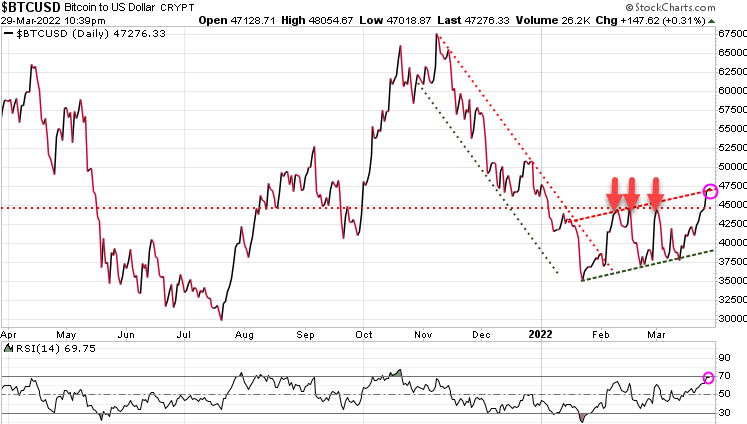
Bitcoin has broken through its’ near-term resistance level that had held the previous three times it was tested (red arrows). The world’s most popular cryptocurrency is up roughly 8% over the past two days to more than $47,000.
Last week, crypto investment products saw their highest inflows of the year, as well as their eighth positive week of the past 10 weeks.
Stay tuned!