Market Charts – April 13/22
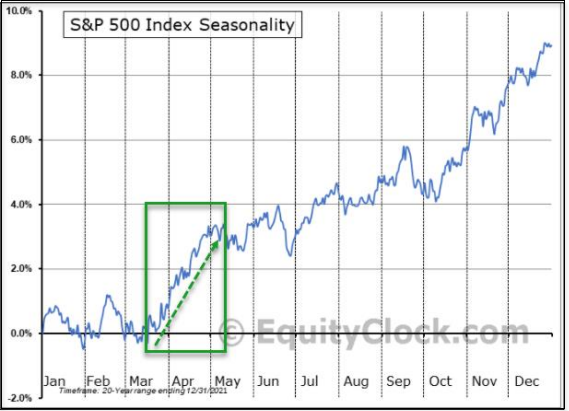
Based on seasonality, most North American markets are in a strong period. Here we see the chart for the S&P 500, which is strong through to early May. The Toronto and Nasdaq charts look very similar.
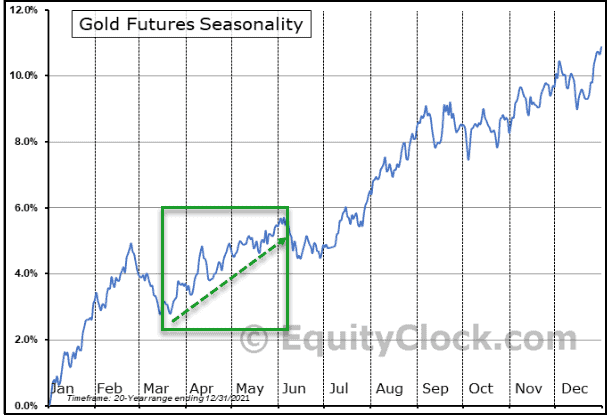
Gold is also in a very strong seasonal period, from mid-March right through to early June.
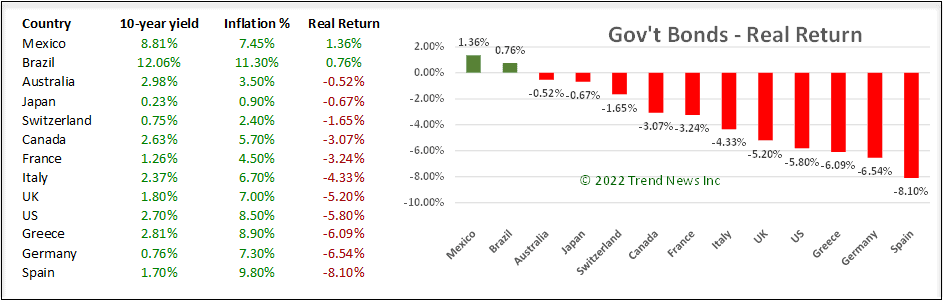
The real returns for government bonds (bond yield – inflation) is negative in most countries, with only Mexico and Brazil being positive on the chart we publish each week in the Trend Letter. Canadian bond holders are losing 3.07% per year, US bond holders are losing 5.80% and Spanish bond holders are losing a whopping 8.10%.
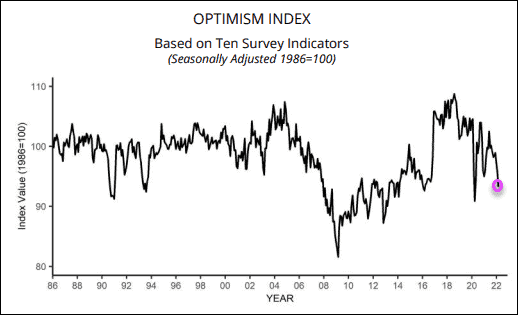
Small businesses make up ~45% of GDP in both Canada and the US. Below are the results of the Nation Federation of Independent Business (NFIB) latest survey. It shows that the general outlook for these business owners is ‘poor’. In particular, for ‘Expect the economy to improve’, the percentage dropped 14% to -49%, the lowest level recorded in the survey’s 48-year history.
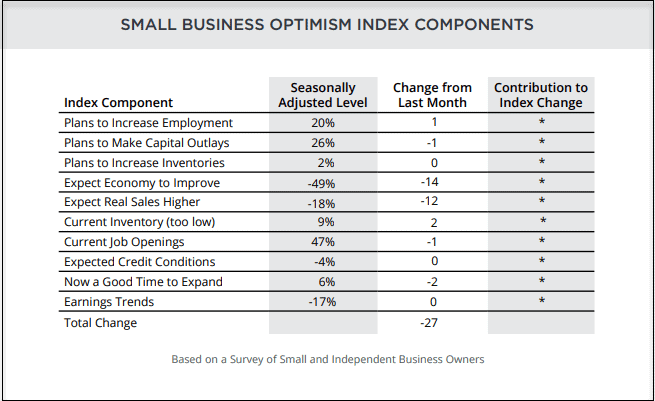
The Index has declined every month this year. Thirty-one percent of owners reported that inflation was their single most important problem encountered in operating their business, an increase of 5 points from February. This is the highest reading since Q1 1981 and has replaced “labour quality” as the number one problem. The net percent of owners raising average selling prices increased 4 points to a net 72% seasonally adjusted, the highest reading in the 48-year-history of the survey. The highest reading in the mid-70s, the last time inflation was a serious problem, was 67% in Q4 1974.
Stay tuned!