Market Notes

Market Notes – May 18/22

In yesterday’s issue of Today’s Charts we warned that in bear markets there is a lot of volatility, with violent moves both up and down. Today we saw what a violent move down in stocks looks like. We also warned that most relief rallies in a bear market fail. It is another reminder to ensure you have a hedging strategy, especially in times like these.
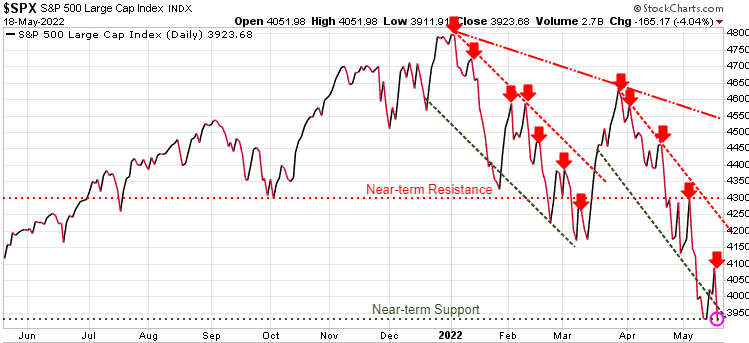
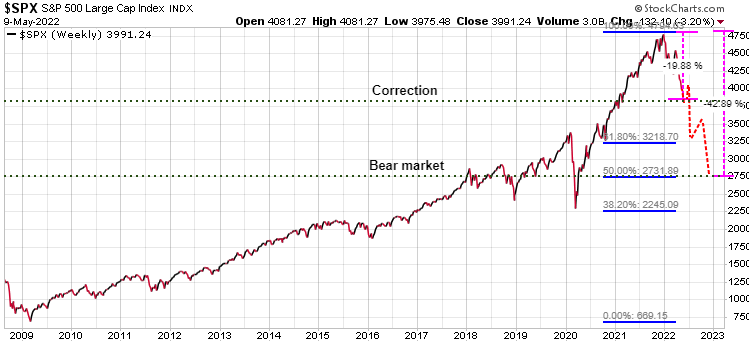
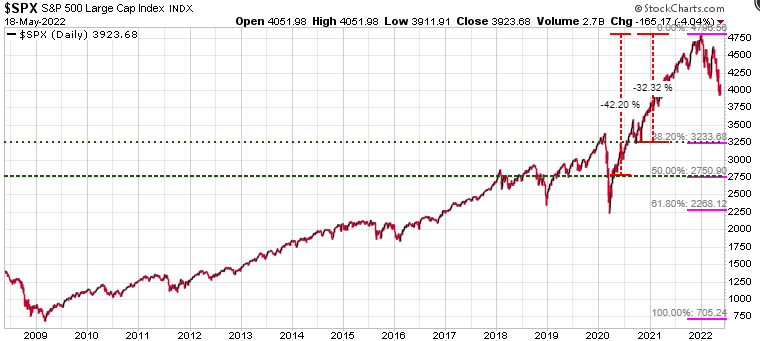
How far does this market fall? Below is a chart we showed Trend Letter subscribers recently. A 38% fibonacci retracement of the bull market run from 2009 would drop the S&P 500 to 3233, for a decline of over 32% from the January high. A 50% fibonacci retracement would take the S&P 500 down to 2750, a decline of over 42% from  the January high.
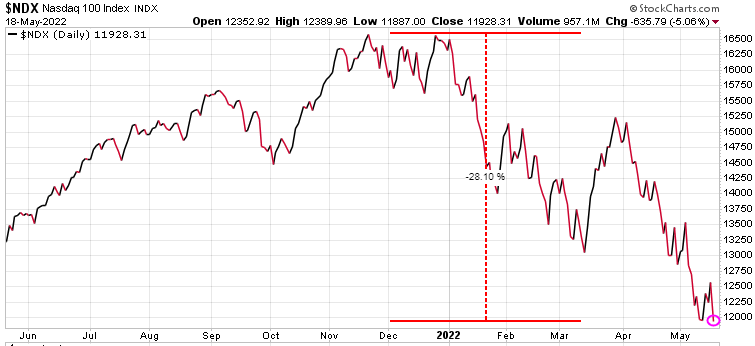
Tech stocks continue to be the big losers in this market sell-off, with the Nasdaq 100 dropping over 5.1% today and is now down 28% since its all-time high in Nov’21.
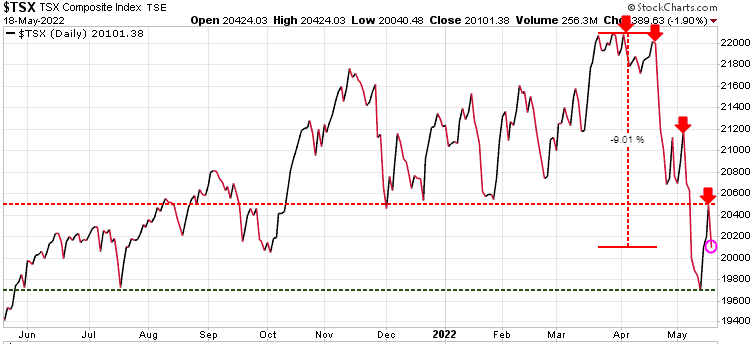
The Canadian TSX is also struggling but the energy is reducing the pain somewhat. TSX is down 9% from its all-time high.
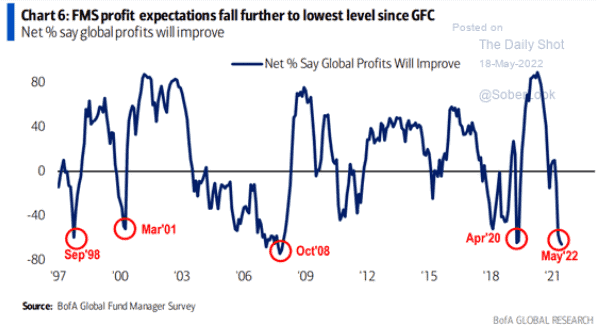
Based on the Bank of America’s Global Fund Manager Survey, fund managers haven’t been this gloomy about corporate profits since 2008.
Note that all three of our services have created target lists of excellent stocks that once we see the bottom of this bear market each service will be jumping in on those stocks. We are not there yet, but certainly getting closer to a bottom. We are offering the same great specials that we offered attendees of the World Outlook Financial Conference recently, where each service is 50% off and you can bundle two or all three services for even greater discounts.  If interested, click on the button below. It’s your money – take control!


Market Notes

Market Notes – May 17/22

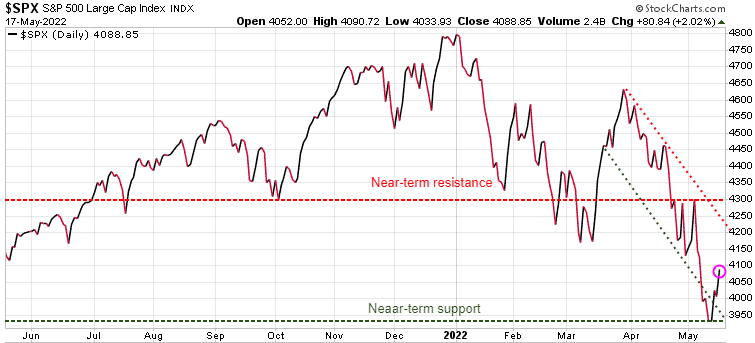
As noted in Sunday’s issue of the Trend Letter, after the big sell-off, we are now seeing a relief rally. This could last for days, weeks or even a couple of months, but be very careful because if we do not see higher-highs and higher-lows, then we are most likely to see the market turn even lower. Bear markets tend to get very nasty with wild swings both up and down. While these relief or reflective rallies can be traded, in bear markets these rallies regularly fail.

Relief rallies

For the S&P 500, we need to see it push through its near-term resistance at 4300.

S&P500

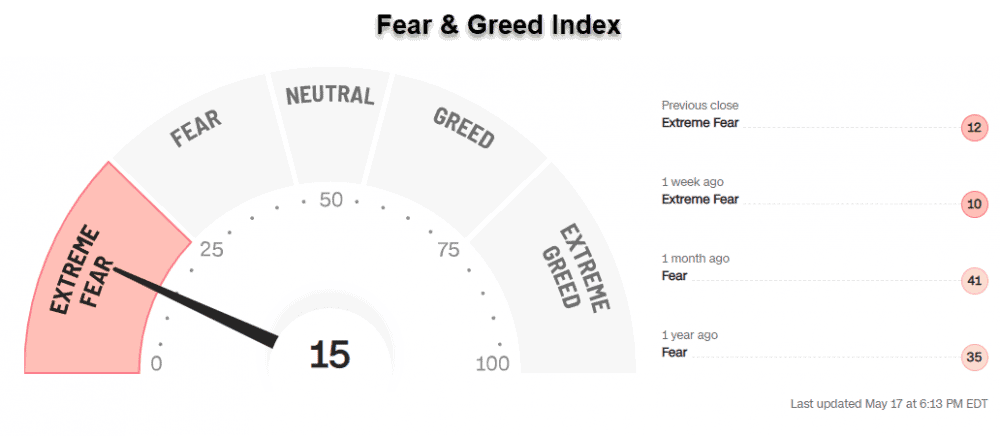
One of the things that does suggest we get a rally here is that market sentiment has been very beamish, which tends to be a contrarian indicator.  Below is the CNN Fear & Greed Index and as we can see it is at an ‘Extreme Fear’ level.

Fear & Greed

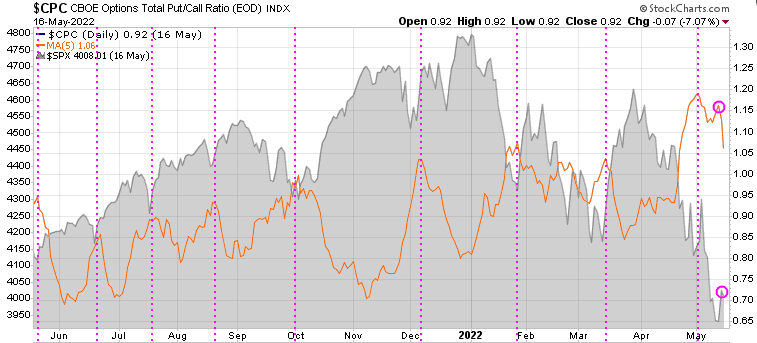
The next chart is the put/call ratio (orange line) overlayed on the S&P 500. When this ratio is rising it tells us that investors are being more bearish, risk-averse. When the ratio is declining it means the investors are becoming more bullish, risk-on.  The vertical pink lines show how when we see peaks in the put/call ratio, it usually identifies short-term bottoms in the S&P 500, suggesting a relief rally has started.

Put/Call

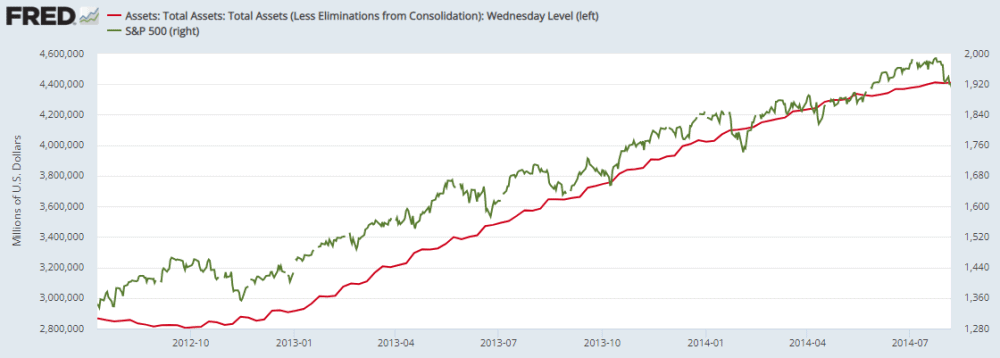
Central bankers had been keeping interest rates low and have been major buyers of their domestic bonds.  Those loose monetary policies have fueled the bull run in the equity markets. But now the US Fed, Bank of Canada, and others are raising rates and are no longer buying their domestic bonds. In fact, the Fed will start to be SELLERS of these bonds.  The correlation of the bull market in stocks (green line) with the massive increase of the Fed’s balance sheet (red line) from buying all those bonds,  is very clear on this chart. Rising interest rates, a reduction in the balance sheet and a slowing economy, are serious headwinds for the equity markets.

Assets

Since the start of the year we have warned investors to have a hedging strategy for what we anticipated would be a very volatile year in 2022. The market action in these last 4 months is exactly the reason investors need a strategy to protect their wealth in volatile markets.  Our Trend Technical Trader (TTT) service was originally a hedging service and although it now recommends long positions as well, TTT is still a hedging service with many hedging strategies that are doing very well as the market crashes.

If you do not have a hedging strategy, seriously consider subscribing to TTT which offers numerous hedging options. Note also, TTT includes the Gold Technical Indicator (GTI).

To ensure all readers have access to this hedge service, we temporarily reduced the price by 50%. Click button below to subscribe. It’s your money – take control!


Market Notes

Market Notes – May 12/22

Stocks rebounded sharply in the final hour of trading, with the S&P 500 almost erasing a selloff that pushed it to the brink of a bear market earlier Thursday.

The turnaround came as Federal Reserve Bank of San Francisco President Mary Daly told Bloomberg News that a 75-basis-point increase in rates is “not a primary consideration,” while adding that the US is in a strong place and should be able to withstand monetary tightening. For a market that’s been haunted by fears that restrictive policy by major central banks will cause a recession, those comments offered a degree of comfort at the end of a session marked by wild volatility.


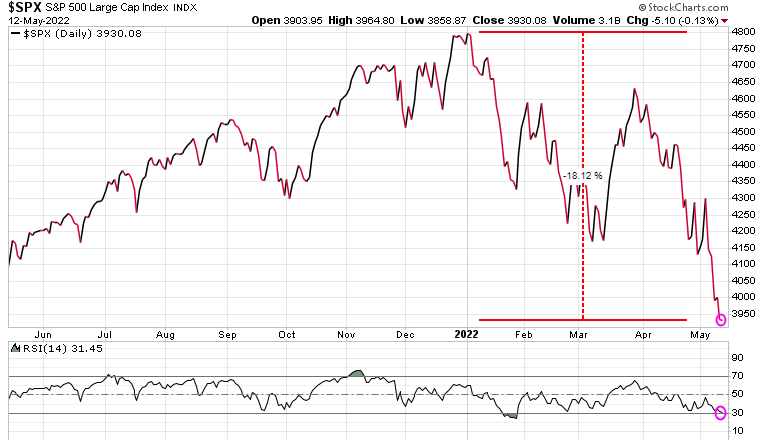
A small glimmer of hope as the S&P 500 was down 76 points at one point, but came back to close down just over 5 points.  The S&P is now down over 18% from the high to start the year. At the bottom of the chart  note that based on RSI the S&P 500 is getting close to being oversold, so at least a relief rally should be expected soon.  Loading up here would be like trying to catch a falling knife – be careful!

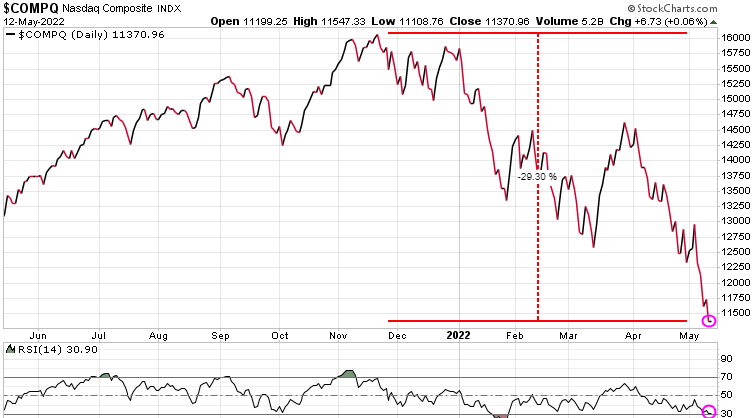
The tech heavy Nasdaq is now down almost 30% from its November and is also very close to being technically oversold.

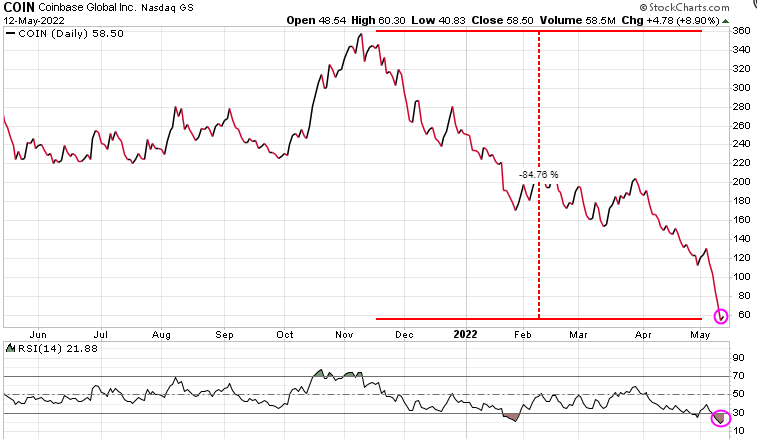
Cryptocurrencies have been hit hard and Coinbase, the largest crypto exchange is getting hammered, down 55% in just the last 5 days, and down 85% since the November high.

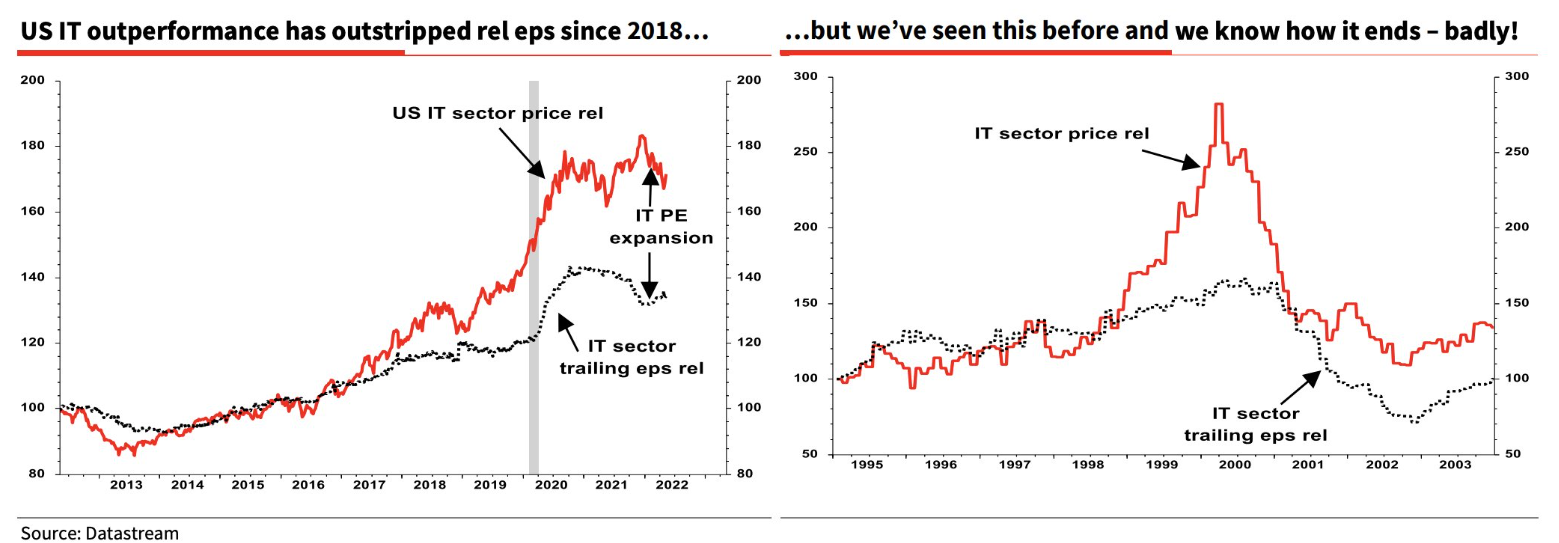
Tech now experiencing something similar to what was seen in 2000. Back then Tech collapsed as recession flushed out cyclical stocks masquerading as growth stocks. Profit disappointments in Tech during ’01 recession brought sector to collapse. Look familiar?

US 30-year mortgage has now jumped to 5.30%, almost double the Dec’20 rate of 2.67%.

Since the start of the year we have warned investors to have a hedging strategy for what we anticipated would be a very volatile year in 2022. The market action in these last 4 months is exactly the reason investors need a strategy to protect their wealth in volatile markets.  Our Trend Technical Trader (TTT) service was originally a hedging service and although it now recommends long positions as well, TTT is still a hedging service with many hedging strategies that are doing very well as the market crashes.

If you do not have a hedging strategy, seriously consider subscribing to TTT which offers numerous hedging options. Note also, TTT includes the Gold Technical Indicator (GTI).

To ensure all readers have access to this hedge service, we temporarily reduced the price by 50%. Click button below to subscribe. It’s your money – take control!


Market Notes

Market Notes – May 9/22

Global markets got hit hard today with investors refocusing on the Ukraine war, a global energy shock and the risk asthe Fed tries to fight the supply-driven inflation.  “I’ve been in the markets for 25 years and I’ve never seen anything like this,” said Danielle DiMartino Booth, CEO and chief strategist for Quill Intelligence, a Wall Street and Federal Reserve research firm. “It’s violent not just volatile.”

In the weekend edition of the Trend Letter we showed this updated chart, highlighting  what a correction vs a bear market would look like. A move down to the 3800 level would be a  decline of ~20% from the December high, signalling a correction. We would expect a relief rally from that level. If we then re-test that level, a bear market would likely take the S&P down to the 2730 level which would be a 50% retracement of the rally from 2009 to the recent high in December.

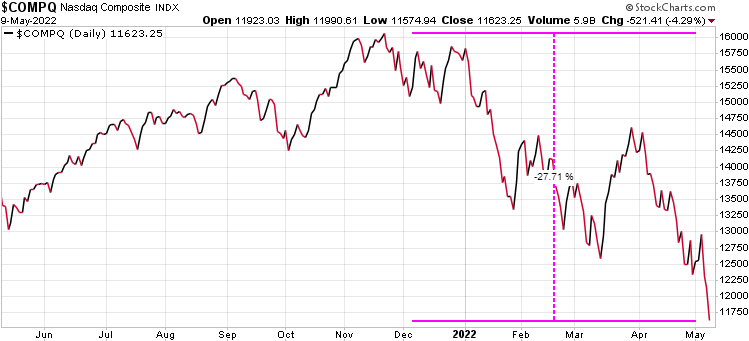
The tech heavy Nasdaq was down a whopping 4.29% on Monday. Now down ~28% so far this year!

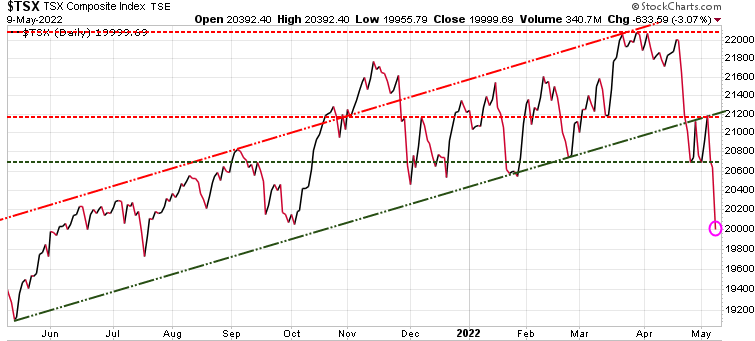
The Canadian TSX was down 3.07%

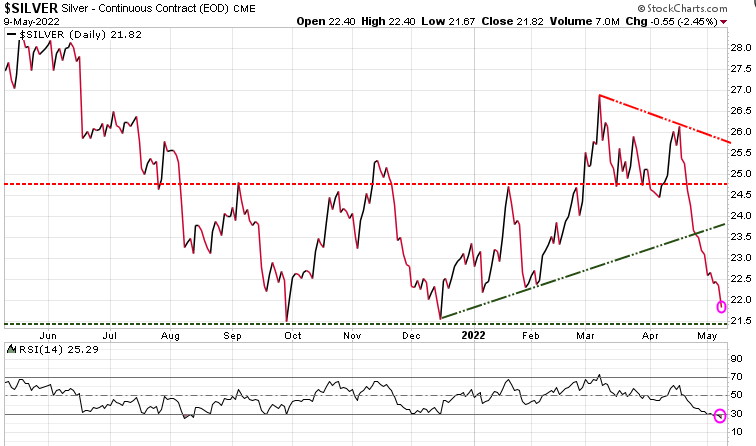
Silver has really struggled recently, and dropped another 2.46% today.  Based on RSI (bottom of chart), silver is now oversold.

Since the start of the year we have warned investors to have a hedging strategy for what we anticipated would be a very volatile year in 2022. The market action in these last 4 months is exactly the reason investors need a strategy to protect their wealth in volatile markets.  Our Trend Technical Trader (TTT) service was originally a hedging service and although it now recommends long positions as well, TTT is still a hedging service with many hedging strategies that are doing very well as the market crashes.

If you do not have a hedging strategy, seriously consider subscribing to TTT which offers numerous hedging options. Note also, TTT includes the Gold Technical Indicator (GTI).

To ensure all readers have access to this hedge service, we temporarily reduced the price by 50%. Click button below to subscribe. It’s your money – take control!
 

Stay tuned!