Market Notes – May 17/22
As noted in Sunday’s issue of the Trend Letter, after the big sell-off, we are now seeing a relief rally. This could last for days, weeks or even a couple of months, but be very careful because if we do not see higher-highs and higher-lows, then we are most likely to see the market turn even lower. Bear markets tend to get very nasty with wild swings both up and down. While these relief or reflective rallies can be traded, in bear markets these rallies regularly fail.
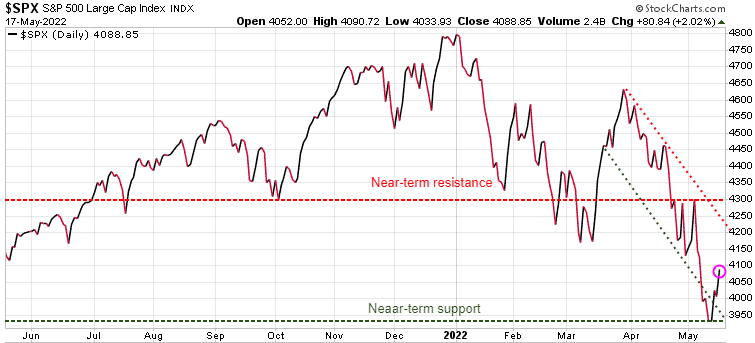
For the S&P 500, we need to see it push through its near-term resistance at 4300.
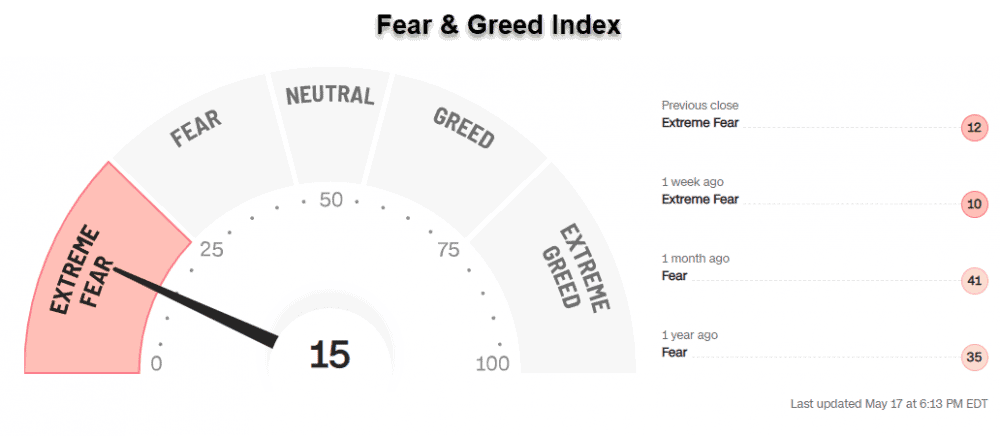
One of the things that does suggest we get a rally here is that market sentiment has been very beamish, which tends to be a contrarian indicator. Below is the CNN Fear & Greed Index and as we can see it is at an ‘Extreme Fear’ level.
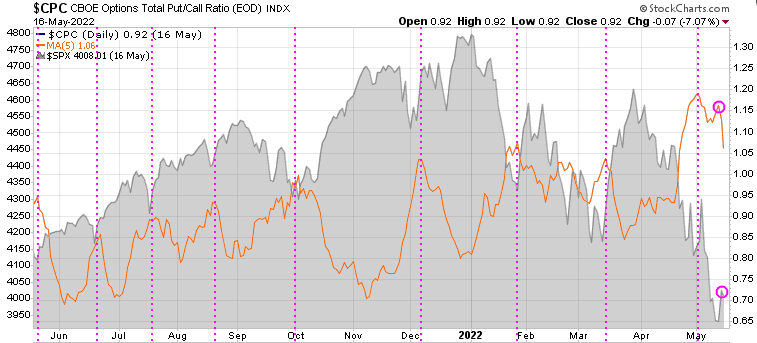
The next chart is the put/call ratio (orange line) overlayed on the S&P 500. When this ratio is rising it tells us that investors are being more bearish, risk-averse. When the ratio is declining it means the investors are becoming more bullish, risk-on. The vertical pink lines show how when we see peaks in the put/call ratio, it usually identifies short-term bottoms in the S&P 500, suggesting a relief rally has started.
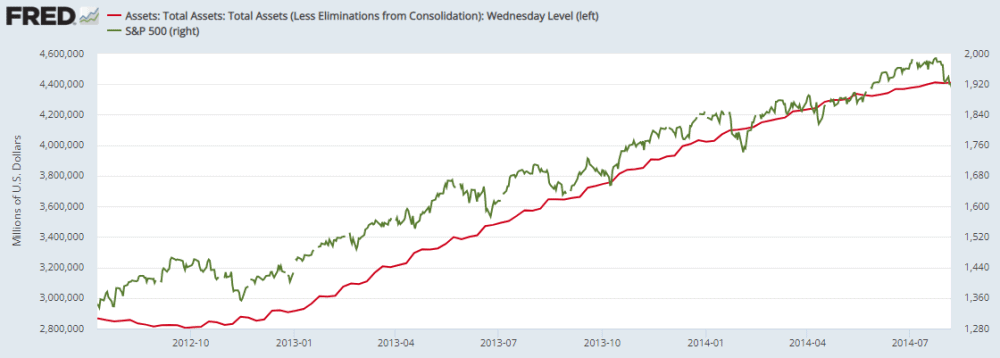
Central bankers had been keeping interest rates low and have been major buyers of their domestic bonds. Those loose monetary policies have fueled the bull run in the equity markets. But now the US Fed, Bank of Canada, and others are raising rates and are no longer buying their domestic bonds. In fact, the Fed will start to be SELLERS of these bonds. The correlation of the bull market in stocks (green line) with the massive increase of the Fed’s balance sheet (red line) from buying all those bonds, is very clear on this chart. Rising interest rates, a reduction in the balance sheet and a slowing economy, are serious headwinds for the equity markets.
Since the start of the year we have warned investors to have a hedging strategy for what we anticipated would be a very volatile year in 2022. The market action in these last 4 months is exactly the reason investors need a strategy to protect their wealth in volatile markets. Our Trend Technical Trader (TTT) service was originally a hedging service and although it now recommends long positions as well, TTT is still a hedging service with many hedging strategies that are doing very well as the market crashes.
If you do not have a hedging strategy, seriously consider subscribing to TTT which offers numerous hedging options. Note also, TTT includes the Gold Technical Indicator (GTI).
To ensure all readers have access to this hedge service, we temporarily reduced the price by 50%. Click button below to subscribe. It’s your money – take control!