Market Charts – September 1/22
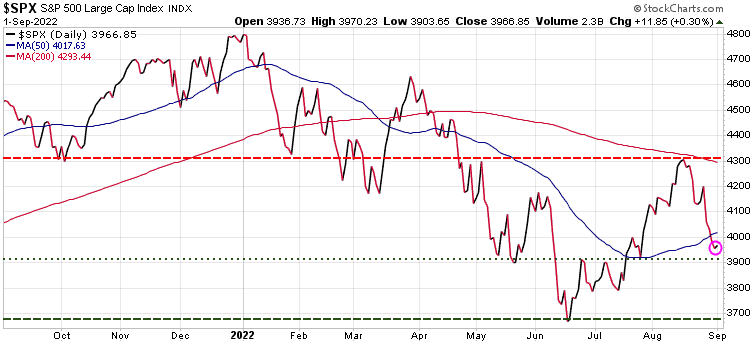
As noted to subscribers in Sunday’s issue of the Trend Letter, the the 50-DMA (blue wavy line) would be initial support for the S&P 500. We also noted that if that level did not hold it would open the door to retest the July lows (bottom green dashed horizontal line). After falling through the 50-DMA on Wednesday, the S&P 500 became oversold, so a brief rally was expected, which we saw today.
Looking ahead, if the market does not get back above the 50-DMA quickly, we can expect lower prices in the near-term. Initial support sits at the 3900 level, with that June low at 3665 being a critical support. We continue to suggest using any relief rallies rallies to take profits and reduce risk. Using hedging strategies is a great way to protect your long positions.
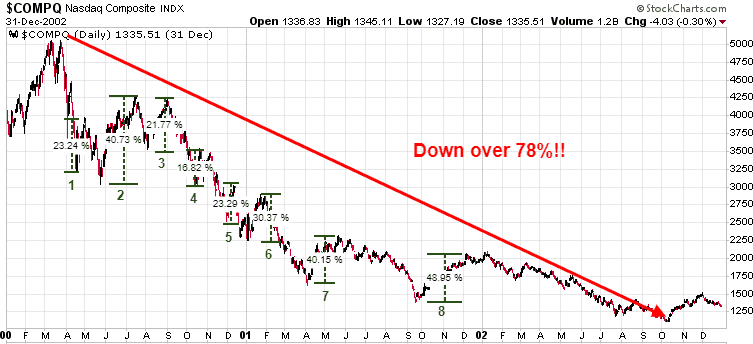
Below is a chart that we have repeatedly shown to our subscribers to warn them to be very careful with bear market rallies. In a bear market there will be multiple relief rallies, but these typically fail to make new highs, and instead retest the lows, often making even lower lows. Below we see the Nasdaq from the high in March’00 to the low in Oct ’02. In that over 2.5 year period there were 8 rallies of over 16%, with some over 40%, yet the Nasdaq remained in a long-term bear market and ultimately lost over 78%!
Our Trend Technical Trader (TTT) service highlights many hedging strategies for subscribers to consider to protect themselves in a bear market. These are very simple strategies to use, as simple as trading any stock online. Click here for more information.
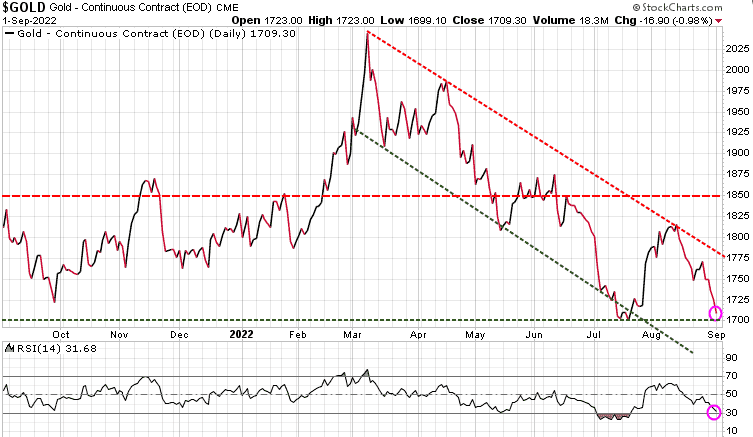
Gold continued its disappointing movement, continuing to trade in the downtrend channel it has been in since the March high. Gold is now testing its previous low near the 1700 level and could fall to the 1675 key support level before we see a turnaround. We have been alerting our subscribers that gold could be setting up for a strong run here very soon. Note at the bottom of the chart that based on RSI, gold is close to being oversold. We will send out BUY Alerts to subscribers if/when our model triggers the potential bottom.
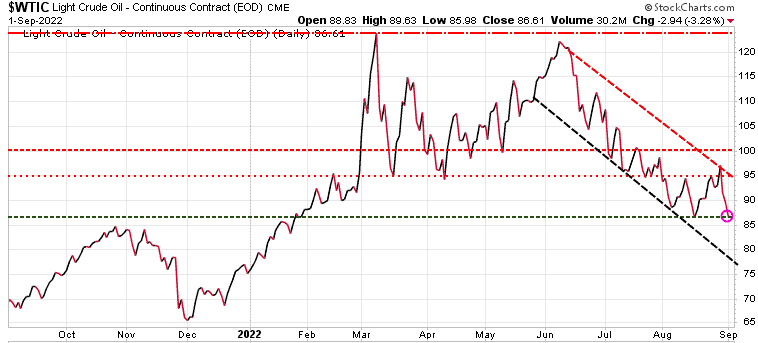
Oil has continued to trade in a downtrend channel since the high in early June. Back then, we warned that oil prices, along with most commodities, could get hit as we head toward a global recession. When oil recently dropped to the 87.00 range we told subscribers that a rally to 95.00 was likely and even a run to 100 was possible. Oil did indeed rally to 95.00 but could not reach 100, stopping out at 97.00 last week. Ultimately, we are very bullish on oil and commodities in general for the long-term, but as we get closer to a recession, expect weakness in oil and most commodities as we head into the fall.
Stay tuned!