Market notes – February 17/23
Note: The Trend Letter’s Martin Straith was interviewed on This Week In Money. To listen to the interview CLICK HERE. Martin’s interview starts at 41:50.
US debt to rise to~$51.5 trillion in 10 years!
There is a lot of noise in the US over the $31.4 trillion debt ceiling and how it may impact the economy. Before anyone gets to worried, it is important to note that they have raised the debt ceiling 78 times in the last 63 years, so the likelihood of it being raised again is pretty high.. What we found more fascinating, or disturbing, was the report from the US Congressional Budget Office warning that the US will add a massive $19 trillion to the national debt in the next 10 years.
“Over the long term, our projections suggest that changes in fiscal policy must be made to address the rising costs of interest and mitigate other adverse consequences of high and rising debt,” CBO Director Phillip Swagel wrote in a letter released along with the report.
The current US debt is $31.5 trillion. That works out to $94,000 per man, woman and child or $246,000 per taxpayer.
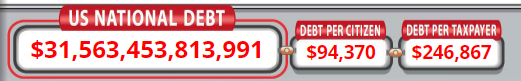
If we add another ~$20 trillion, that would result in a debt of almost $51 trillion, equalling close to $155,000 for per citizen and over $400,000 per taxpayer.
Who is going to buy all the government bonds?
For the decades, central banks have been the major buyers of government bonds. During Quantitative Easing the US Fed was buying $120 billion per MONTH in mortgage-backed securities & Treasury Bonds. This kept bond yields low and was a major factor in the 40-year decline in yields on government bonds. But as we can plainly see on this chart, that trend has ended as yields are now rising.
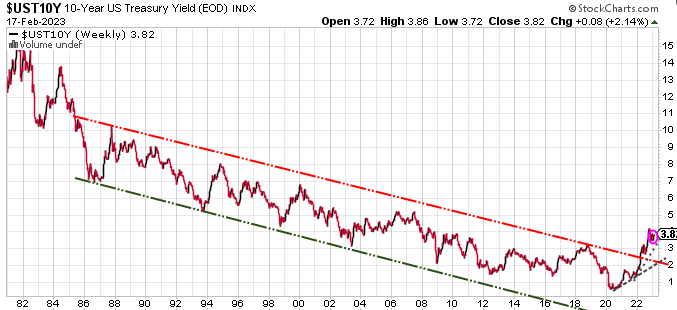
Itis not just that central banks are no longer the buyers of government bonds, itis the fact that they are now SELLERS of government bonds. Today, the US Fed is SELLING $95 billion of those bonds EVERY Month. So again, who is going to buy all these bond to pay for all the new & maturing debt?
And this problem is not just in the US or Canada, it is a global problem and one that we believe will take us into a global Sovereign Debt Crisis…meaning we will see countries defaulting on their debt. Inflation in Argentina is 98%. You can buy a 7-year bond is paying 50%. yield, but the question is would you lend Argentina your money for 7 years HOPING they pay you 50% each year and then give you back your principal in 7 years?
Are we getting a recession or not?
Many mainstream analysts are now suggesting that a recession is no longer likely. They may be right, but we keep seeing two leading indicators, both with near-perfect records suggesting that a recession is very likely.
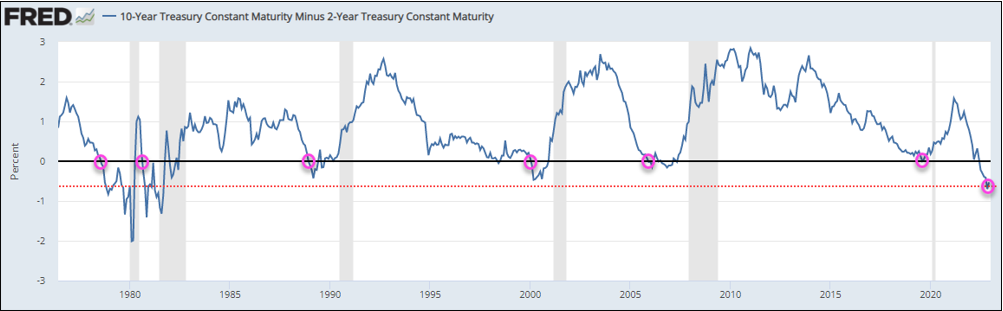
1. Inverted yield curve
Since 1955, there has been only one time where the yield curve inverted without there being a recession. And oday the yield curve is the most inverted it has been in over 40 years. Also, there have been ZERO times when inflation ran above 5%, with an inverted yield curve that did NOT result in a recession. Inflation today is over 6%.
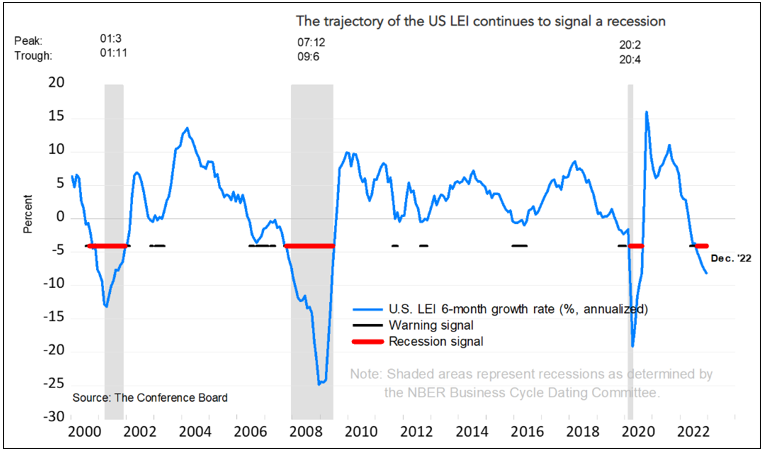
2. Also, the Conference Board’s Leading Economic Index has a remarkable history of accurately predicting recessions and it continues forecasting a recession.
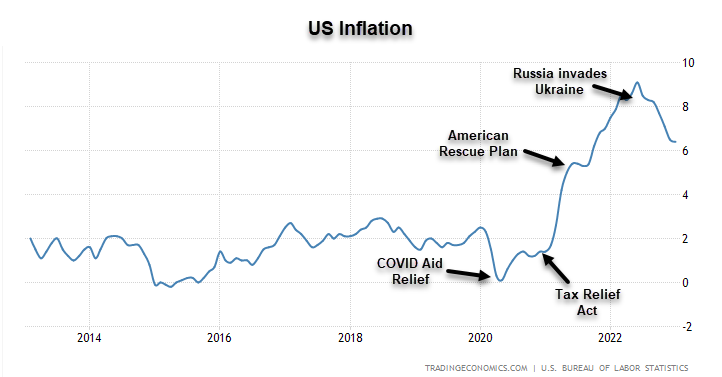
Inflation story
We need to remember that the inflation problem we have is NOT from Central Bank policy. They tried for 12 years to get inflation over 2%…couldn’t do it. This inflation started to rise as a result of COVID lockdowns. After locking down the global economy, that crushed the Supply Chain…that drove up prices. Then governments handed out $trillions in direct payments.
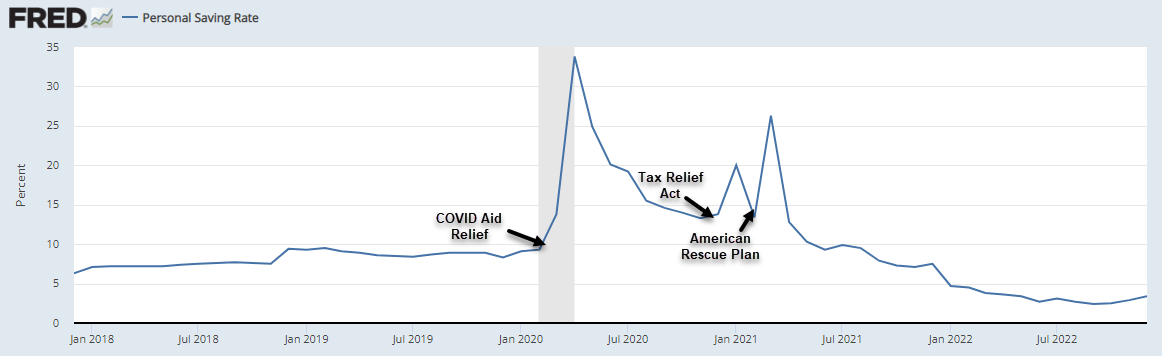
This pushed US savings rate from 8.3% of disposable income before the pandemic, to 34% during pandemic. But now because of high inflation and no more free money, US personal savings rate has plummeted below the pre-pandemic level. The Personal Savings rate is now just 3.4% of disposable income. That wealth effect is now gone, and people are racking up credit card debt now.
Big Tech, big change
While Tech stocks were the big winners in 2021, it was a totally different story in 2022, especially in the BIG Tech names
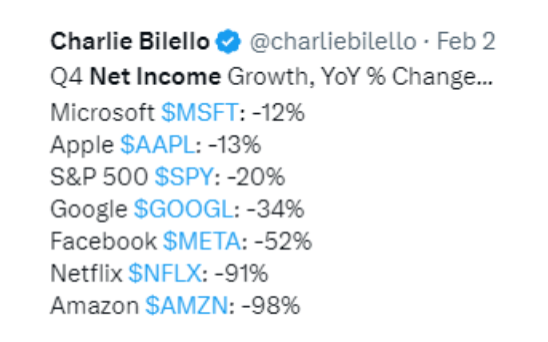
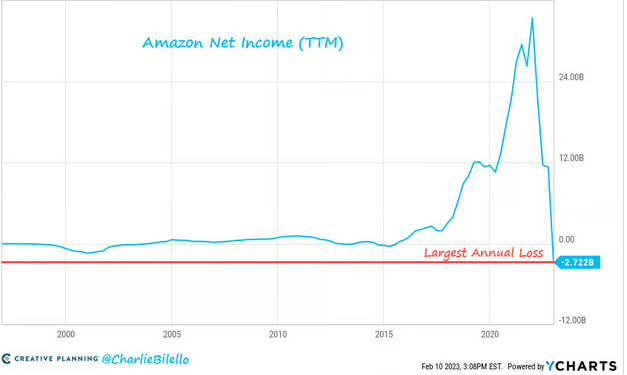
And to really get a grasp of what a difference a year makes, Amazon went from RECORD PROFITABILTY of $34 billion thanks to those government handouts during the pandemic, to a RECORD annual LOSS of $2.7 billion after all that free money dried up.
Tech stocks continue to be very volatile. To start this year, we have seen Google rally ~25% in January, but down ~13% so far in February. Amazon was up 37% in January, then down 15% so far in February. Tesla, up a whopping 98% in January, down ~10% in February.
Stay tuned!
In his interview on This Week in Money, Martin offered listeners some special prices for the three services Trend News provides. Use the links below to access those special prices.
All subscriptions in $US
Special Offers
| Service | Regular Price | Special Price | Saving | Subscribe |
|---|---|---|---|---|
| Trend Letter | $599.95 | $349.95 | $250 | Trend Letter $349.95 |
| Technical Trader | $649.95 | $349.95 | $300 | Trend Technical Trader $349.95 |
| Trend Disruptors | $599.95 | $349.95 | $250 | Trend Disruptors $349.95 |
| Better Deals | ||||
| Trend Letter + Technical Trader | $1,249.90 | $549.95 | $699.95 | Trend Letter & Technical Trader $549.95 |
| Trend Letter + Trend Disruptors | $1,199.90 | $549.95 | $649.95 | Trend Letter & Trend Disruptors $549.95 |
| Technical Trader + Trend Disruptors | $1,249.90 | $549.95 | $699.95 | Technical Trader & Trend Disruptors $549.95 |
| Best Deal | ||||
| Trend Suite: Trend Letter + Technical Trader + Trend Disruptors | $1,849.85 | $649.95 | $1,199.90 | Trend Suite: TL + TTT + TD $649.95 |