Why you should prepare your investment portfolio for an overbought market
We are providing this commentary to non-paid subscribers because we believe it is crucial for all investors to understand the current state of market sentiment. In our weekly issues of the Trend Letter, we regularly update various sentiment indicators to keep our subscribers well-informed about market trends and, equally importantly, investor sentiment.
Based on our analysis, one notable observation is the exceptionally high level of greed sentiment fueled by the Artificial Intelligence (AI) frenzy. Let’s take a look at some visual representations to illustrate this point:
- Heat map of S&P 500
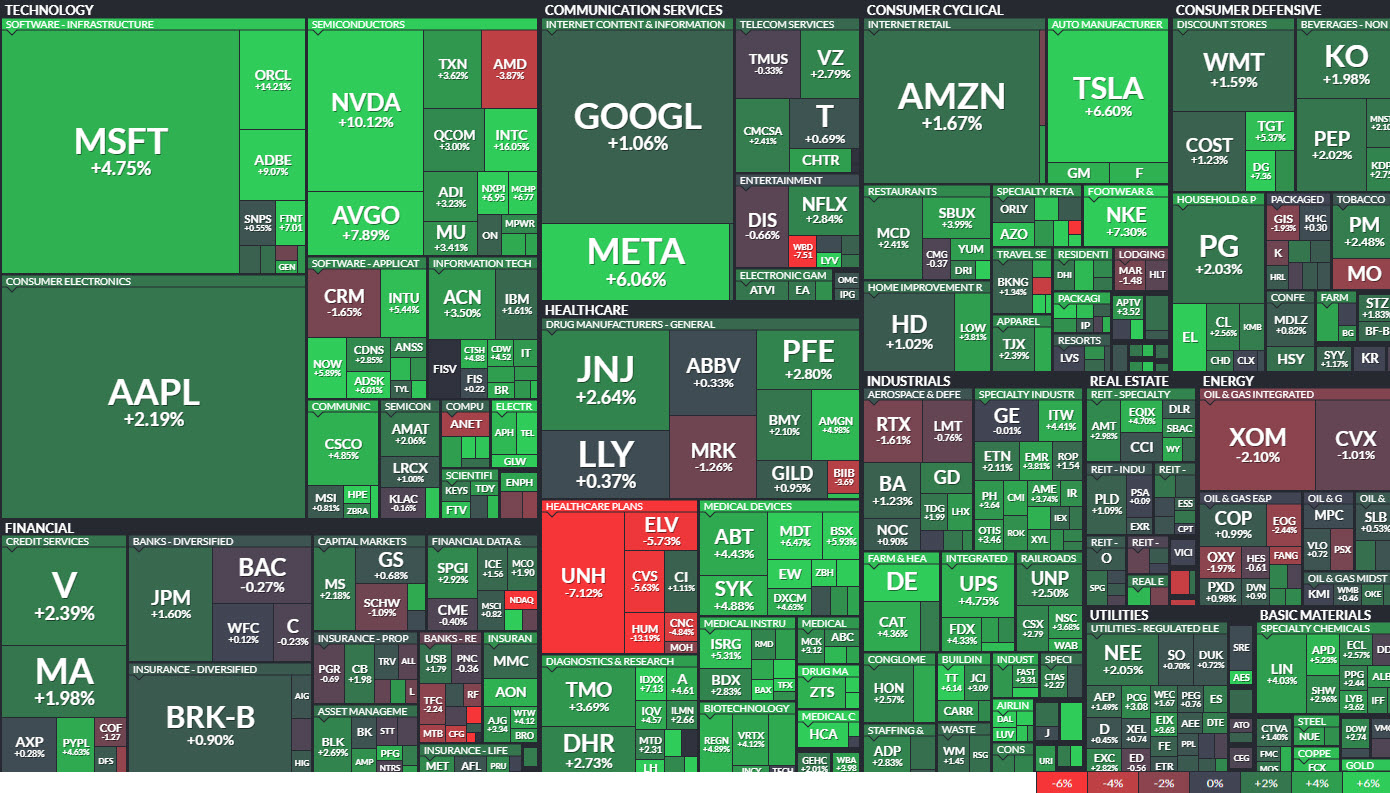
Above is an updated weekly heat map of the entire S&P 500 where the size of each stock symbol represents market capitalization. The heat map depicts a striking scene with a vast expanse of green, symbolizing the broad market’s alignment with the 8 to 10 AI stocks that spearheaded the substantial rally. Looking ahead, the crucial question is whether the prominent tech stocks will sustain their upward trajectory alongside the overall market or if their parabolic surge will trigger a downturn that affects the market as a whole.
2. Nasdaq 100 Index
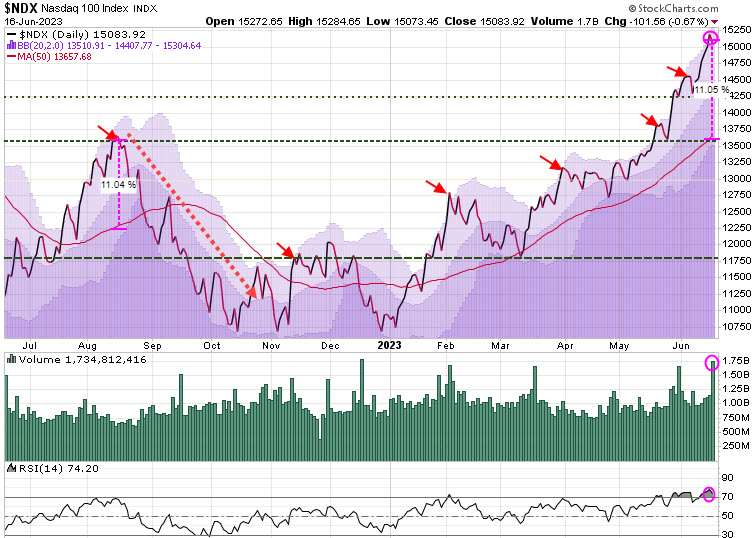
The current chart of the Nasdaq 100, which represents the top tech stocks, reveals a significant deviation of nearly 11% above its 50-Day Moving Average (DMA). This level is considered extreme, as the last time it reached such heights was in August, 2022, which was followed by a notable correction. Moreover, the presence of elevated green bars indicates a surge in trading volume, approaching record highs, suggesting that a vast majority of investors have already entered the market, leaving limited room for new buyers. Additionally, the Relative Strength Index (RSI) is at 74.20, and any reading above 70 indicaties an overbought condition, further highlighting the current situation.
While not saying this rally cannot persist, the indicators serve as a warning that we are approaching extreme levels.
3. Fear & Greed Index
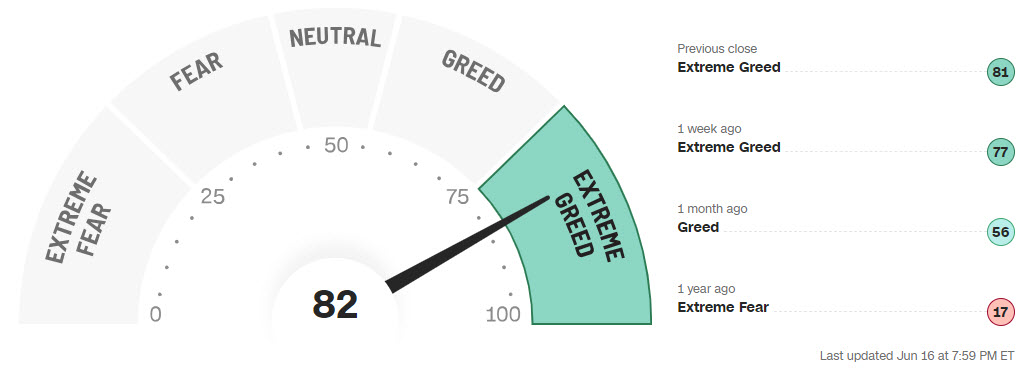
The CNN Fear & Greed Index has surged to 82, positioning it within the Extreme Greed range. This index often behaves like a pendulum, swinging back in the opposite direction once it reaches extreme levels at either end.
4. AAII Bullish Sentiment
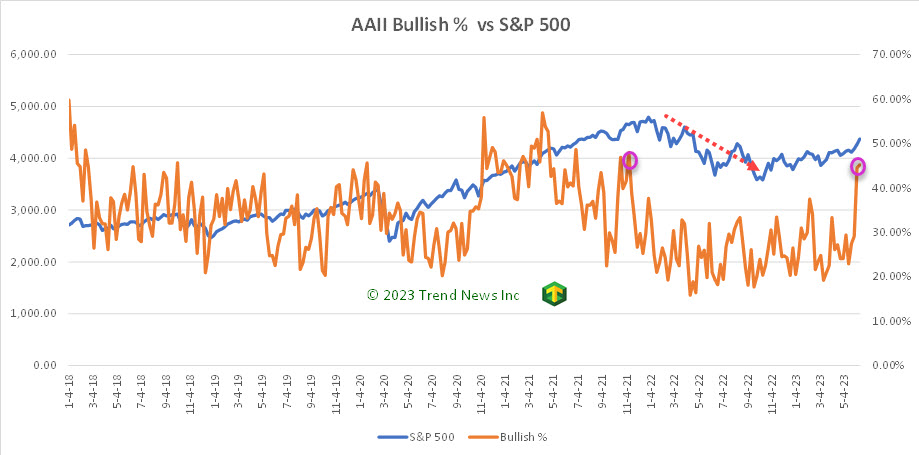
Every week, the American Association of Individual Investors (AAII) conducts a survey among its members, inquiring about their opinions regarding the market’s trajectory over the next six months. In the most recent survey, the AAII Bullish sentiment exhibited a sharp surge, rising from 25 to 45 in a straight upward trajectory. The chart above illustrates that the last time the AAII Bullish sentiment surpassed 45 was in late 2021, followed by a significant decline in the S&P 500 just over a month later, which persisted throughout 2022.
5. VIX Volatility
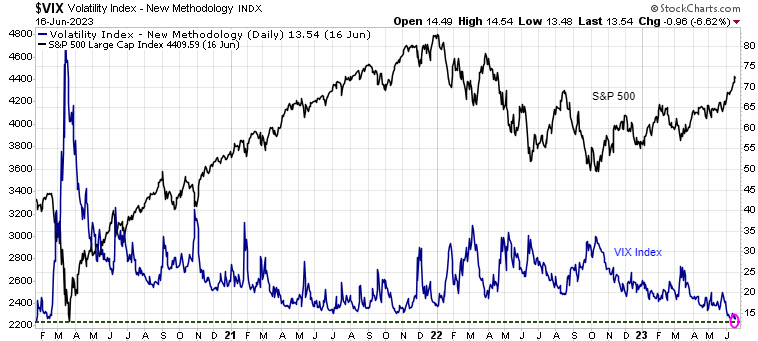
The VIX volatility index serves as a measure of investors’ risk-tolerance. A reading above 30 signifies increasing risk aversion, while readings below 20 indicate a ‘risk-on’ sentiment. Significant declines in the VIX often indicate a Fear Of Missing Out (FOMO) sentiment, where investors rush into the markets. When the majority of investors join the latest popular trend, it often coincides with a market peak.
Market shifts typically occur when ‘something’ breaks. The last time the VIX reached such low levels was just before the onset of COVID-19, leading to global economic lockdowns. What could potentially trigger the next market-breaking event? A recession would certainly qualify as a significant factor.
How to prepare your investment portfolio?
Firstly, it is important to note that we are not predicting an immediate market crash. However, several indicators are suggesting that the market is becoming extremely overbought. If you have a substantial investment, now is a good time to assess your exit strategy in case a correction occurs. Here are a couple of options to consider:
a) Review your SELL Stops: Take a look at your predetermined selling prices for each position, known as SELL Stops. If you have experienced significant gains, you may want to secure some or all of those profits by adjusting your SELL Stops closer to the current market prices. If the stock continues higher, continue to raise your SELL Stop.
b) Hedge your positions: If you prefer to retain your positions and anticipate just a minor correction, consider incorporating hedging positions. There are various methods available, such as using inverse Exchange Traded Funds (ETFs). Our Trend Technical Trader service was initially designed as a hedging service and offers multiple strategies to safeguard your portfolio during market corrections.
We trust this information highlights the overbought nature of the current market and the increased likelihood of a correction. If you are not currently subscribed to any of our services, but are interested, we are offering significant discounts to provide investors with access to our strategies for both upward and downward market movements.
Stay tuned !