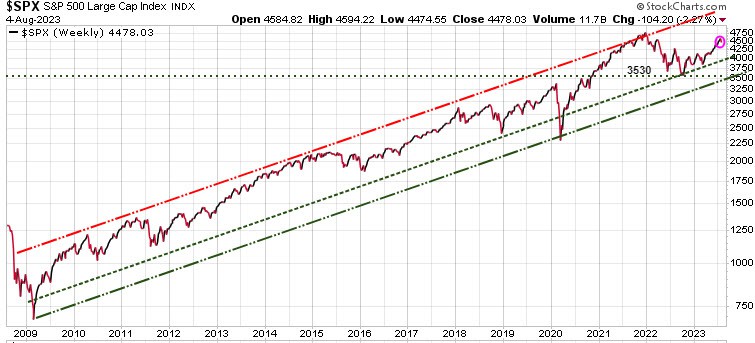
Navigating the Currents of Rising Interest Rates and Market Uncertainties
Rising yields
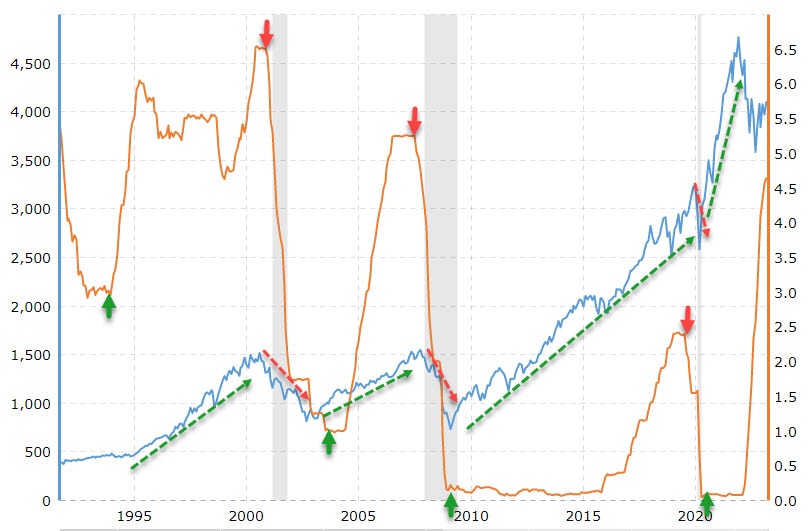
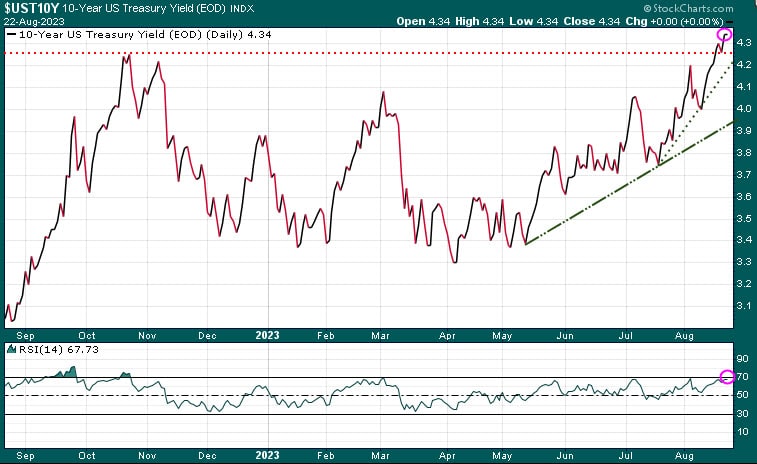
The significant surge in interest rates throughout 2022 has been extensively documented and has deeply impacted investors, leading to diminished performance in both the stock and bond (debt) markets over the past year. Coming into 2023, the common theory was that the pronounced and continuous escalation of rates would ease, as the primary focus would shift from combating high inflation to addressing slower growth. Although this scenario did play out during much of the current year, longer-term rates has seen a marked increase in recent weeks. Notably, the 10-year Treasury yield reached its highest point since 2007 this week.
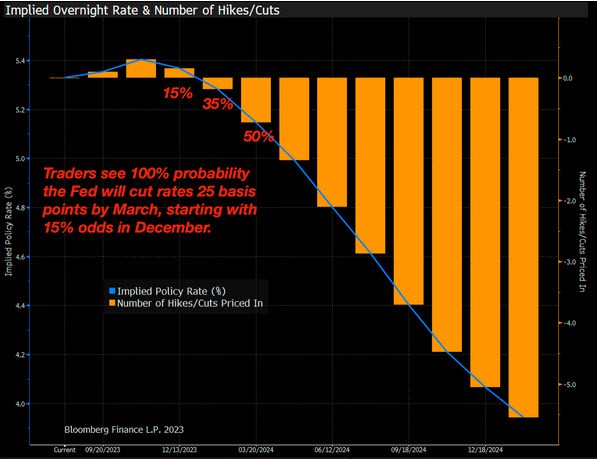
As highlighted in recent Trend Letter updates, the notable increase in interest rates can be attributed primarily to a shift in perceptions surrounding the Federal Reserve’s policy. The previously optimistic view held by the market, anticipating swift changes in the Fed’s stance including potential rate cutbacks, has encountered a dose of reality. The persistent strength in economic growth is leading the markets to now acknowledge that the Fed intends to do as it has been saying it intended to do, keep its policy rate ‘higher for longer.’ This adjustment is now manifesting in higher longer-term yields.
As we look at the bottom of the chart, we can see that based on RSI, this rise in yields is getting technically overdone. Fed Chair Powell speaks from Jackson Hole on Friday, and should he be overly hawkish, these yields will move even higher. Conversely, a dovish tone in his communication could potentially prompt a moderation in rates.
Mortgage rates
Naturally, with the increase in the 10-year yield, there is a corresponding uptick in mortgage rates. Presently, 30-year mortgage rates in the US have surpassed 7%, marking their highest point since April 2002.

Massive government debts
In their efforts to rein in inflation, the Bank of Canada and the US Federal Reserve are confronted with a significant adversary: the substantial fiscal outlays by their respective federal governments. In the case of the US, within the initial 52 business days after the debt ceiling accord was reached in early June, government expenditure has reached an astounding $1.72 trillion. This equates to an average daily expenditure exceeding $33 billion.
As these governments intensify their spending and subsequently accumulate more debt, they must then secure additional funds to support these financial outlays. Consequently, they find themselves compelled to repeatedly access the bond market to issue more bonds. This sequence of events contributes to the elevation of interest rates, thus heightening inflationary pressures.
The following visual underscores the level of unsustainability of the US debt. While Canada’s situation may not be as dire as that of the US, the trend is similar.

Debt servicing costs
Rising interest rates impact consumers, leading to increased mortgage and loan payments. Governments also face growing financial responsibilities, especially regarding interest on their mounting debt. According to the St. Louis Federal Reserve, the US is currently spending around $970 billion solely on interest payments—a significant allocation for debt servicing, nearing the trillion-dollar mark.

Food and energy inflation
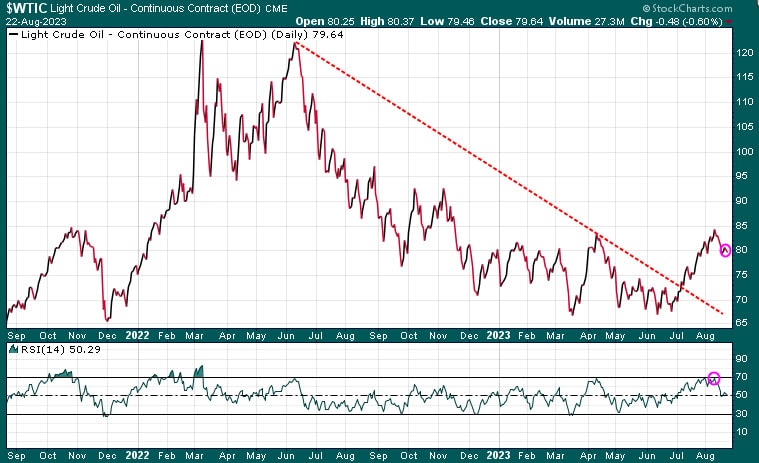
Two other significant contributors to inflation are energy and food. Following its dismal performance in 2022, the oil sector has shown a notable recovery, breaking out of its downward trend. In recent weeks, oil has stood out as a positive performer. The subsequent chart illustrates that oil experienced an overbought condition last week and has since undergone a modest retracement. A potential buying opportunity might present itself if a pullback occurs to the 76.00 level.
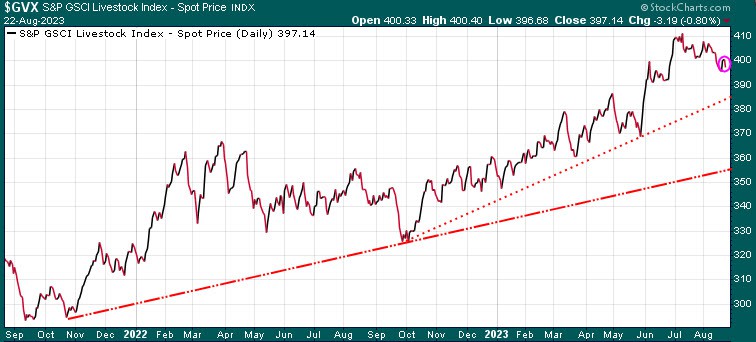
Those who have been recently purchasing beef are well aware of the significant increase in cattle prices that has taken place since October.
Nvidia leads the markets
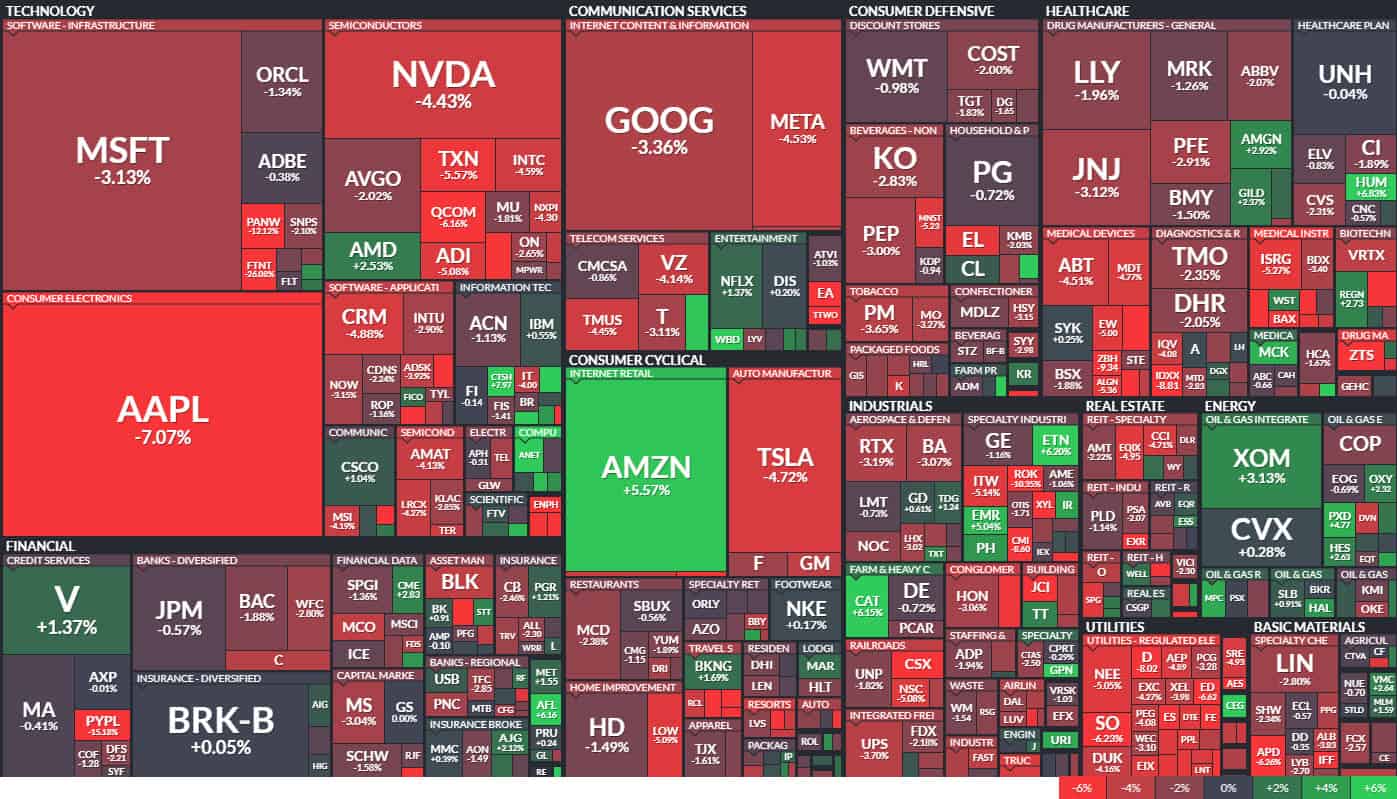
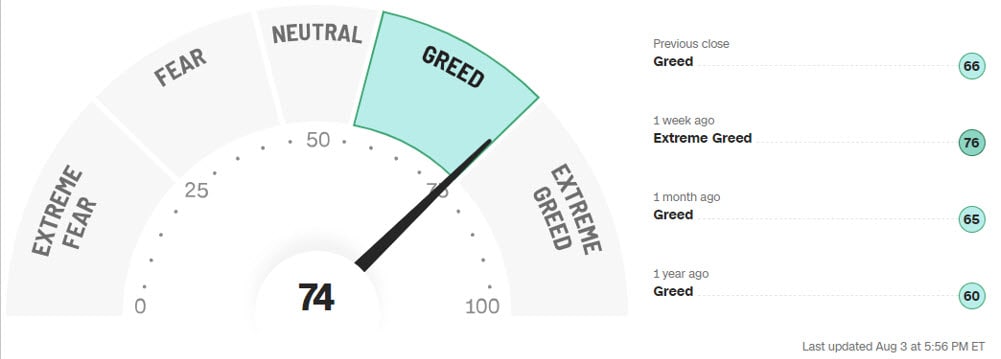
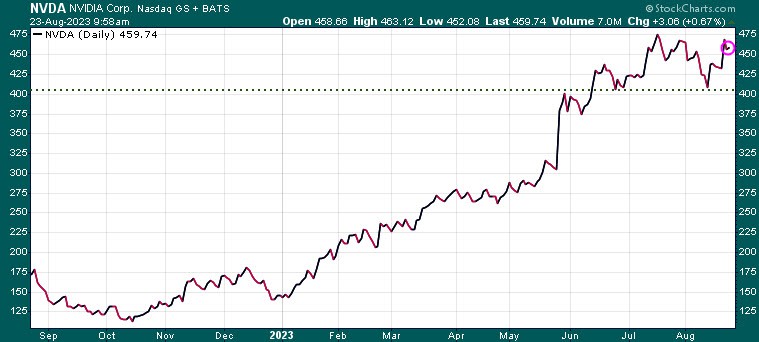
Later today, we have the eagerly anticipated Nvidia earnings report, and later this week, Jerome Powell is scheduled to speak at the Jackson Hole event, both of which represent significant uncertainties for the market. Nvidia is set to release its earnings after Wednesday’s market close, and the prevailing sentiment is that there will be another massive earnings beat and an optimistic projection concerning the demand for artificial intelligence. Analysts from various financial institutions are currently revising their price targets in anticipation of these earnings. It’s worth noting that the stock is currently trading at a valuation of 233 times its earnings, necessitating an extraordinary positive surprise to maintain the remarkable upward trajectory. While there’s always a possibility that Nvidia pulls off the massive earnings beat, we will be watching the 405.00 support level. If that level is breached, we could see much lower levels and it will likely drag the rest of the market down with it.
Fed speak
Federal Reserve Chair Jerome Powell is slated to deliver a speech at 10 AM during the Jackson Hole event on Friday. This presentation has captured the undivided attention of the global financial community. Powell has remained resolute in his mission to combat inflation, all the while suggesting that yields will continue to climb as part of this effort. Up to now, the markets did not believe the Fed, leading to a scenario often described as ‘fighting the Fed.’ The pivotal question now arises: Will the market accept Powell suggesting that stronger growth will require even higher rates?
We keep tabs on all sectors in the Trend Letter and issue a full report each Sunday evening. If you are not a subscriber but would like to get a deeper insight into the driving forces behind these markets, visit us at www.thetrendletter.com or email us at info@thetrendletter.com.
Stay tuned!
We are offering discounted prices for our three services & with each new subscription this week, we will donate $100 to Special Olympics. See below.
Trend Letter:
Since start-up in 2002 Trend Letter has provided investors with a great track record, giving exceptionally accurate information about where the markets are going, and it has explained in clear, concise language the reasons why. Using unique and comprehensive tools, Trend Letter gives investors a true edge in understanding current market conditions and shows investors how to generate and retain wealth in today’s climate of extreme market volatility.
A weekly publication covering global bonds, currencies, equities, commodities, & precious metals. Publishes every Sunday evening, covers equites, currencies, precious metals, commodities, and bonds. Each weekly issue is about 50 pages, mostly charts, with key bullet points to make easy to understand. A 10-15 min read
Timer Digest says: “Trend Letter has been a Timer Digest top performer in our Bond and Gold categories, along with competitive performance for the intermediate-term Stock category.”
Technical Trader:
Trend Technical Trader (TTT) is a premier hedging service, designed to profit in both up and down markets.
TTT isn’t just a hedging service. Its timing strategies have returned fantastic gains on the long side. See examples here
Included is our proprietary Gold Technical Indicator (GTI).
Trend Disruptors:
Disruptive technology trends will propel our future and the reality is that no industry will go untouched by this digital transformation. At the root of this transformation is the blurring of boundaries between the physical and virtual worlds. As digital business integrates these worlds through emerging and strategic technologies, entirely new business models are created.
Trend Disruptors is a service for investors seeking to invest in advanced, often unproven technology stocks on the cheap, with the objective to sell them when masses finally catch on. Covering Artificial Intelligence (AI), Virtual Reality (VR), Augmented Reality (AR), 5G, Quantum Computing & many more.
All subscriptions in $US
Special Offers
| Service | Regular Price | Special Price | Saving | Subscribe |
|---|---|---|---|---|
| Trend Letter | $599.95 | $349.95 | $250 | Trend Letter $349.95 |
| Technical Trader | $649.95 | $349.95 | $300 | Trend Technical Trader $349.95 |
| Trend Disruptors | $599.95 | $349.95 | $250 | Trend Disruptors $349.95 |
| Better Deals | ||||
| Trend Letter + Technical Trader | $1,249.90 | $549.95 | $699.95 | Trend Letter & Technical Trader $549.95 |
| Trend Letter + Trend Disruptors | $1,199.90 | $549.95 | $649.95 | Trend Letter & Trend Disruptors $549.95 |
| Technical Trader + Trend Disruptors | $1,249.90 | $549.95 | $699.95 | Technical Trader & Trend Disruptors $549.95 |
| Best Deal | ||||
| Trend Suite: Trend Letter + Technical Trader + Trend Disruptors | $1,849.85 | $649.95 | $1,199.90 | Trend Suite: TL + TTT + TD $649.95 |


