Market Notes – August 5/23
From Yahoo News:
The stock market has soared so far this year, but expect the month of August to be lackluster if the past several decades are any guide.
August is the second-worst month for the S&P 500 and Nasdaq, and the worst for the Dow Jones Industrial Average over the last 35 years, according to data compiled by Stock Trader’s Almanac.
The site’s analysis also shows the August before a presidential election year points to a particularly weaker month, as the Dow Jones Industrial Average, the Nasdaq, and S&P 500 all declined in the last three pre-election years: 2019, 2015, and 2011.
Dating back even further to 1950, the S&P 500 has historically been flat on average in August and generated median gains of 0.6%, according to data compiled by LPL Financial.
And with stocks on a roll so far in 2023 and relatively weak seasonal trends ahead, “we suspect this could be a logical spot for a pause or pullback in this rally,” Adam Turnquist, chief technical strategist at LPL Financial told Yahoo Finance.
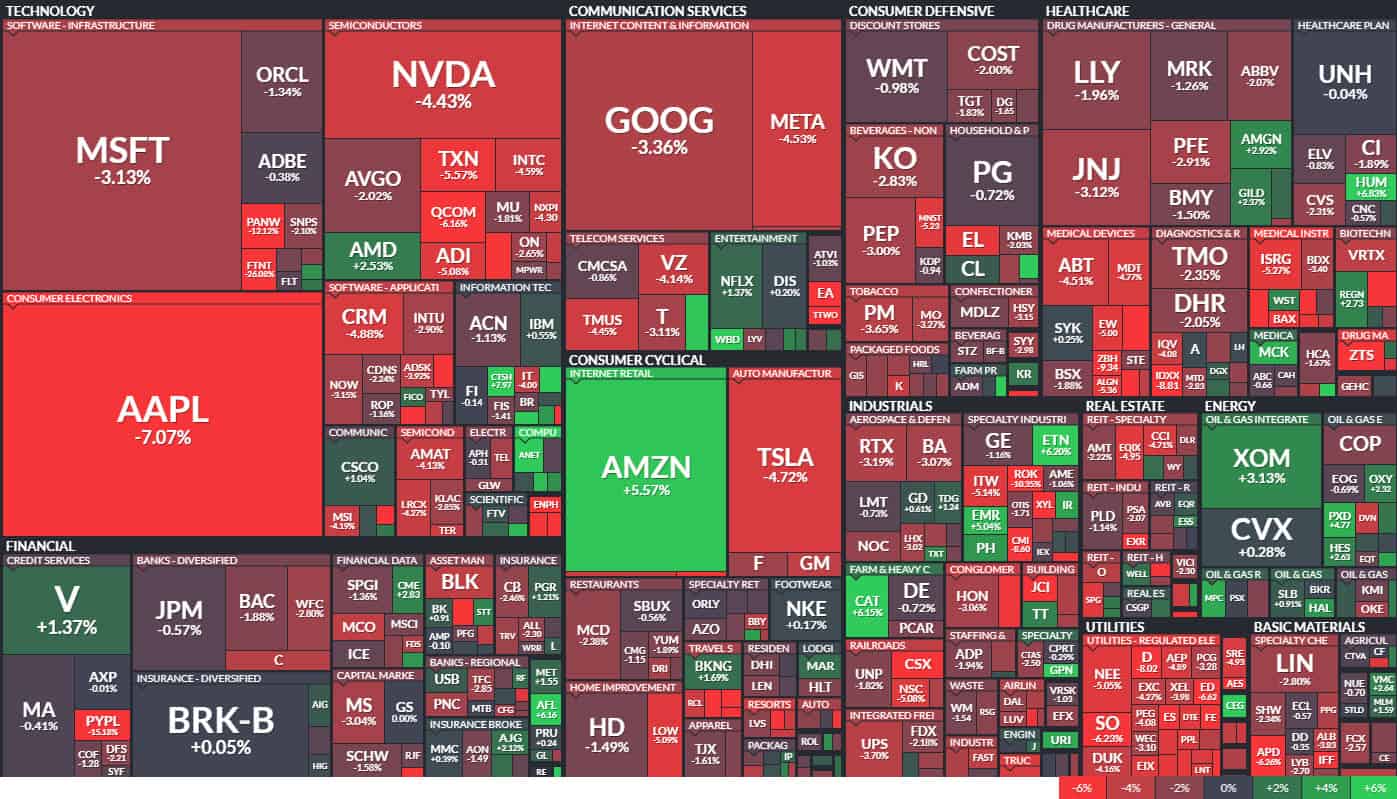
The chart below is the weekly heatmap Martin mentioned in his interview with Jim Goddard on Howestreet’s This Week in Money (Click here for that interview. Martin’s interview starts at 39:32). Each of the S&P 500 stocks is represented by a block. The size of the block represents its valuation and the colour represents whether it is up (bright green the highest) or down (bright red the lowest). As we can see, there was a lot of red this week.
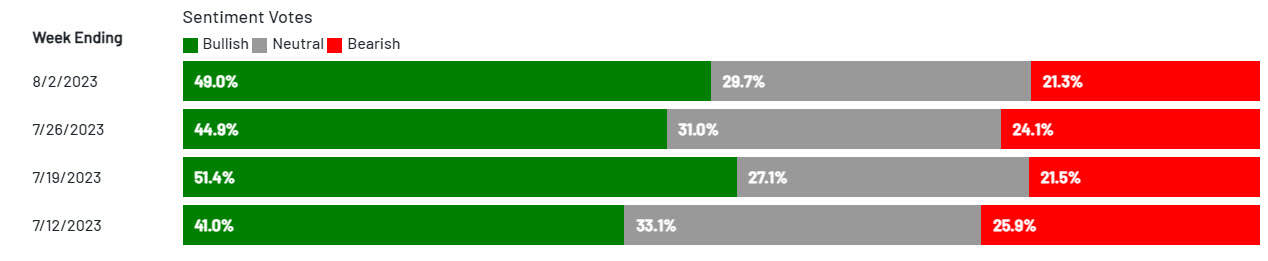
Every week the American Association of Individual Investors does a survey asking their members ‘what are your expectations that stock prices will rise over the next six months?’ Historic average of bullish expectations is 37%. This week it is 49%, the 2nd highest it has ever been.
That is the 9th consecutive week it has been above the historical average. So, clearly, that group is still very optimistic.
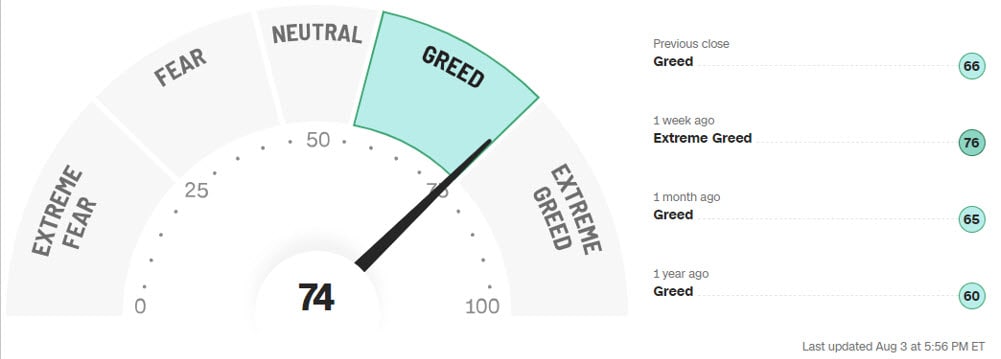
CNN’s Fear & Greed is another indicator that gives a sense of where investor sentiment is. They use 7 indicators from moving averages, put/call ratios, Vix Volatility etc, so a fairly broad range of indicators.
Sentiment is at a high Greed level, just under the Extreme Greed level. This gauge is often a contrarian indicator, meaning we may be close to a top, so we will see if this market pull back has any legs.
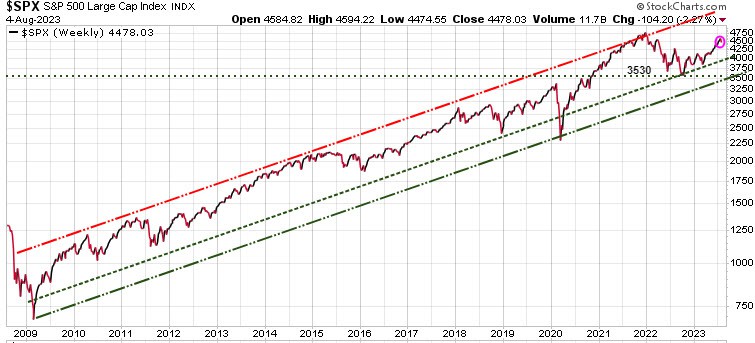
Looking at the big picture, the S&P 500 is still solidly in a long-term bull market since 2009. Despite the many bearish and recessionary signals, there is a strong momentum in the markets, as the markets have continued to climb a Wall of Worry here.
To test the initial uptrend line would see a correction to the 4000 level, which would be a ~11% decline from the current 4500 range. Near-term, our model is looking for a test of the 4250 level support. The 3530 level is a key support level for the S&P500.
Fitch downgraded the United States’ top-notch credit rating by a step on Tuesday, citing a growing federal debt burden and an ‘erosion of governance’. They also commented on the expected fiscal deterioration over the next three years, and a high and growing general government debt burden. They talk about repeated debt limit standoffs and last-minute resolutions.
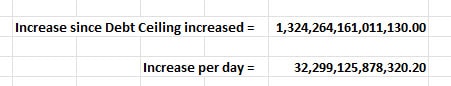
The numbers below are straight from the US Treasury Dept data. What it shows is that from June 2/23 when the debt ceiling agreement was in place, till the end of July, the US government has increased their spending by $1.32 trillion. That occured over 41 business days, so that equals $32.3 billion per day.
Also, the US Treasury just announced that they need to boost their borrowing to $1.03 trillion through the rest of 2023.
The US debt is now at $32.7 trillion and equals $97, 489 per citizen and $253,686 per tax payer.

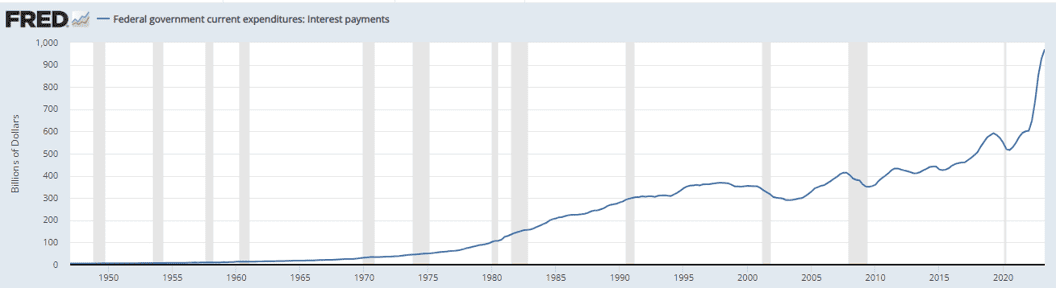
In the past year, US interest expenses have surged almost 50% to $970 billion, so nearly $1 trillion on an annualized basis. That’s $970 billion per year to pay interest on their debt.
They keep piling on more debt every day, so this interest payment will keep rising. To get some perspective, at $970 billion for interest on their debt, it is even more than the $963 billion the US spends for military and defense spending.
In the US, mandatory government spending includes Social Security, Medicare, and Interest on the national debt. So, in order to balance their budget while maintaining mandatory and defense spending, the US congress would have to eliminate ALL other spending.
Which of course they are not going to do, so the deficits and debt will continue to rise.
Stay tuned!