Market Notes – September 30/23
Martin Straith of the Trend Letter was on This Week in Money with Jim Goddard in Friday. Below are some of the charts Martin was referring to in the interview. Martin’s interview starts at 11:05, click here to listen to interview. In an effort to help raise money for Special Olympics, at the end of this blog are Special Offers, up to 65% off our services. For every new subscription this week, we will donate $100 to Special Olympics.
Stock Market:
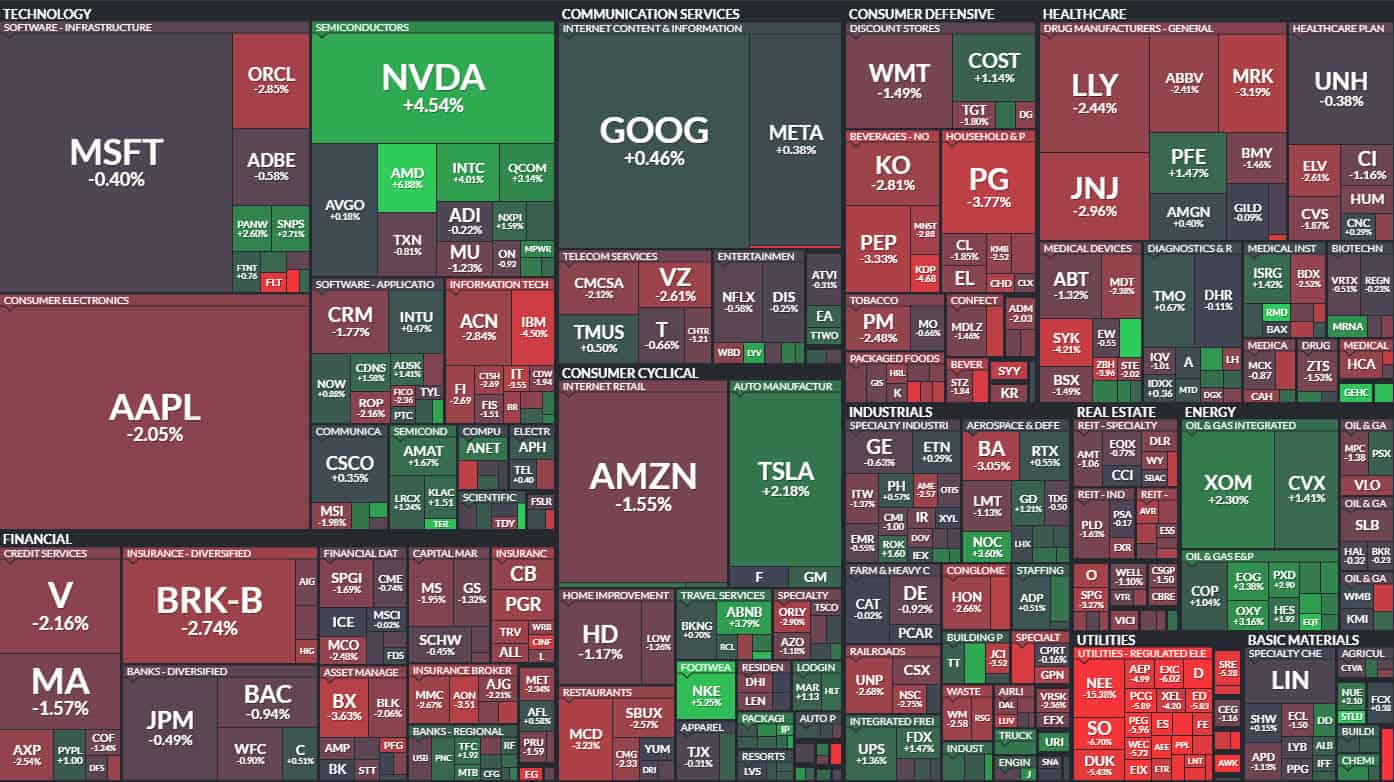
Following is a heatmap of the S&P 500. As we can see, it was a mixed bag last week with Nvidia, Tesla and Google all ending the week positive while there was also plenty of red displayed.
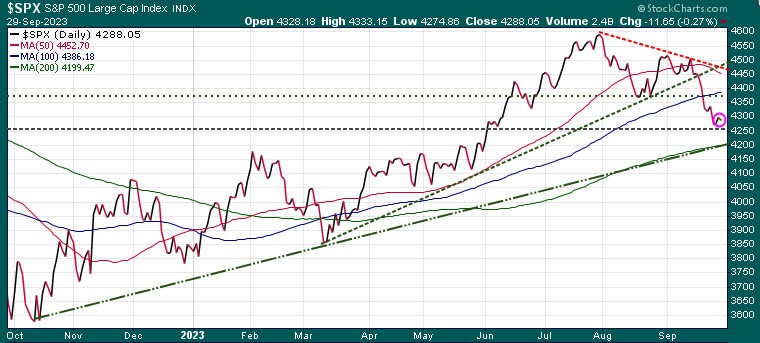
August and September are the weakest months for equities and the last week of September is the worst week. That seasonal trend has played out perfectly where we have seen S&P 500 down ~7% in that timeframe. The key here is that the S&P 500 has dropped below both its 50-DMA (red wavy line) and 100-DMA (blue wavy line) and closed the week at 4288.
The 200-DMA (green wavy line) is just below 4200, which happens to coincide with its year-long uptrend line (green diagonal line). A break below that 4200 level would suggest things could get a little more dicey. But right now, the Relative Strength Index was at ~26 the other day and any reading under 30 is considered extremely oversold, so we should see at least a rally soon.
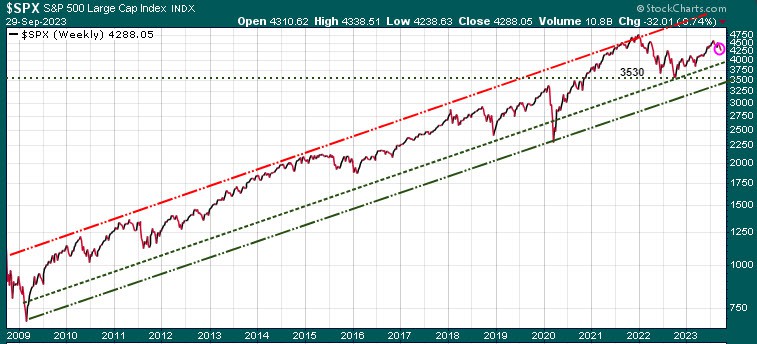
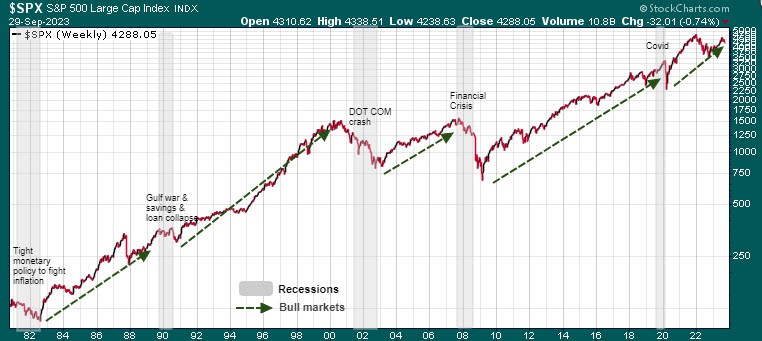
In the bigger picture, the S&P 500 has been in a strong uptrend channel since the 2008 Financial Crisis. The middle rung of that uptrend channel sits at just under the 4000 level. If we saw the S&P 500 drop below that level, then we would likely be headed for a much deeper correction.
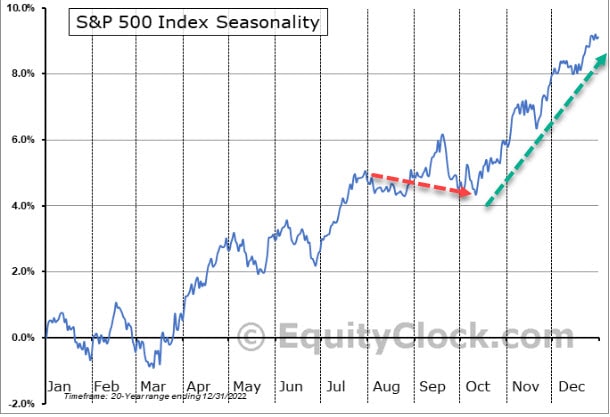
While August and September are weakest months based on seasonality, that weakness typically runs into the first half of October. But, from mid-October to year-end, that is typically the strongest period for equities.
Oil:
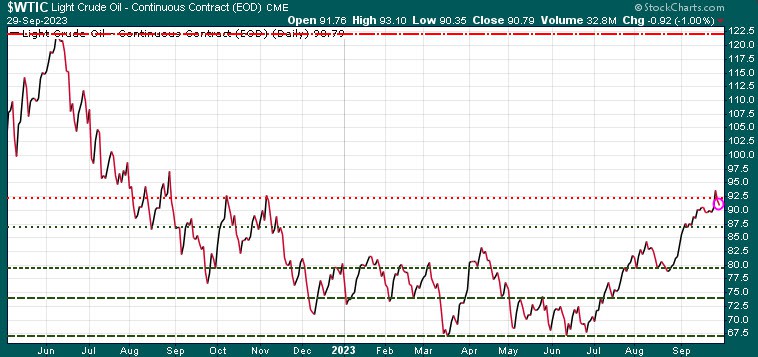
Oil continued its strong rally, hitting just under our initial target of 94.00. That’s up almost 40% from the 66.00 range in June.
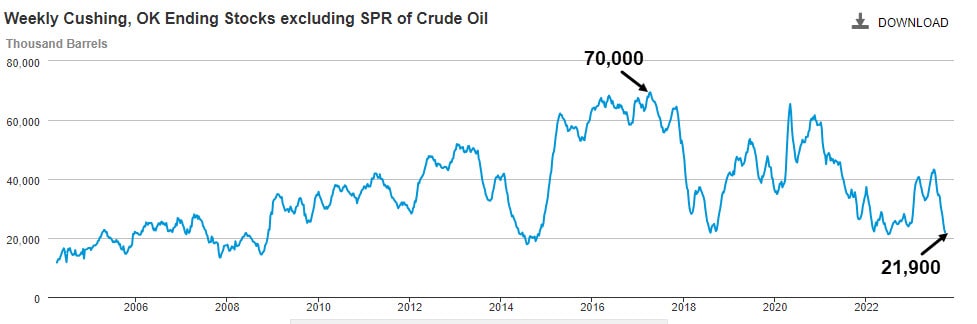
One of the main reasons for oil rise has been very low inventories. Inventories at the key Cushing oil hub are at the lowest level since June 2022. There are 21.9 million barrels of inventory at the Cushing hub, down from the peak of over 70 million in 2017. Back then oil was trading at over 120.00 versus the 91.00 level today
Other bullish drivers for oil are the production cuts of 1.4 mb/day from the Saudis and Russia which they have extended to year-end. Strong demand has also contributed to higher prices
At this point oil is technically overbought, with Relative Strength Index recently at 78.00 with anything over 70 being considered overbought. Short-term we could see a retreat to the mid 80’s level
On the bearish side we have the weak economy in China, plus recession in Germany, Sweden, much of the eurozone and potentially Japan.
Near-term support sits at 86.00, 79.70, & then 74.00.
Near-term resistance is at 96.00, then 100.00.
Longer-term we expect to see 100.00 and then 150.00 in the next one to three years.
Gold:
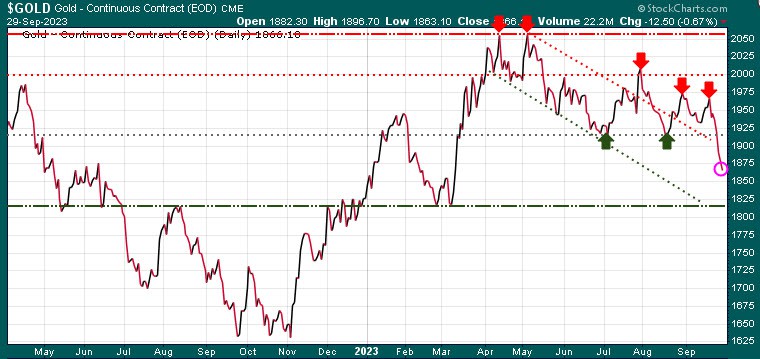
Gold has been hit by a strong $US and ever since the first of August gold has trended lower, falling, to 1,866 on Friday. Since making a double top at 2,070 in April-May, gold has been unable to break through and close above the 2,000 resistance.
Based on RSI, gold is oversold here, so we should see at least a bounce soon.
Near-term resistance is 1,900, 1,925, 1,975, then 2,000
Next key support level is 1,860, then & really strong support at 1,825
If it does drop to 1,825, that would likely trigger several new BUY alerts from our models.
Credit Debt:
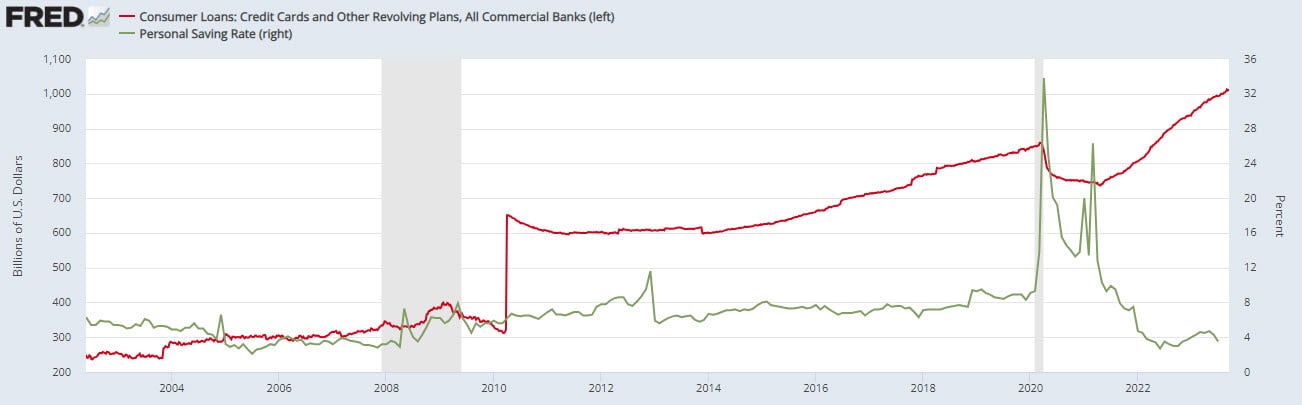
After the massive $5 trillion stimulus packages sent out during Covid, the US personal savings rate skyrocketed from 8% to almost 34%. But now all that money have been spent and the savings rate has plummeted to 3.8%, the lowest since the 2009 Financial Crisis.
Now with food, shelter and energy prices still very high, many consumers are tapped out and are using their credit cards to pay for necessities. Credit card debt in the US is now over $1 trillion, that is a rise of $250 billion in just the last 2.5 years.
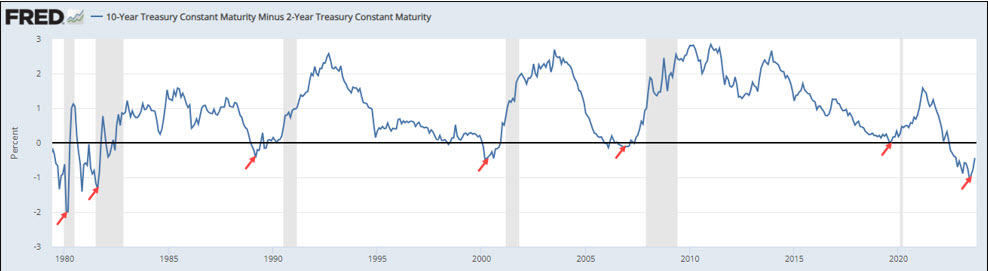
Recession:
Historically, an inverted yield curve is a leading indicator of a recession. A yield curve is inverted when the short-term yield is higher than the long-term. Today the US 1-year is paying 5.45%, the 10-year is paying 4.57%. Since 1955 (68 years), there has been only one time where the yield curve inverted without there being a recession. This is a leading indicator, meaning the inversion of the yield curve happens before the recession, typically 12-24 months. The current yield curve has been fully inverted since June 2022, so we are now more than 15 months into this inversion, suggesting if we are going to get a recession, it will likely be in the first half of 2024.
The good news is, if we do get a recession, at the end of the recession is a great buying opportunity. During a recession, stocks get crushed, the markets crash. But once everyone is out, that is when you want to have cash ready to scoop up the bargains.
The last 5 recessions provided some great opportunities. So if we get a recession, have your cash ready and wait for our BUY signals!
Stay tuned!
We are offering discounted prices for our three services and with each new subscription this week, we will donate $100 to Special Olympics. See Special Offers below.
Trend Letter:
Since start-up in 2002 Trend Letter has provided investors with a great track record, giving exceptionally accurate information about where the markets are going, and it has explained in clear, concise language the reasons why. Using unique and comprehensive tools, Trend Letter gives investors a true edge in understanding current market conditions and shows investors how to generate and retain wealth in today’s climate of extreme market volatility.
A weekly publication covering global bonds, currencies, equities, commodities, & precious metals. Publishes every Sunday evening, covers equites, currencies, precious metals, commodities, and bonds. Each weekly issue is about 50 pages, mostly charts, with key bullet points to make easy to understand. A 10-15 min read
Timer Digest says: “Trend Letter has been a Timer Digest top performer in our Bond and Gold categories, along with competitive performance for the intermediate-term Stock category.”
Technical Trader:
Trend Technical Trader (TTT) is a premier hedging service, designed to profit in both up and down markets.
TTT isn’t just a hedging service. Its timing strategies have returned fantastic gains on the long side. See examples here
Included is our proprietary Gold Technical Indicator (GTI).
Trend Disruptors:
Disruptive technology trends will propel our future and the reality is that no industry will go untouched by this digital transformation. At the root of this transformation is the blurring of boundaries between the physical and virtual worlds. As digital business integrates these worlds through emerging and strategic technologies, entirely new business models are created.
Trend Disruptors is a service for investors seeking to invest in advanced, often unproven technology stocks on the cheap, with the objective to sell them when masses finally catch on. Covering Artificial Intelligence (AI), Virtual Reality (VR), Augmented Reality (AR), 5G, Quantum Computing & many more.
All subscriptions in $US
Special Offers
| Service | Regular Price | Special Price | Saving | Subscribe |
|---|---|---|---|---|
| Trend Letter | $599.95 | $349.95 | $250 | Trend Letter $349.95 |
| Technical Trader | $649.95 | $349.95 | $300 | Trend Technical Trader $349.95 |
| Trend Disruptors | $599.95 | $349.95 | $250 | Trend Disruptors $349.95 |
| Better Deals | ||||
| Trend Letter + Technical Trader | $1,249.90 | $549.95 | $699.95 | Trend Letter & Technical Trader $549.95 |
| Trend Letter + Trend Disruptors | $1,199.90 | $549.95 | $649.95 | Trend Letter & Trend Disruptors $549.95 |
| Technical Trader + Trend Disruptors | $1,249.90 | $549.95 | $699.95 | Technical Trader & Trend Disruptors $549.95 |
| Best Deal | ||||
| Trend Suite: Trend Letter + Technical Trader + Trend Disruptors | $1,849.85 | $649.95 | $1,199.90 | Trend Suite: TL + TTT + TD $649.95 |