Seasonal signals point to impending pullback!
/in The Trend Letter /by Trend LetterAs an investment newsletter, our commitment is to empower investors with information that facilitates well-informed and successful decision-making. When investing in stocks, grasping the inherent trends within a market cycle becomes of vital importance. Charles Dow, a foundational figure at Dow Jones & Company and a significant contributor to the creation of the Dow Jones Industrial Average (DJIA), consistently drew parallels between the dynamics of the stock market and ‘market tides,’ illuminating distinctive patterns and movements. Dow’s philosophy rested on the notion that the market, much like the rhythmic ebb and flow of sea tides, experiences regular and predictable cycles.
We are presenting a chart that has been shared with our subscribers recently, preparing them for an anticipated short-term correction in the markets. Examining the chart reveals a robust period for the S&P 500 from early October to year-end, with a recurring pattern of a short-term correction in early December, as highlighted by the pink circle. Following this correction, the market typically resumes its upward bullish trajectory.
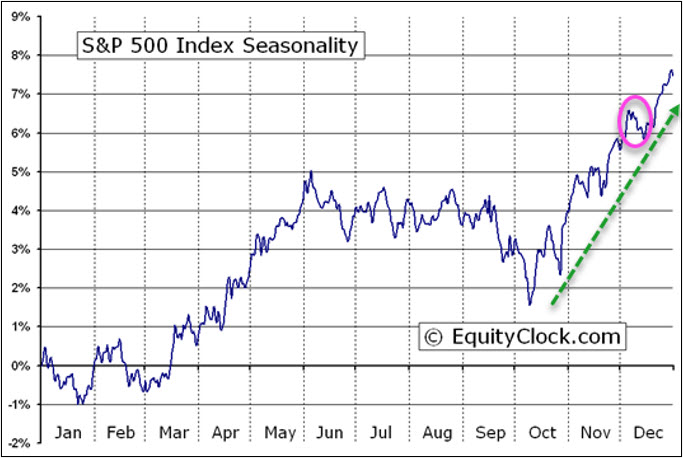
One contributing factor to this early December correction is investors engaging in tax-loss selling. This strategy involves selling underperforming investments to offset capital gains from those that have appreciated. It provides an opportunity to leverage investments expected to lag in performance, offsetting realized capital gains before the market rebounds. In Canada, according to the CRA, the last day for tax-loss selling in 2023 is December 27, while in the US, it is December 29, according to information from the IRS.
NOTE: It’s important to note that investors should consult with experts or review relevant tax documents for comprehensive answers, as the information provided here should not be considered tax advice.
Another significant reason for the correction in early December is the obligation of mutual funds to distribute capital gains, dividends, and interest income for the year. While these distributions commence in late November, a substantial number occur in the initial two weeks of December.
With the market potentially overbought (see RSI on bottom of chart) in the short term and volume declining, additional selling pressure from mutual fund distributions could momentarily impact prices. However, this does not signify the end of the bull market; rather, it suggests the necessity for a healthy reset to attract buyers back into the market. This suggests that if one has not participated in the current rally and is inclined to enter now, history suggests that a potential pullback would offer a more opportune moment to increase exposure in the markets.
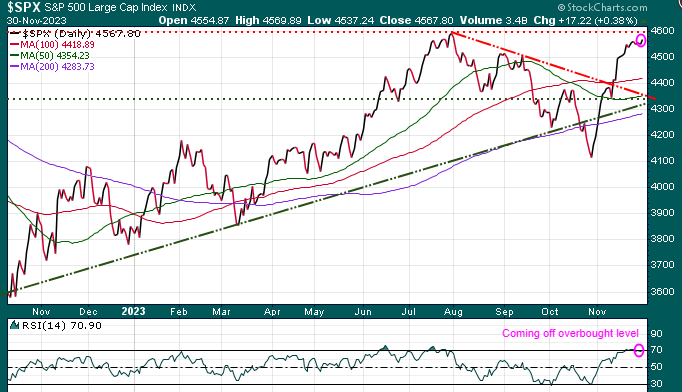
The near-term support level (red line) for a correction is anticipated to be around the 100-day moving average at 4418. Following a brief correction, the expectation is for the Santa Claus rally to drive the markets higher into year-end.
Stay tuned!