Markets Rallying Into Resistance
Market Summary – May 1, 2025
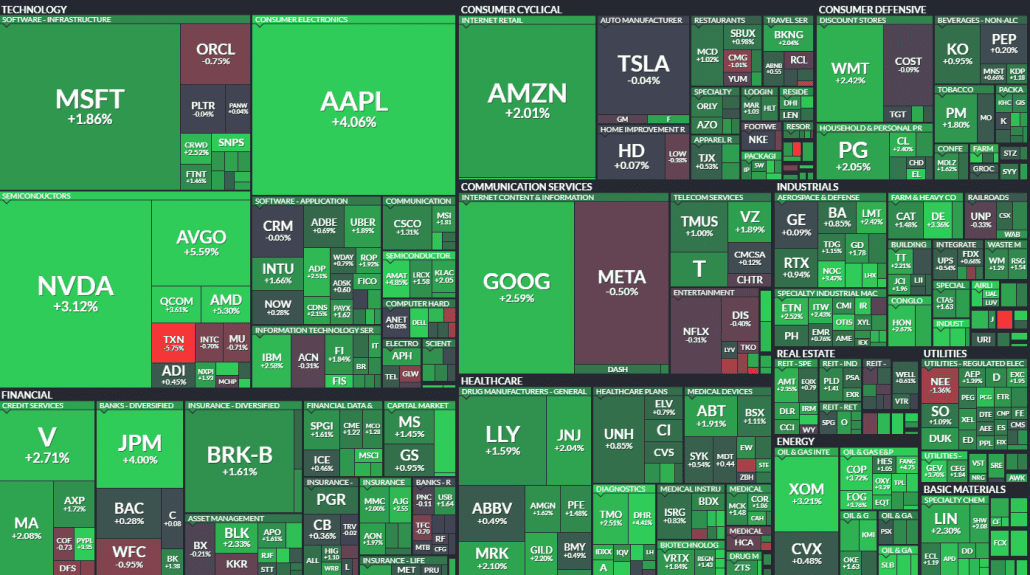
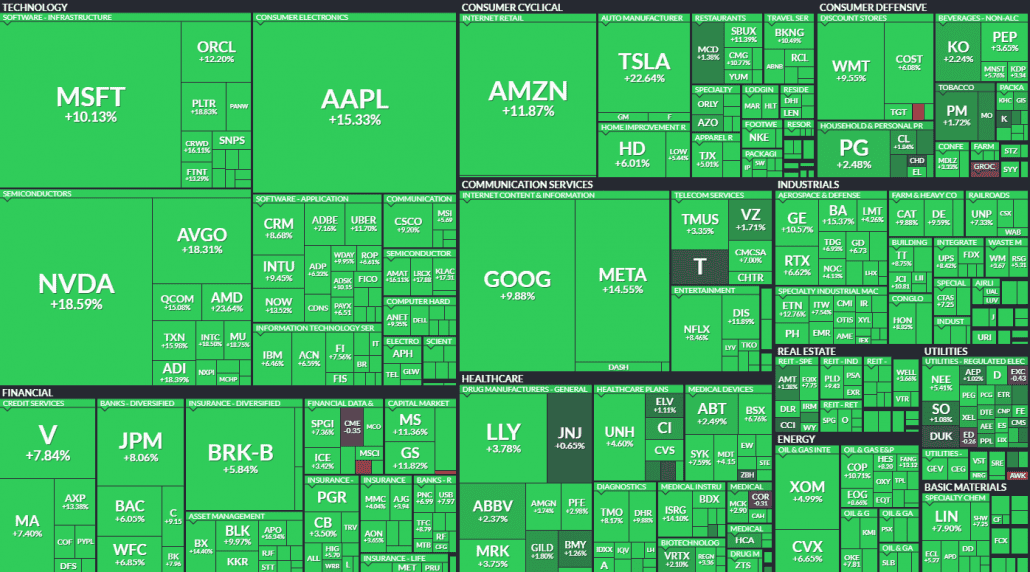
US stocks extended their rally Thursday:
- S&P 500 rose 0.6% to 5,604.14, marking its 8th straight gain.
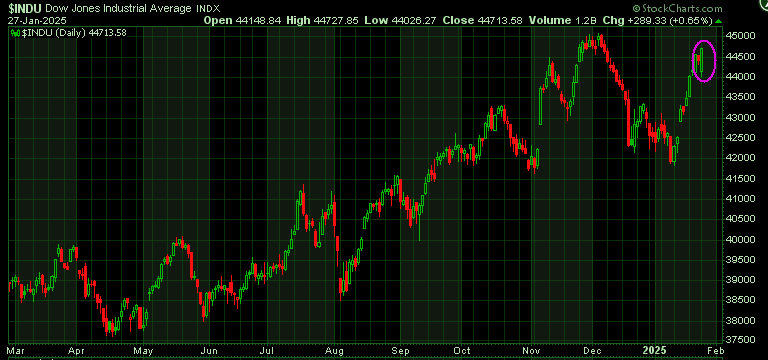
- Dow Jones added 0.2% to 40,752.96.
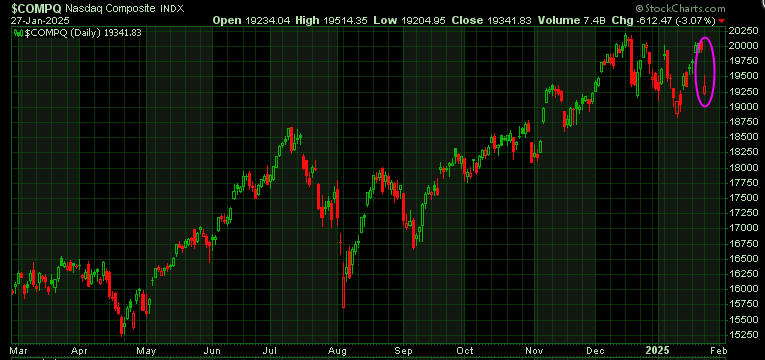
- Nasdaq surged 1.5% to 17,710.74, erasing April’s losses.
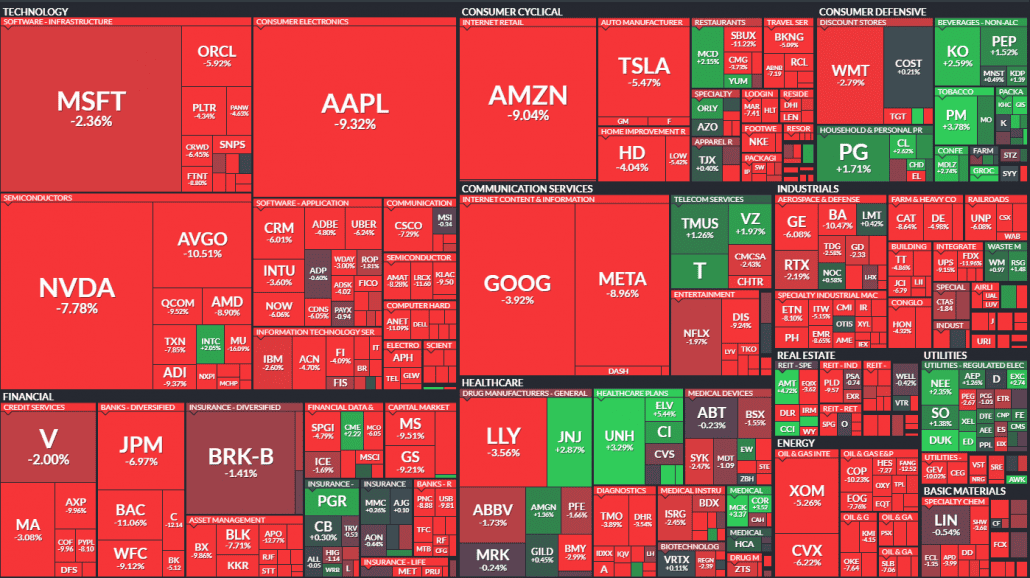
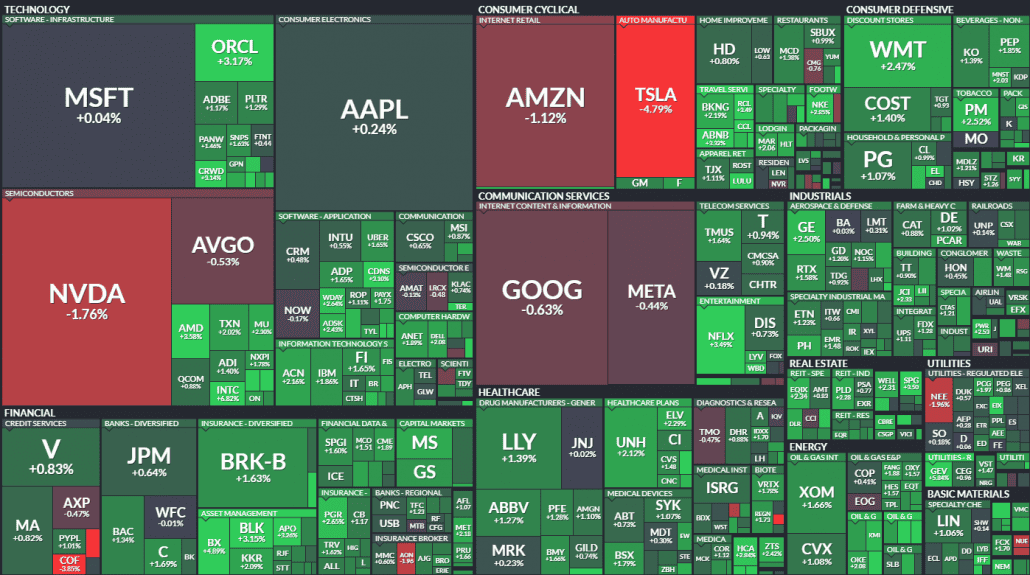
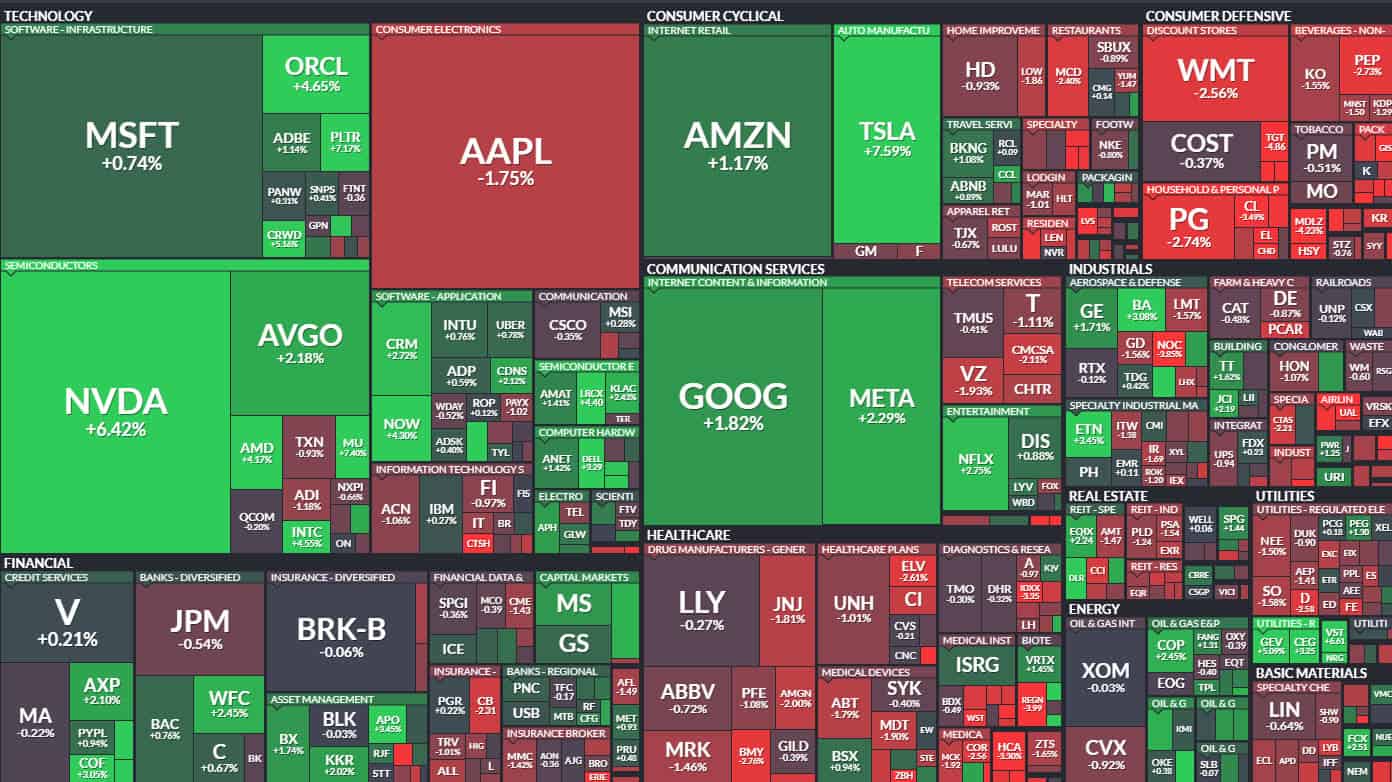
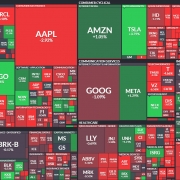
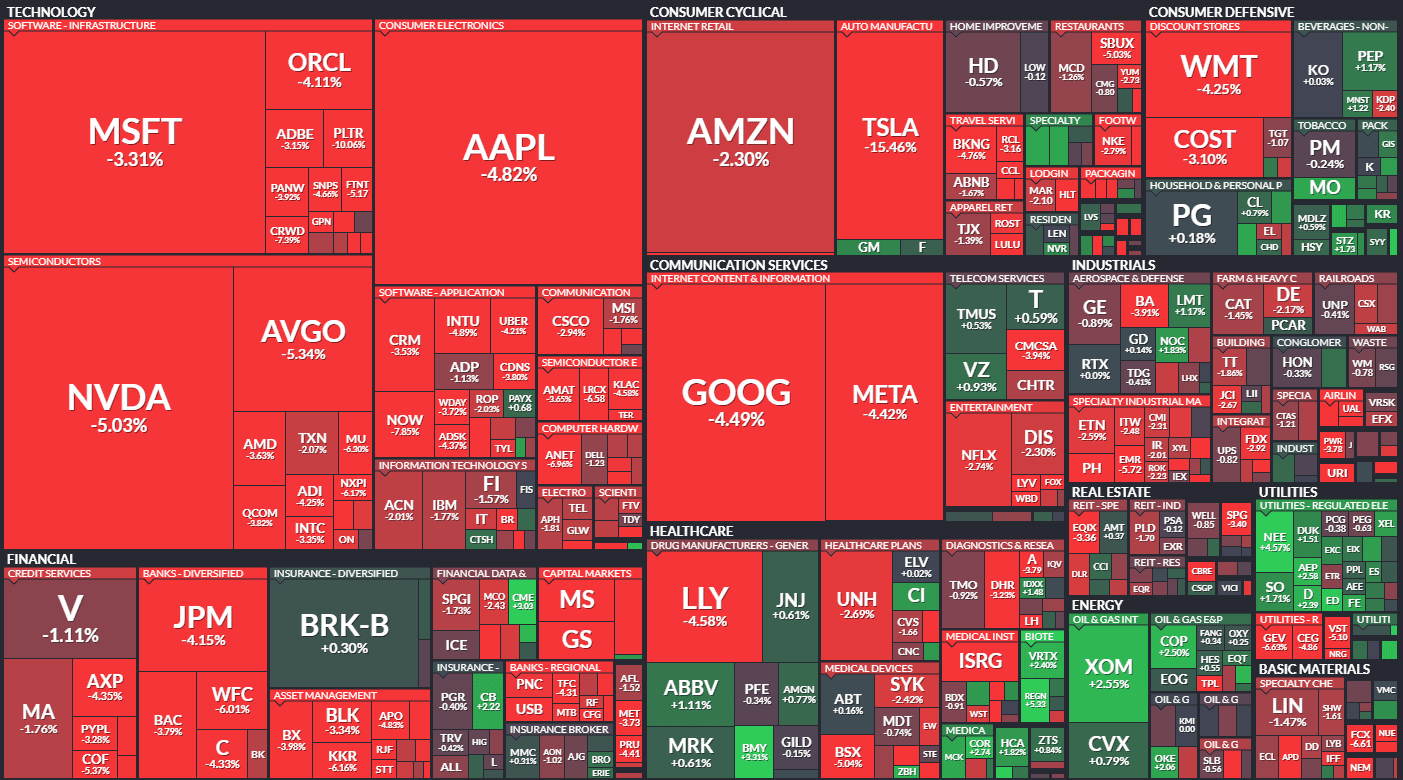
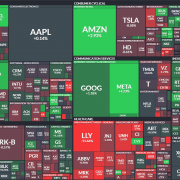
Microsoft jumped 9% after posting $70B in revenue, with strong AI-fueled cloud growth. Meta also beat expectations with a 16% YoY revenue gain and plans to ramp up AI capex.
Positive Big Tech earnings eased investor concerns about April’s market volatility sparked by Trump’s tariff threats.
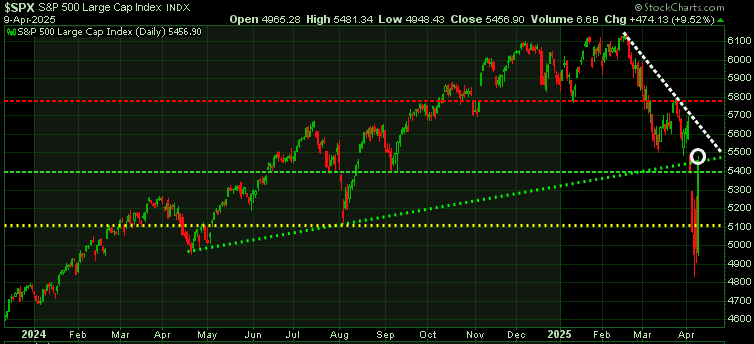
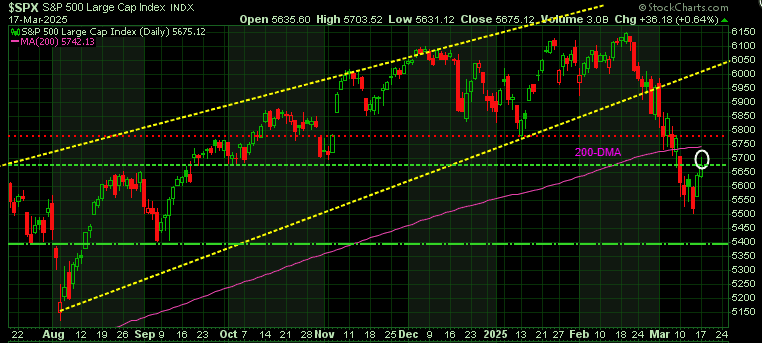
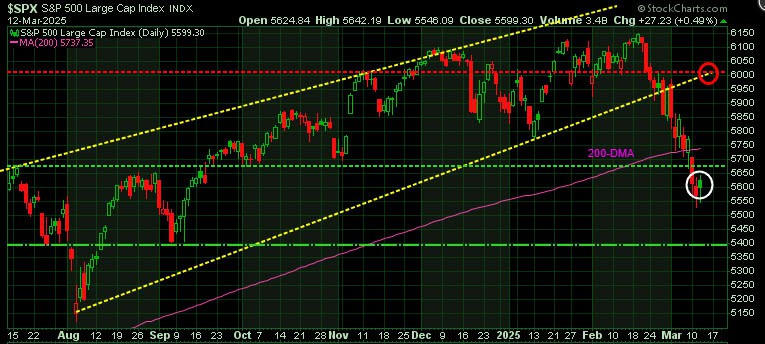
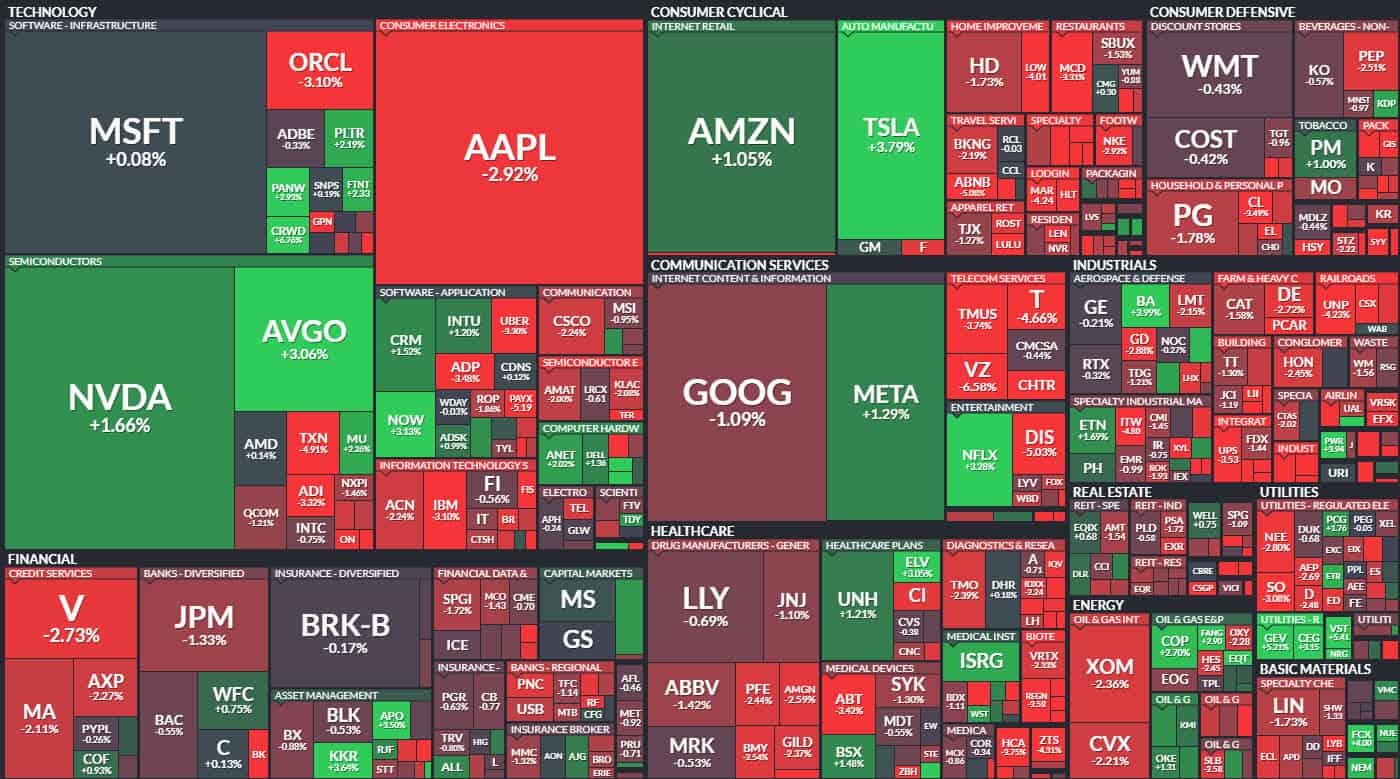
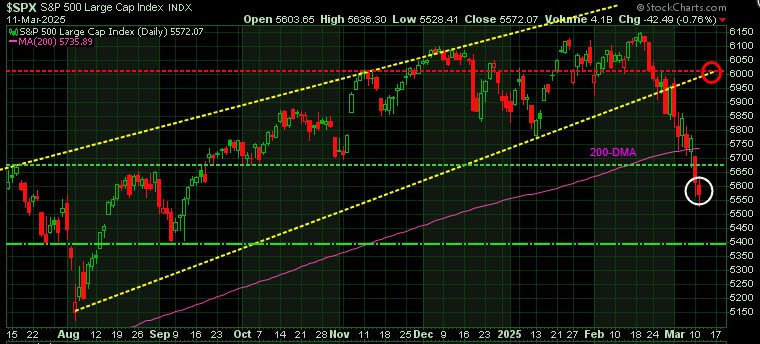
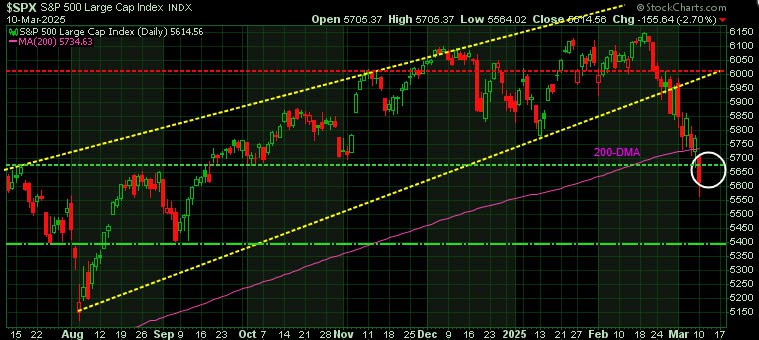
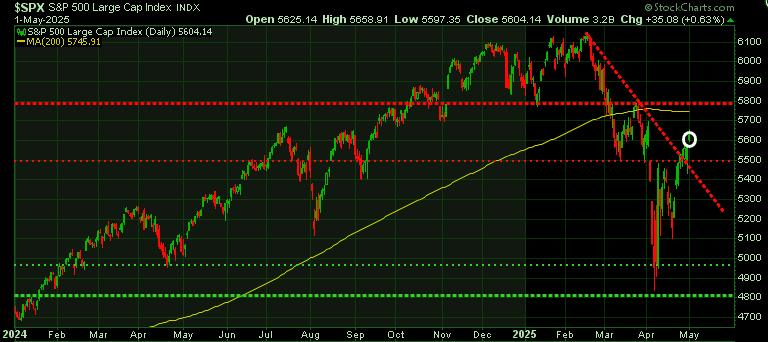
S&P 500 Analysis: Nearing Resistance
In our latest Trend Letter outlook, we flagged 5,500–5,700 as key near-term resistance, with 5,800 as a structural cap.
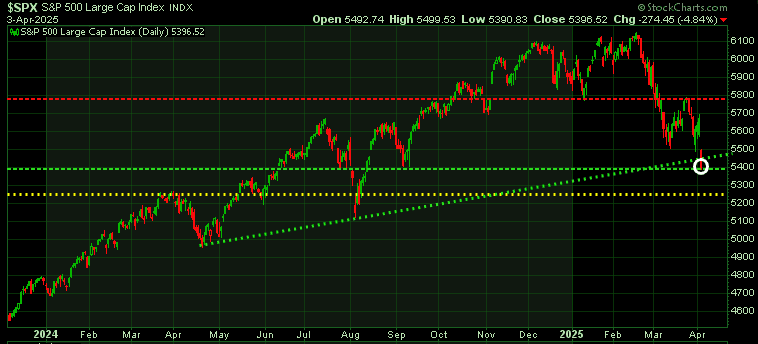
Recent Price Action
- Monday–Tuesday: Index reclaimed 5,500
- Thursday: Closed at 5,604 – just 96 points below 5,700
Key Resistance Levels
- 5,700–5,800:
- 5,700 = 50% Fib retracement + March swing low
- 5,746 = 200-day MA
- 5,800 = March high
Catalysts & Risks
- Bull Case: A breakthrough on tariffs could push the S&P beyond 5,800
- Bear Risks:
- Major resistance zone at 5,750–5,800
- Sticky inflation: Q1 core PCE rose to 3.5% (vs. 2.6% in Q4 2024)
- Tech valuations stretched – earnings must keep delivering
Be very cautious buying stocks in the 5,700–5,800 zone.
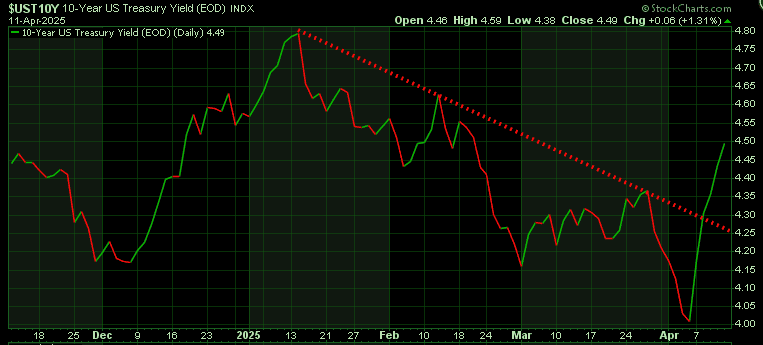
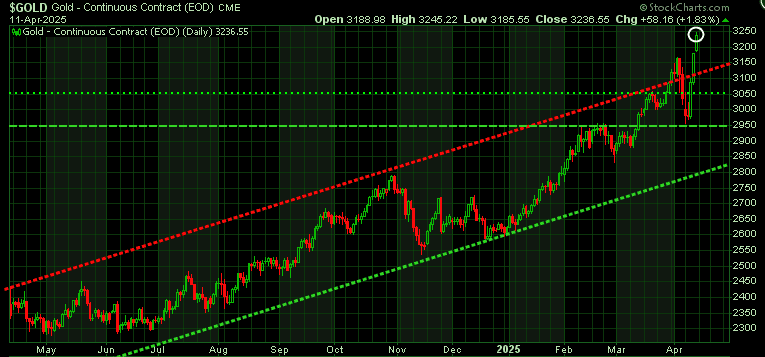
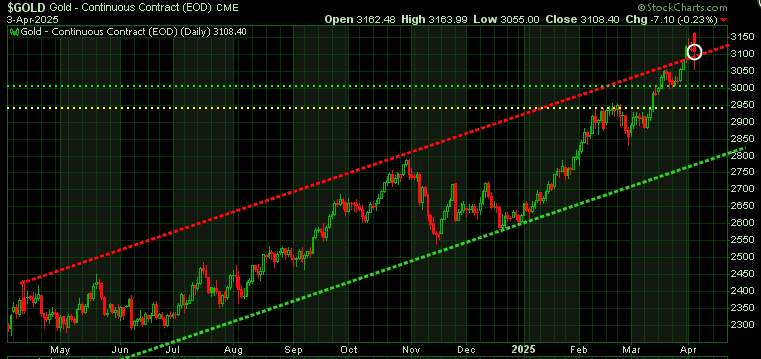
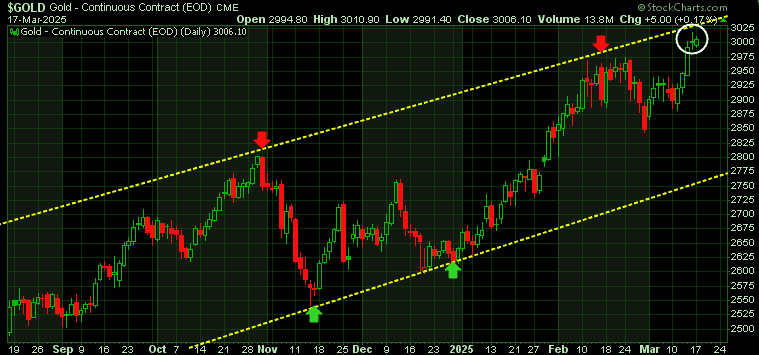
Gold: Pullback in Progress
Gold dropped to $3,233/oz, a two-week low.
Drivers of the Decline:
- Trade deal speculation reduced safe-haven demand
- Rising USD pressured global buyers
- Overbought conditions triggered profit-taking
As we warned in our April 21st update, gold is now hitting the top of two intersecting long-term channels—just like it did before its late-2022 low. This could mark a short-term top.
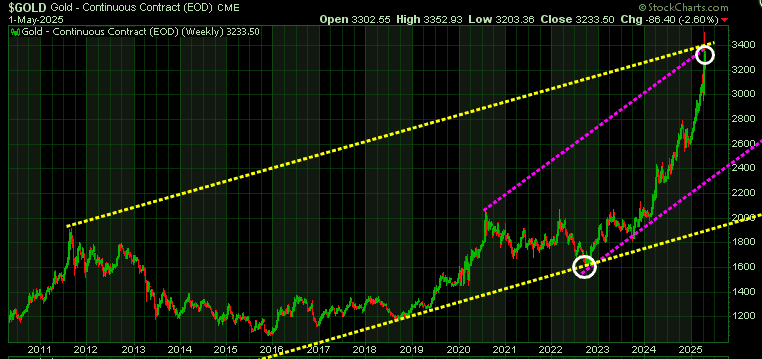
Support Levels to Watch:
- Initial: $3,200
• Deeper: $2,960 and $2,850
We believe a pullback here could set up a strong buying opportunity.

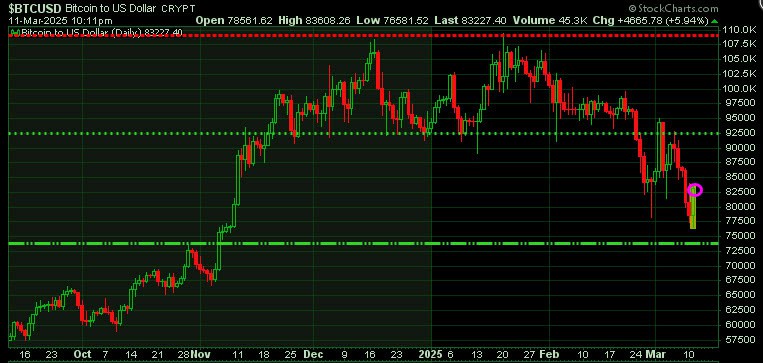
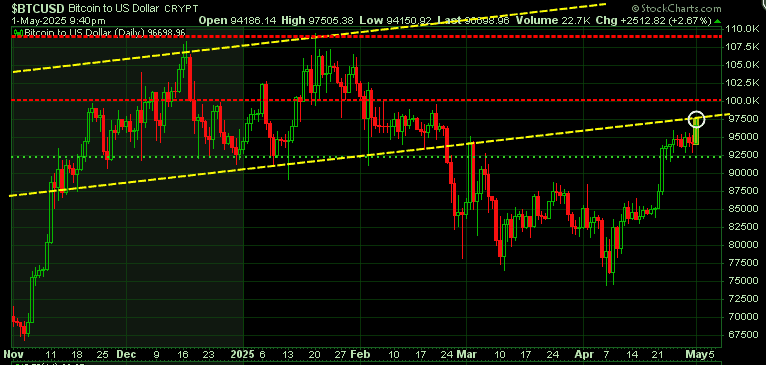
Bitcoin: Key Resistance Ahead
Bitcoin has rallied over 30% off its April low of ~$74K, now trading above $96K.
- Cleared resistance at $92.5K
- Next levels: $100K and all-time high at $108K
Momentum is strong, but BTC is nearing key psychological and technical resistance
Bitcoin has rebounded impressively from its April low of around $74,000, marking a 30% surge. It has now pushed through key resistance at $92.5K, which was a very strong previous support level. The next resistance level is $100K and then its all-time high at $108K.
The S&P 500 is nearing our projected near-term top. Are you ready for what’s next?
Our Trend Letter and Technical Trader teams have consistently helped investors navigate tops and bottoms — and now, with the S&P 500 approaching the 5700–5800 zone we forecasted, it’s time to prepare.
✅ Get ahead of the next move
✅ Learn how to hedge for downside risk
✅ See the exact strategies we’re using to protect gains and spot the next breakout opportunities
📉 Special Offer: $200-$250 Off Annual Subscription — Now Only $399.95
Don’t wait for the market to turn before you act.