Investing in stocks is a way to set aside money while you are busy with life and have that money work for you so that you can fully reap the rewards of your labor in the future. Legendary investor Warren Buffett defines investing as “the process of laying out money now in the expectation of receiving more money in the future.” The goal of investing is to put your money to work in one or more types of investment vehicles in the hopes of growing your money over time.

The key is that you don’t need to be an expert to invest like one. What you need is a good source that explains what is happening in the markets and then makes recommendations, telling you WHY you should invest in that stock or sector.

Since 2002 the Trend Letter has delivered average returns of over 40% per closed trade. We help people just like you understand what is happening in the markets and what sectors, and stocks make the most sense to invest in.

What Are the Risks of Investing?

Investing is a commitment of resources now toward a future financial goal. There are many levels of risk, with certain asset classes and investment products inherently much riskier than others. However, essentially all investing comes with at least some degree of risk: it is always possible that the value of your investment will not increase over time. For this reason, a key consideration for investors is how to manage their risk to achieve their financial goals, whether they are short- or long-term.

Key rule: Have an Exit Strategy

The first rule in being a successful investor is to not lose money. That might sound obvious, but the truth is most investors have no exit strategy for when they are wrong.  Basic human emotion is perhaps the greatest enemy of successful investing. But whether you’re a long-term investor or a day trader, a disciplined approach to trading is key to profits. You must have a trading plan with every trade. You must know exactly at what level you are a seller of your stock—on the upside and the down. Before we buy any stock or Exchange Traded Fund (ETF) we always set a SELL Stop in case the market moves against us.  When the stock starts rising, we raise our SELL Stop to ensure we lock in gains when we get a pull back.

The bottom line

Being a successful invest requires having the tools necessary that give you the best information to understand current and future market trends. At Trend News we offer three services for investors:

  1. Trend Letter is a weekly service that covers stocks, bonds, currencies, commodities, and precious metals. Trend letter has been publishing since 2002 and has an incredibly successful record over that 20+ year span.
  2. Trend Technical Trader (TTT) is an online service that was originally designed as a hedging service, allowing investors to protect their investment during down markets.  We have expanded TTT service to include trading long positions in precious metals, commodities, and other sectors as well.
  3. Trend Disruptors is our service for investors interested in investing in technical sectors. Disruptive technology propels us into the future at a rapid and increasing pace. Virtually no industry goes untouched, as the boundaries between the physical and virtual worlds are erased, transformed, or re-imagined. New technology can re-shape existing business around the world, and create entirely new business models never before thought of.

Whatever you  experience, we have a service that can help you become a very successful investor. It’s your money – take control.

Market Notes

Market Notes – March 13/23

US stocks finished Monday mixed as volatile trading gripped Wall Street after federal banking regulators took aggressive actions to stem the fallout of Silicon Valley Bank’s failure.

First Republic Bank led a decline in bank shares Monday that came even after regulators’ extraordinary actions Sunday evening to backstop all depositors in failed Silicon Valley Bank and Signature Bank and offer additional funding to other troubled institutions. First Republic is now down ~80% since February 2/23.

Many of the bank stocks were halted repeatedly for volatility throughout the day.

With fear of a banking crisis, bonds spiked as investors ran to safety.

With the collapse of these banks, the market is now changing its tune on Fed rate hikes.

The $US was down with expectations that the Fed will slow their rate hike efforts. We will see.

Gold spiked higher as a safe-haven play.

Oil continued its decline. Could be seeing a great buying opportunity soon.

US CPI data is out  tomorrow.

Stay tuned!

Market Notes

Market Charts – September 1/22

As noted to subscribers in Sunday’s issue of the Trend Letter, the the 50-DMA (blue wavy line) would be initial support for the S&P 500.  We also noted that if that level did not hold it would open the door to retest the July lows (bottom green dashed horizontal line). After falling through the 50-DMA on Wednesday, the S&P 500 became oversold, so a brief rally was expected, which we saw today.

Looking ahead,  if the market does not get back above the 50-DMA quickly, we can expect lower prices in the near-term.  Initial support sits at the 3900 level,  with that June low at 3665 being a critical support.  We continue to suggest using any relief rallies rallies to take profits and reduce risk. Using hedging strategies is a great way to protect your long positions.

Below is a chart that we have repeatedly shown to our subscribers to warn them to be very careful with bear market rallies.  In a bear market there will be multiple relief rallies, but these typically fail to make new highs, and instead retest the lows, often making even lower lows.  Below we see the Nasdaq from the high in March’00 to the low in Oct ’02. In that over 2.5 year period there were 8 rallies of over 16%, with some over 40%, yet the Nasdaq remained in a long-term bear market and ultimately lost over 78%!

Our Trend Technical Trader (TTT) service highlights many hedging strategies for subscribers to consider to protect themselves in a bear market.  These are very simple strategies to use, as simple as trading any stock online. Click here for more information.

Gold continued its disappointing movement, continuing to trade in the downtrend channel it has been in since the March high.  Gold is now testing its previous low near the 1700 level and could fall to the 1675 key support level before we see a turnaround.   We have been alerting our subscribers that gold could be setting up for a strong run here very soon. Note at the bottom of the chart that based on RSI, gold is close to being oversold.  We will send out BUY Alerts to subscribers if/when our model triggers the potential bottom.

Oil has continued to trade in a downtrend channel since the high in early June. Back then, we warned that oil prices, along with most commodities, could get hit as we head toward a global recession. When oil recently dropped to the 87.00 range we told subscribers that a rally to 95.00 was likely and even a run to 100 was possible. Oil did indeed rally to 95.00 but could not reach 100, stopping out at 97.00 last week. Ultimately, we are very bullish on oil and commodities in general for the long-term, but as we get closer to a recession, expect weakness in oil and most commodities as we head into the fall.

Stay tuned!

Market Notes

Market Notes – July 27/22

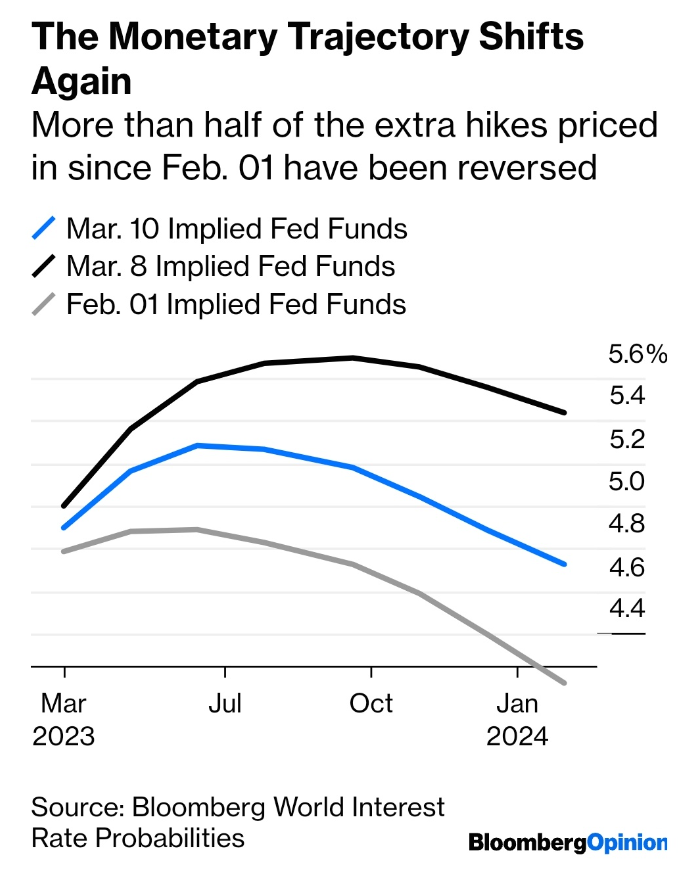
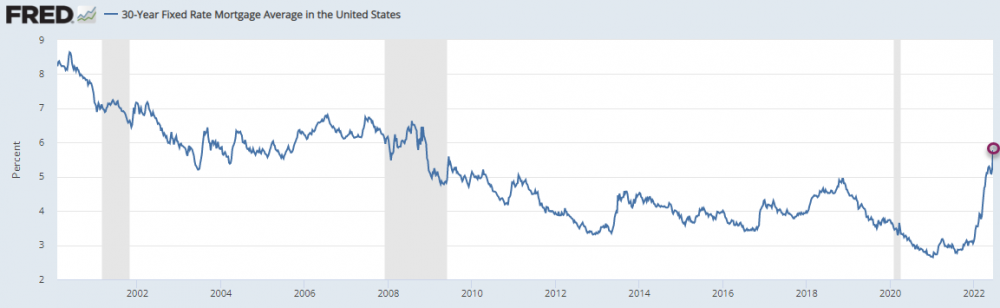
This afternoon the Federal Reserve announced its latest policy, raising interest rates by 0.75% for the second consecutive month. Afterward, Fed Chair Jerome Powell answered a number of questions from the press gallery.

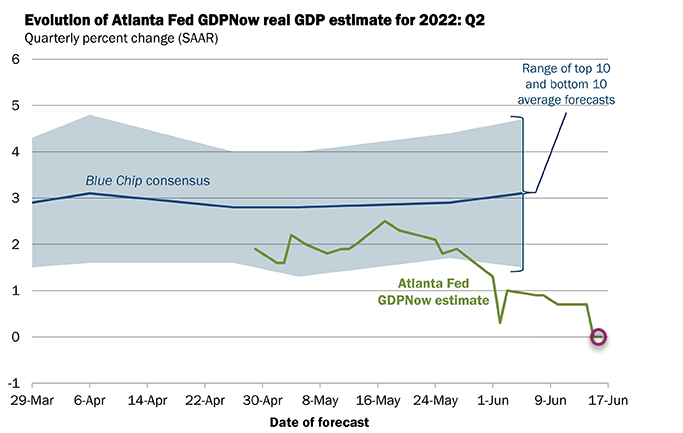
First, Powell was asked whether he agrees with the White House that ‘we won’t be in a recession.’ He then replied…

‘We think it’s necessary to have growth slow down. We need a period of growth below potential… We think it’s probably necessary if we’re going to get inflation down to a path to 2%… We’re going to be focused on getting inflation back down.’

At that point someone asked him ‘ ‘Why should we believe you when you said inflation was ‘transitory’?’

We thought that was a good question.

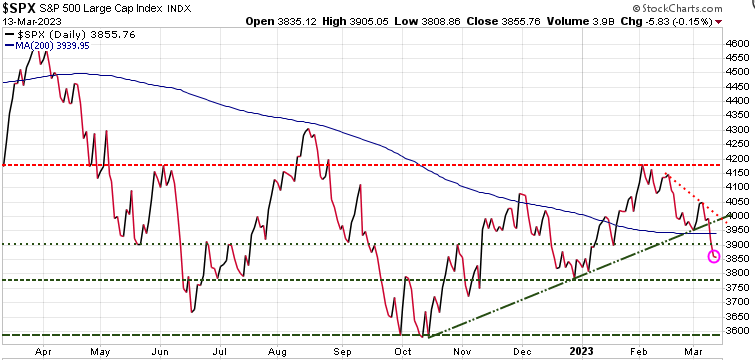
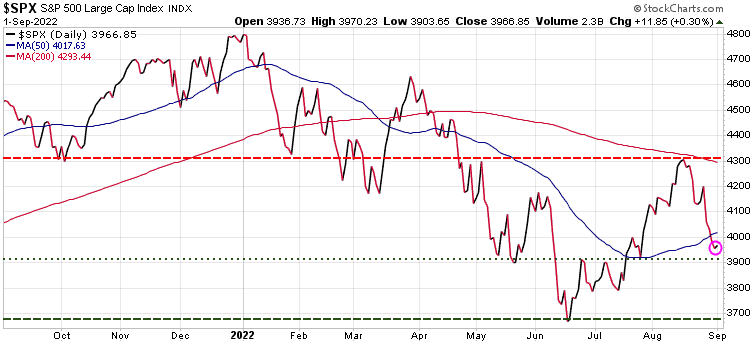
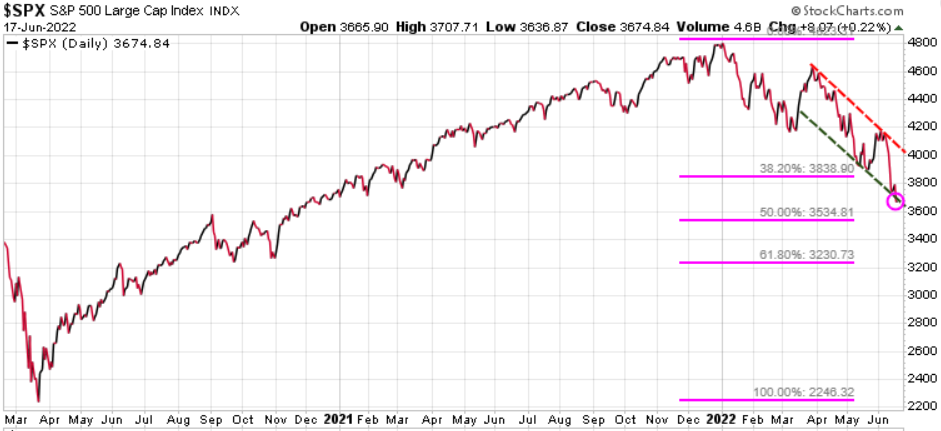
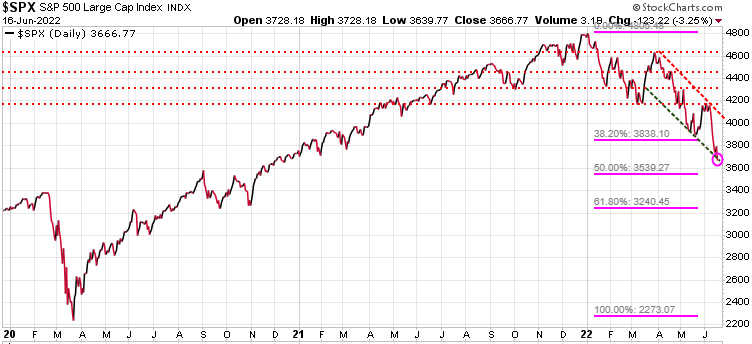
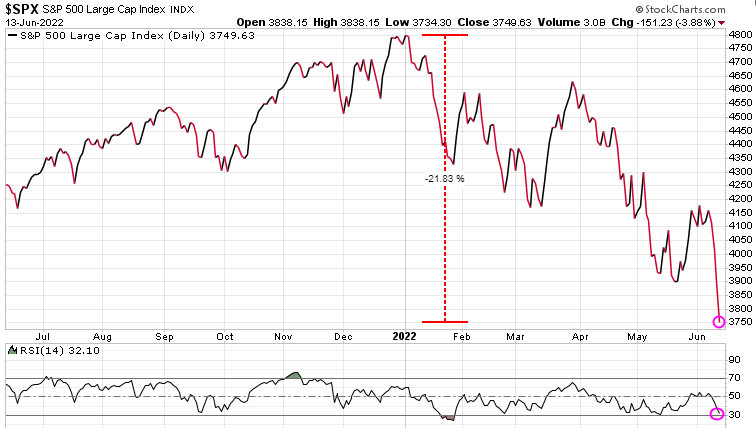
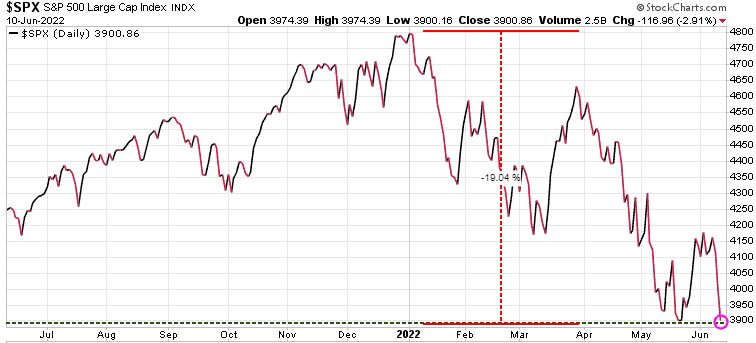
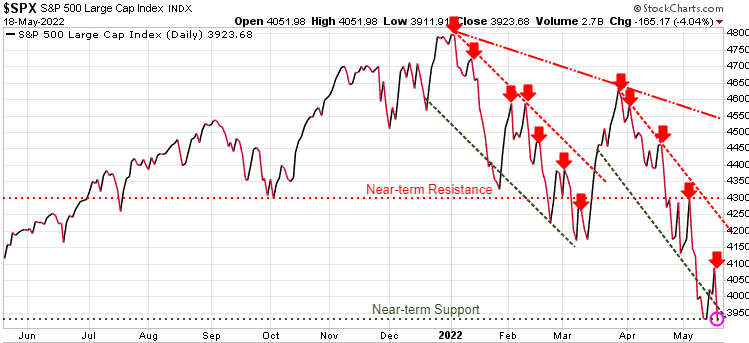
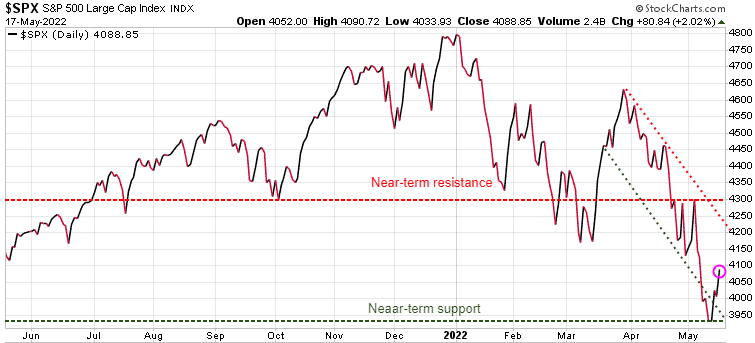
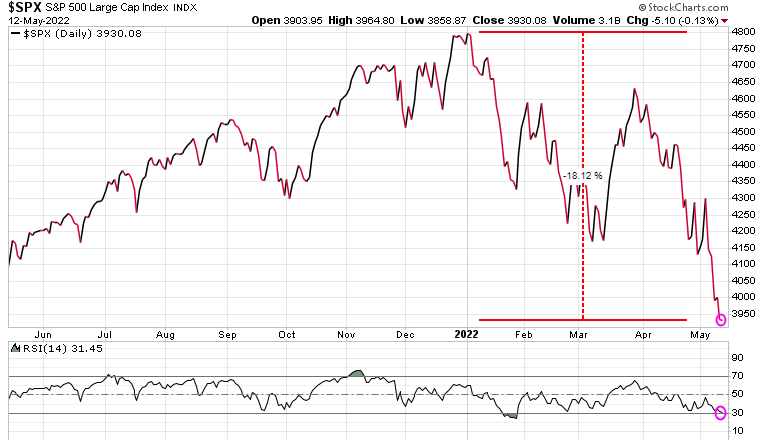
For some reason the markets  loved this rater announcement, with the S&P 500 closing the day up 102 points or 2.62%. There is serious resistance near the 4200 level.

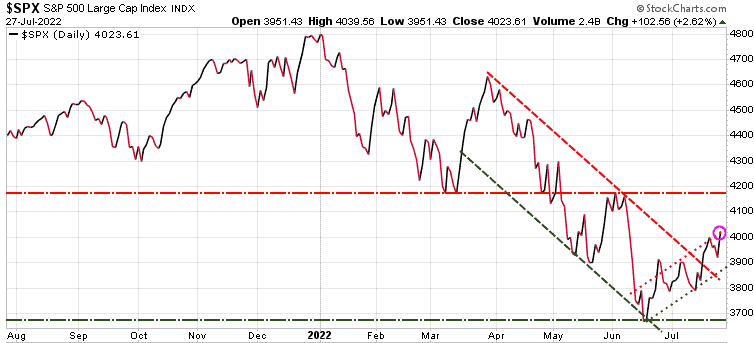
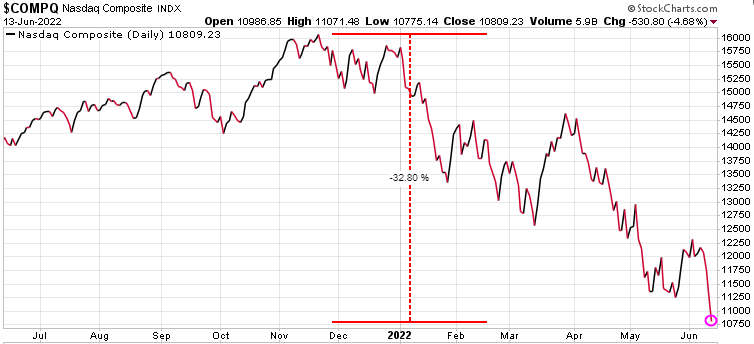
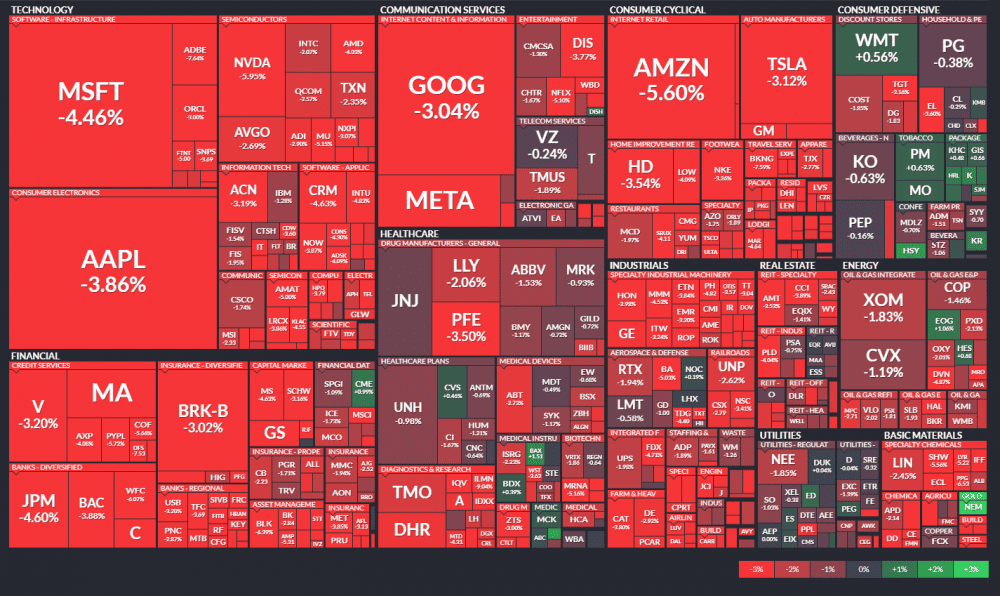
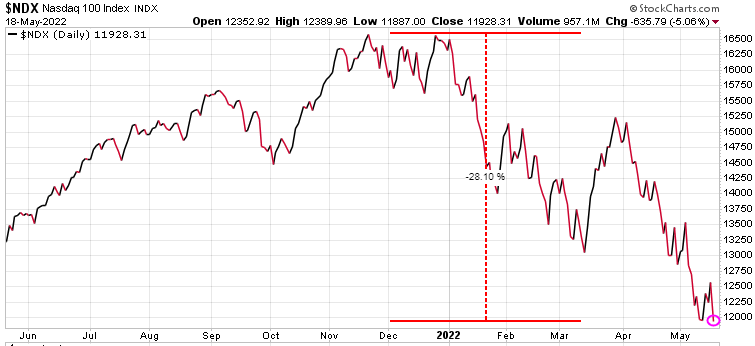
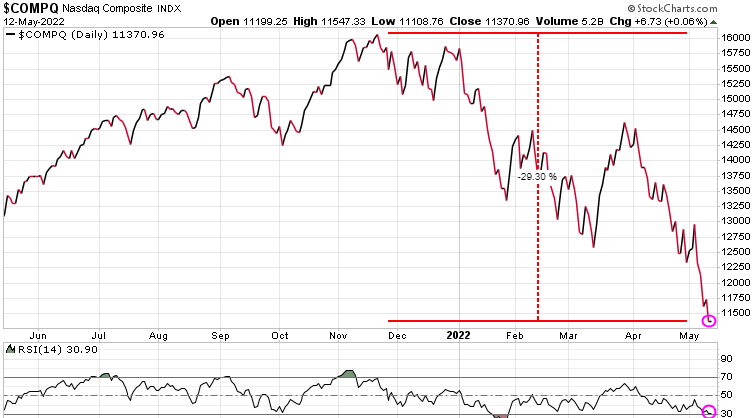
The tech heavy Nasdaq did even better, rising 4.06% for the day.

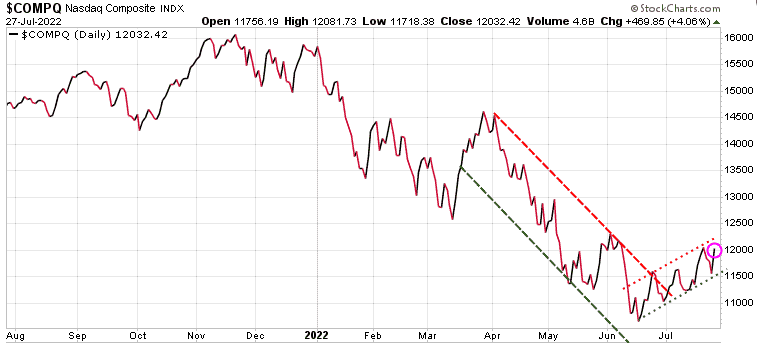
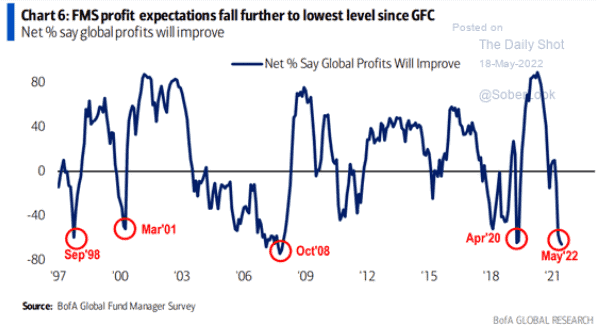
With such a positive move in the markets, many are asking if the bottom is now in. Our answer is ‘no.’

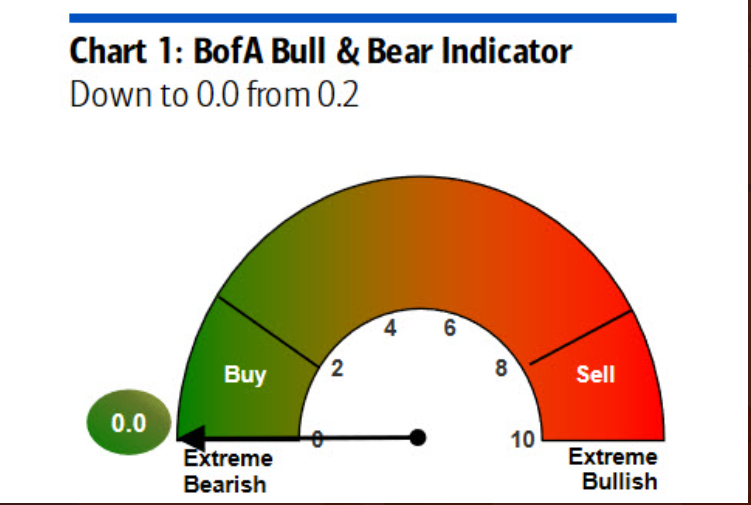
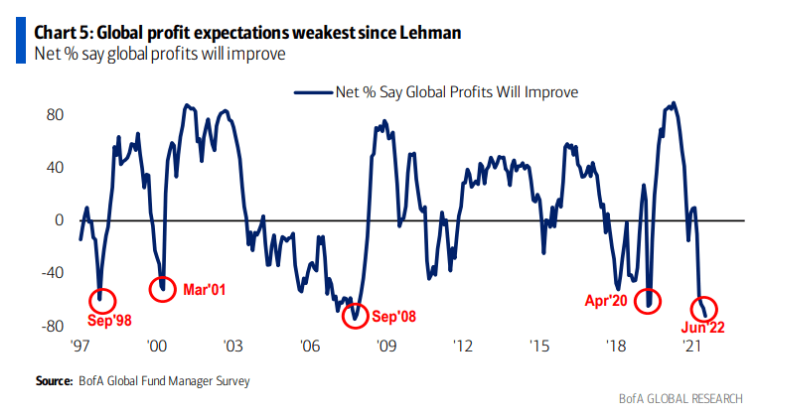
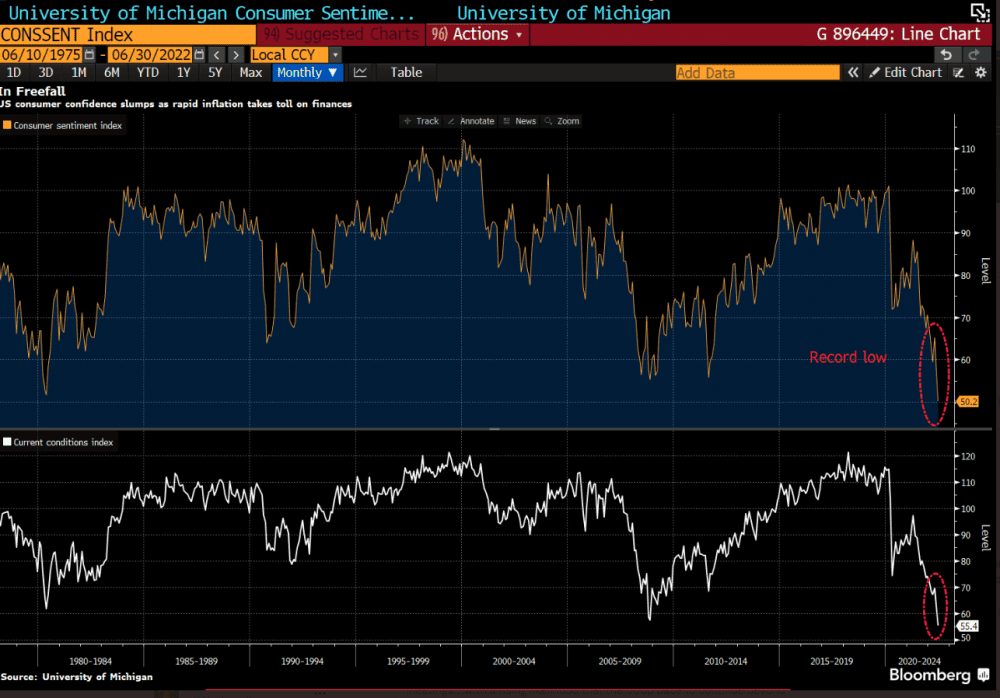
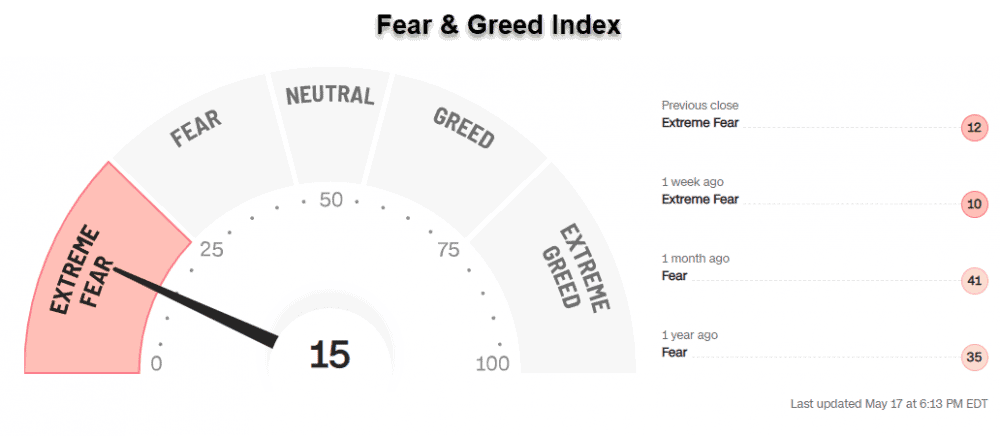
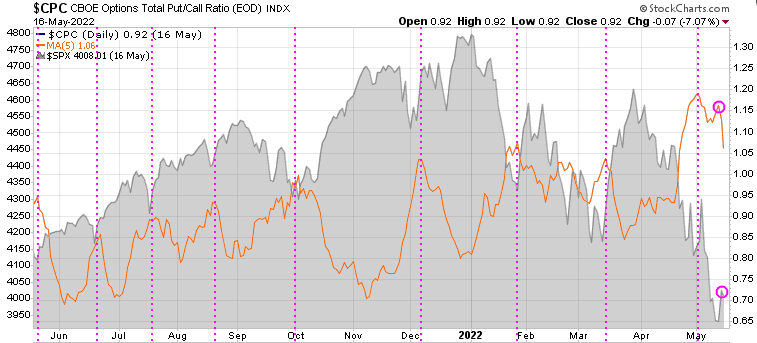
In our weekly issues of Trend Letter, we highlight to subscribers a number of key indicators our models follow and the bottom line is, that even though sentiment has been very bearish until recently, it has further to go before we get the final bottom.  We are still seeing far too much bullish commentary from the mainstream media calling every one of these bear market rallies the start of the next bull market.

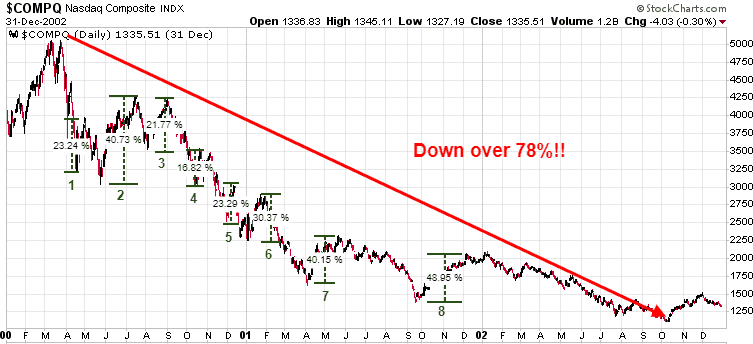
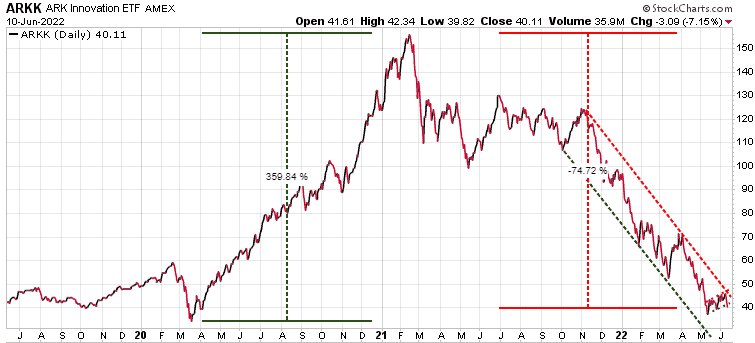
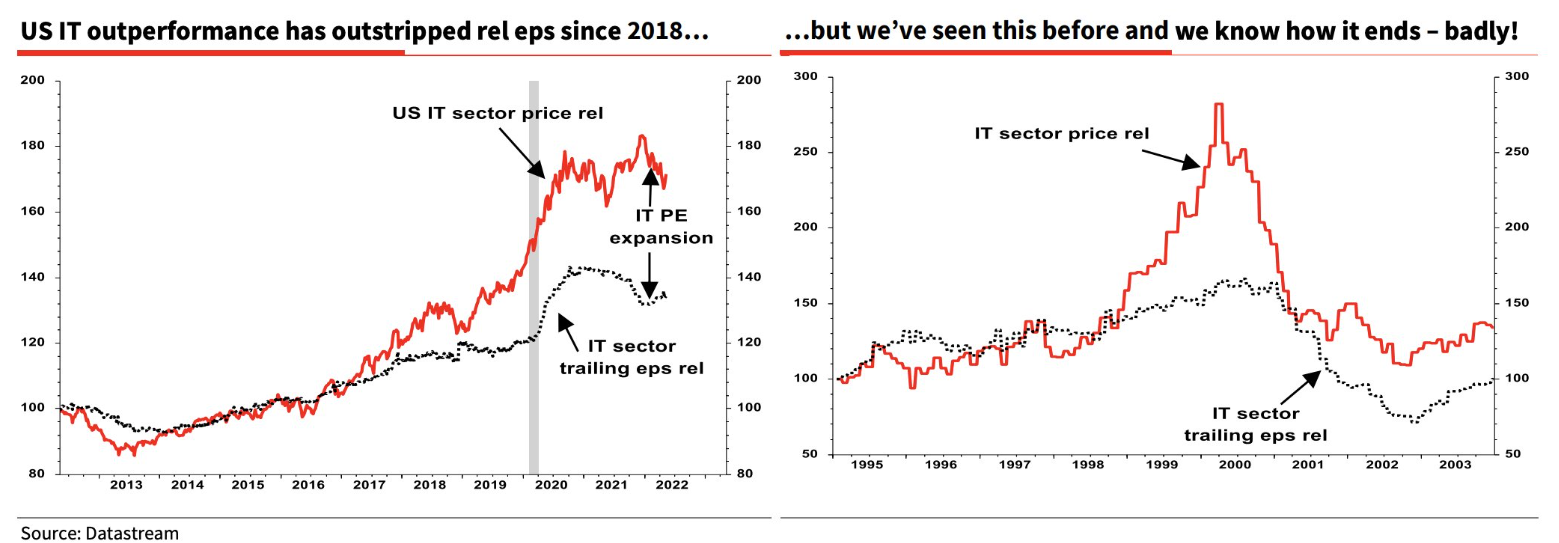
So many investors today have never experienced a true bear market; all they know is ‘buy the dip.’ Bear markets are different than simple corrections, they like to punish over enthusiastic investors.  We will know the bottom is in when no one wants to talk about the stock market. For those old enough, it will be like in 2000 and 2008, when the markets just kept going lower. Sure, there were bear market rallies, but every one of them was a bear trap, sucking in the ‘buy the dip’ players.

This bear market will end when investors are sick of hearing about the stock market.

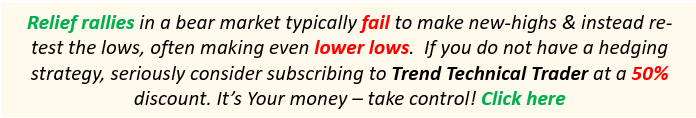
Now, this does not mean that we will not continue to see bear market ‘relief rallies’, and some of these can be very strong. Typically, they get stronger the closer we get to a bottom. But in almost every case, these ‘relief rallies’ fail to make new highs and instead typically see lower highs and lower lows.

Here is what our models are telling us:

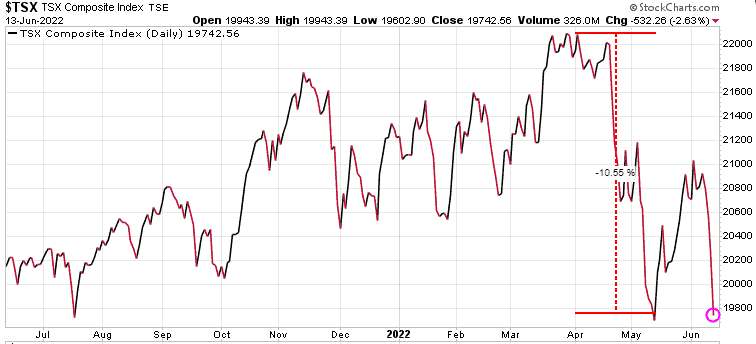
Stocks: rally into August, then head down into September

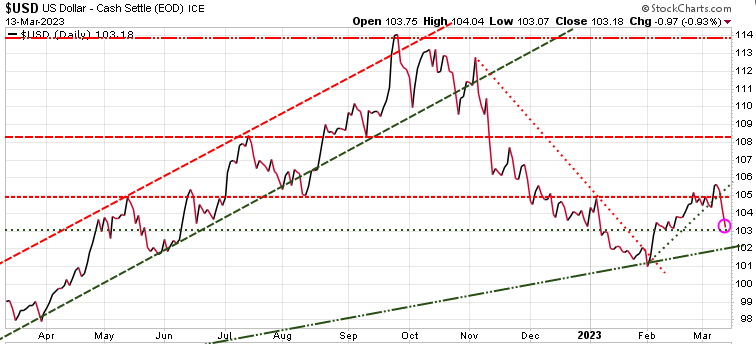
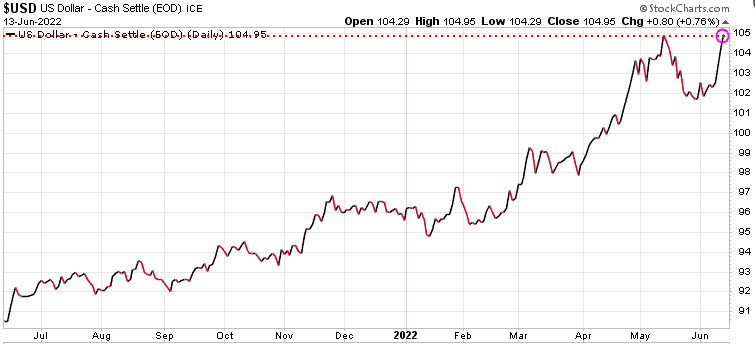
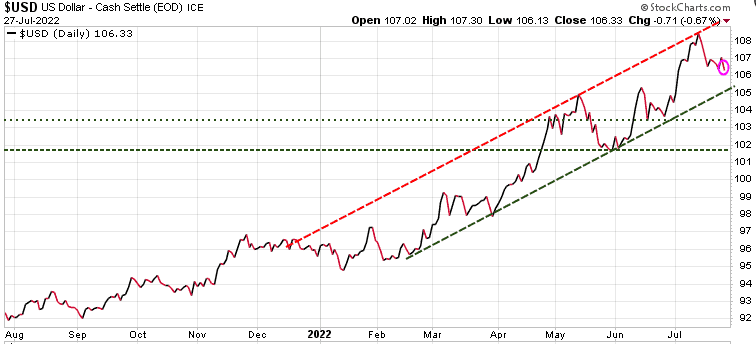
Currencies:  $US has had a huge run up and is now overbought. Look for a pullack over the next month and then move higher in September. This means most other currencies will trade sideways or higher over the next month, then head lower after August.

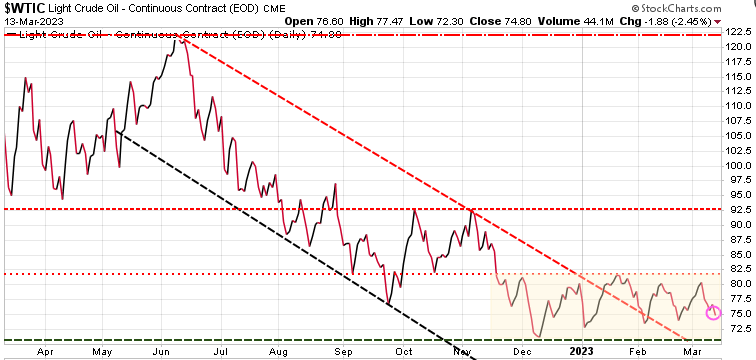
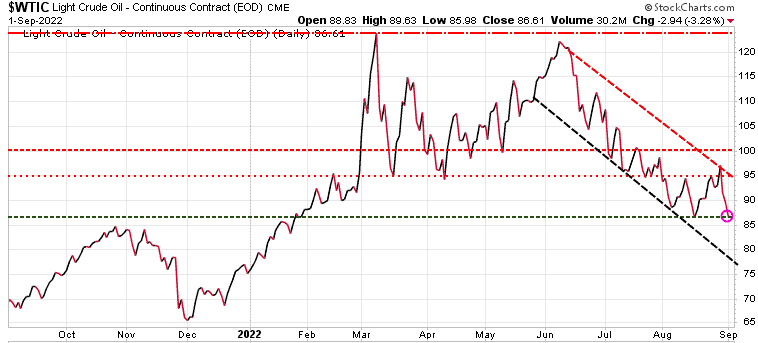
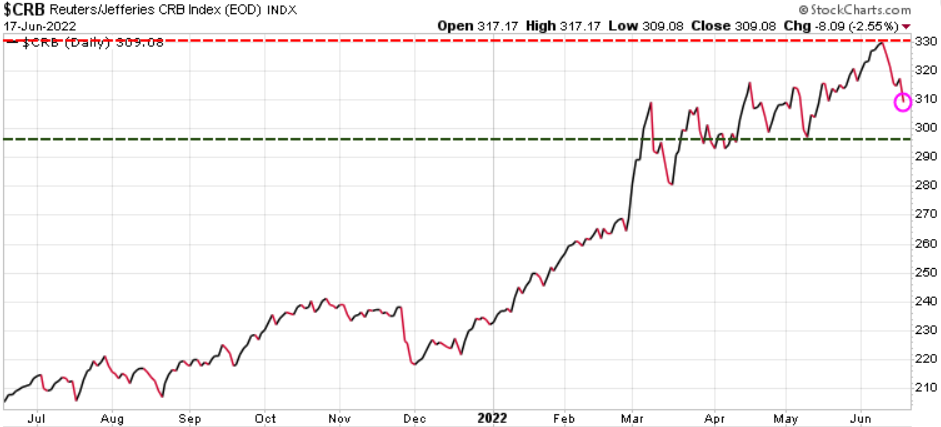
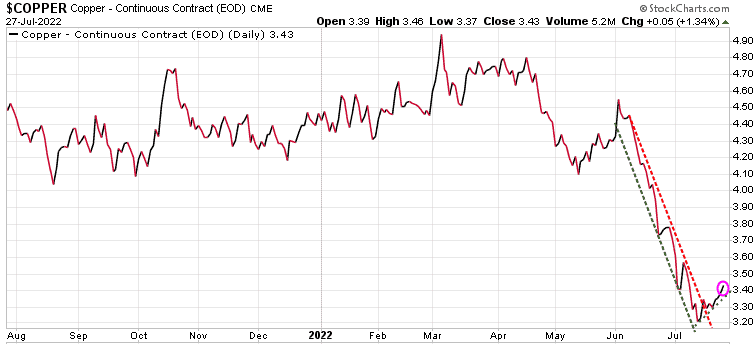
Commodities: Most commodities were red hot up until April on inflation, supply chain and war concerns. Then as they became overbought and recession fears have pushed prices down. We called for a rally in many commodities a few weeks ago and expect that could last through August, but after that, we will likely see another downturn in most commodities.

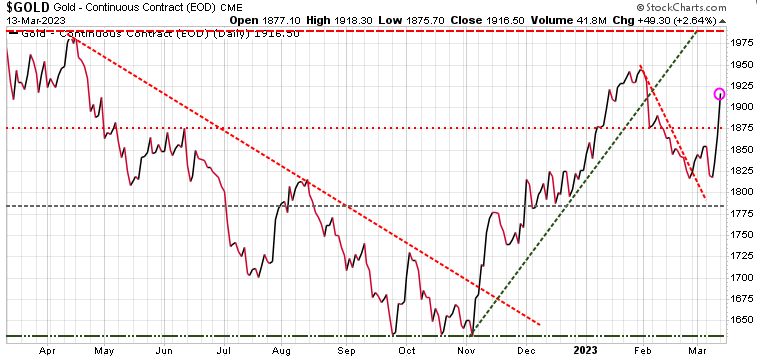
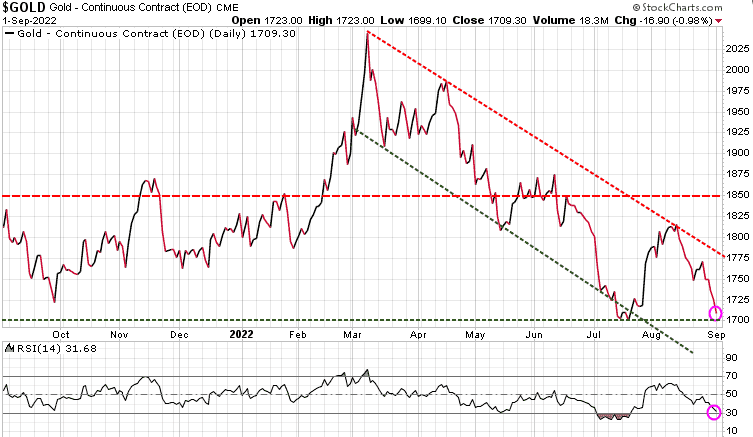
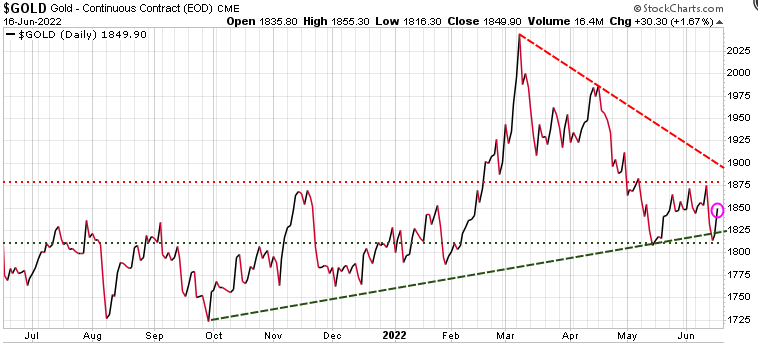
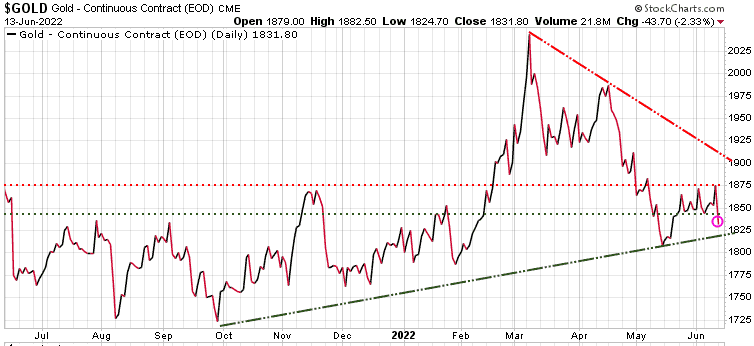
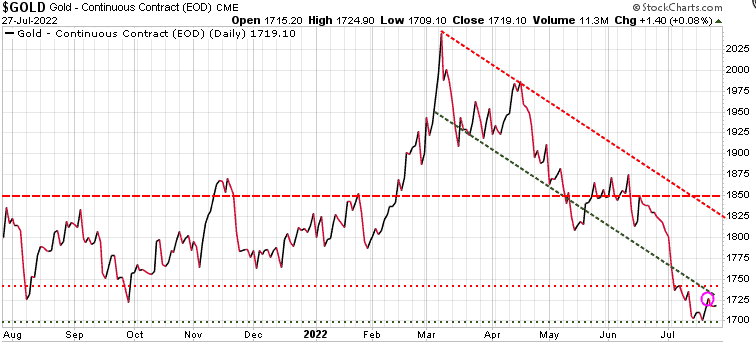
Gold: Gold and silver have been hit hard since the high in early March. We are getting a bit more optimistic that gold may be able to make a longer-term rally in the next few months.

Stay tuned!

Market Notes

Market Notes – June 17/22

For those wanting to jump in and ‘buy the dip’ be mindful of our constant warnings that ‘bear market rallies typically fail to make new highs, and instead often make new lows.’

According to Bank of America ‘The average peak to trough bear decline = 37.3%, average duration 289 days; history is no guide to future performance but if it were, today’s bear market would end on Oct 19, 2022 (35-year anniversary of Black Monday) with S&P 500 at 3000.

The S&P 500 has dropped through the 38% fibonacci retracement level at 3838 and is approaching the 50% retracement at 3534.

A few months ago we targeted mid-year as a potential top for commodities. We are seeing food, lumber, even gasoline and oil coming down this week. Could the top be in?

Here is the Reuter CRB Commodity Index and it has started to roll over. Watch the 296 level (green horizontal line), which was the May low; a break below that level would be bearish. Understand that long-term we are very bullish commodities, but if we are heading for a recession then commodities will be hit as well. Once the bottom is in, we will be sending out BUY signals to subscribers.

Michael Hartnett of Bank of America notes that Fed tightening ‘always breaks something’ with the US recession likely the last leg lower in this bear market. Looking at the their Bull & Bear indicator we can see that it has dropped right down to zero, which is quite extreme. This is a contrarian indicator suggesting one of those bear markets rallies should kick off next week.

Another sign a recession likely coming as manufacturing took a big hit last month.

And yet another negative piece of news. ‘Global profit expectations among money managers are tumbling, another sign that Wall Street is at a crisis point’, according to BofA Securities. In their June Fund Manager Survey of 800 panelists with $834B under management, a net 72% say corporate profits will worsen, the lowest reading since the collapse of Lehman Bros. in September 2008.

There is a term called the ‘wealth effect.’ It refers to how homeowners and investors feel when housing prices and the value of their stock portfolios go up in value; they feel wealthy and therefore are willing to spend more. Consumers account for ~70% of the GDP, so when they spend more, it is good for the economy. Of course the reverse is also true, when house prices and stocks fall in value, consumers spend less and the economy slows.

Various indicators continue to portray extreme bearishness, which in a bull market would be a solid BUY signal. But, this is not a bull market, so we need to show caution here. If you have not yet put on any hedge positions, use this next relief rally to do so. Trend Technical Trader (TTT) uses simple inverse ETFs for hedging and offers subscribers many options; there is something for every investor. Click here to subscribe to TTT at a 50% discount

Market Notes

Market Notes – June 16/22

The S&P 500 dropped 123 points or 3.25% and is now close to testng the 50% Fibonacci retracement level from the rally from Mar’20 to Jan’22.  Remember our warning all through this year… bear market rallies tend to be sucker rallies, usually failing to reach new highs, and instead make new lows. We are neutral right now, with our insurance trade offsetting our long play.

We do have a great list of stocks on our watch list, but we are NOT buying the dip here. We will let our subscribers know when our models trigger a BUY Signal. If you want receive those BUY Signals when they are triggered, subscribe now to the Trend Letter and receive 50% off the regular rate. Click here to take advantage of this  special offer.

Yesterday Fed chair Jerome Powell stated ‘Overall, spending is very strong, the consumer’s in really good shape financially — they’re spending. There’s no sign of a broader slowdown that I can see in the economy.’ That is quite an astonishing statement and we have no idea what data he is looking at. Every consumer sentiment chart we see shows consumers are anything but confident.

Even the Atlanta Fed, Powell’s own institution, is now forecasting Q2 GDP to come in precisely at 0.0%. That’s down from a 2% forecast in May and then a 1% forecast earlier this month. Given that the consumer accounts for~70% of the economy, how can he possibly say the consumer is in ‘really good shape financially’

Inflation was caused by excess government spending, a very dovish Fed, and high energy prices caused by the Ukraine war and extremely nearsighted energy policies.. The way the Fed seems to be planning to stop inflation is to drive the economy into a recession. And then once the recession takes hold, those laid off workers will not be able to afford things like gasoline or healthy food, so the prices will finally start to fall.

Gold had been oversold and had a nice bounce today. Still trading in 1800-1975 range.

Mortgage rates for the US 30-year jumped by the most since 1987 and are now at the highest level since 2008, which coincided with the real estate crash and a recession. Sound familiar?

Stay tuned!

Market Notes

Market Notes – June 13/22

The S&P 500 dropped back into a bear market within the first 30 minutes of trading today. The index is now down over 20% from its January high, marking the lowest level since March 2021. The Dow plummeted 2.79% while the Nasdaq fell 4.8%. Recession fears are growing amid crippling inflation and people are pulling out of their positions before the situation worsens.

For the last six months we have warned that in bear markets, relief rallies typical fail to make new highs and in fact tend to make new lows.  Our Trend Letter and especially our Trend Technical Trader (TTT) services have been using hedging strategies to protect our portfolios from these violent bear markets and even to profit from them.

Bear markets typically have three phases. The first stage is a sharp decline, followed by a rebound, and then a drawn-out fundamental downtrend. This is likely where we are now and we are likely to see some strong relief rallies, followed by deep corrections.

If you have yet to put any hedging strategies in place, we should be due for a rally very soon, which would be an opportunity to put in such a strategy.  If you need assistance on how to hedge, seriously think about subscribing to TTT at a 50% discount. Click here to subscribe.

The Nasdaq representing the tech stocks is now down over 32% since its high in November.

The S&P 500 is now officially in a bear market, having dropped over 21% since its high at the start of January.

The Canadian TSX has fared much better thanks to energy sector. The TSX is down ~10% and has not yet hit new lows.

Volatility spiked over 22% today.

The $US continues to be a safe-haven play in this bear market, testing recent high.

On Friday Gold jumped along with the $US as a safe-haven play. Today it fell off – very inconsistent and frustrating!

Stay tuned!


Market Notes

Market Notes – June 10/22

US stocks sank Friday as investors digested two downbeat prints on the US economy.

May data on inflation showed price increases unexpectedly accelerated last month, with consumer prices rising 8.6% year-over-year in May, the most since 1981. Consumer sentiment data released Friday morning came in at a record low, as inflation weighs on American households.

The S&P 500, Dow and Nasdaq dropped sharply following the print. The S&P 500 sank by 2.9% during the session, and by more than 5% since last Friday to post its worst weekly performance since January. The index ended just a hair above 3,900, or its lowest level in about three weeks. The Dow sank by 880 points, or 2.7%, and the Nasdaq Composite dropped 3.5% by the end of Friday’s session.

The S&P 500 is back to testng its previous low and if that level does not hold, we could see a significant decline.

Note that Trend Letter subscribers were given a new BUY recommendation on an insurance play this week. These insurance plays, or hedges are critical to protecting your wealth in a bear market. Our hedging service Trend Technical Trader (TTT) has a number of hedging options and subscribers can decide which one suits their specific trading strategy.  If you do not have a hedging strategy, seriously consider subscribing to TTT at a 50% discountClick here to subscribe to TTT

Consumer sentiment has dropped to a record low.

A sea of red.

Cathy Wood’s ARKK ETF was the darling of the Tech sector after the Covid crash, having soared ~360%. In this bear market since the high in Feb’21, it has given up ~75%.

Stay tuned!

Market Notes

Market Notes – May 18/22

In yesterday’s issue of Today’s Charts we warned that in bear markets there is a lot of volatility, with violent moves both up and down. Today we saw what a violent move down in stocks looks like. We also warned that most relief rallies in a bear market fail. It is another reminder to ensure you have a hedging strategy, especially in times like these.

How far does this market fall? Below is a chart we showed Trend Letter subscribers recently. A 38% fibonacci retracement of the bull market run from 2009 would drop the S&P 500 to 3233, for a decline of over 32% from the January high. A 50% fibonacci retracement would take the S&P 500 down to 2750, a decline of over 42% from  the January high.

Tech stocks continue to be the big losers in this market sell-off, with the Nasdaq 100 dropping over 5.1% today and is now down 28% since its all-time high in Nov’21.

The Canadian TSX is also struggling but the energy is reducing the pain somewhat. TSX is down 9% from its all-time high.

Based on the Bank of America’s Global Fund Manager Survey, fund managers haven’t been this gloomy about corporate profits since 2008.

Note that all three of our services have created target lists of excellent stocks that once we see the bottom of this bear market each service will be jumping in on those stocks. We are not there yet, but certainly getting closer to a bottom. We are offering the same great specials that we offered attendees of the World Outlook Financial Conference recently, where each service is 50% off and you can bundle two or all three services for even greater discounts.  If interested, click on the button below. It’s your money – take control!


Market Notes

Market Notes – May 17/22

As noted in Sunday’s issue of the Trend Letter, after the big sell-off, we are now seeing a relief rally. This could last for days, weeks or even a couple of months, but be very careful because if we do not see higher-highs and higher-lows, then we are most likely to see the market turn even lower. Bear markets tend to get very nasty with wild swings both up and down. While these relief or reflective rallies can be traded, in bear markets these rallies regularly fail.

Relief rallies

For the S&P 500, we need to see it push through its near-term resistance at 4300.

S&P500

One of the things that does suggest we get a rally here is that market sentiment has been very beamish, which tends to be a contrarian indicator.  Below is the CNN Fear & Greed Index and as we can see it is at an ‘Extreme Fear’ level.

Fear & Greed

The next chart is the put/call ratio (orange line) overlayed on the S&P 500. When this ratio is rising it tells us that investors are being more bearish, risk-averse. When the ratio is declining it means the investors are becoming more bullish, risk-on.  The vertical pink lines show how when we see peaks in the put/call ratio, it usually identifies short-term bottoms in the S&P 500, suggesting a relief rally has started.

Put/Call

Central bankers had been keeping interest rates low and have been major buyers of their domestic bonds.  Those loose monetary policies have fueled the bull run in the equity markets. But now the US Fed, Bank of Canada, and others are raising rates and are no longer buying their domestic bonds. In fact, the Fed will start to be SELLERS of these bonds.  The correlation of the bull market in stocks (green line) with the massive increase of the Fed’s balance sheet (red line) from buying all those bonds,  is very clear on this chart. Rising interest rates, a reduction in the balance sheet and a slowing economy, are serious headwinds for the equity markets.

Assets

Since the start of the year we have warned investors to have a hedging strategy for what we anticipated would be a very volatile year in 2022. The market action in these last 4 months is exactly the reason investors need a strategy to protect their wealth in volatile markets.  Our Trend Technical Trader (TTT) service was originally a hedging service and although it now recommends long positions as well, TTT is still a hedging service with many hedging strategies that are doing very well as the market crashes.

If you do not have a hedging strategy, seriously consider subscribing to TTT which offers numerous hedging options. Note also, TTT includes the Gold Technical Indicator (GTI).

To ensure all readers have access to this hedge service, we temporarily reduced the price by 50%. Click button below to subscribe. It’s your money – take control!


Market Notes

Market Notes – May 12/22

Stocks rebounded sharply in the final hour of trading, with the S&P 500 almost erasing a selloff that pushed it to the brink of a bear market earlier Thursday.

The turnaround came as Federal Reserve Bank of San Francisco President Mary Daly told Bloomberg News that a 75-basis-point increase in rates is “not a primary consideration,” while adding that the US is in a strong place and should be able to withstand monetary tightening. For a market that’s been haunted by fears that restrictive policy by major central banks will cause a recession, those comments offered a degree of comfort at the end of a session marked by wild volatility.


A small glimmer of hope as the S&P 500 was down 76 points at one point, but came back to close down just over 5 points.  The S&P is now down over 18% from the high to start the year. At the bottom of the chart  note that based on RSI the S&P 500 is getting close to being oversold, so at least a relief rally should be expected soon.  Loading up here would be like trying to catch a falling knife – be careful!

The tech heavy Nasdaq is now down almost 30% from its November and is also very close to being technically oversold.

Cryptocurrencies have been hit hard and Coinbase, the largest crypto exchange is getting hammered, down 55% in just the last 5 days, and down 85% since the November high.

Tech now experiencing something similar to what was seen in 2000. Back then Tech collapsed as recession flushed out cyclical stocks masquerading as growth stocks. Profit disappointments in Tech during ’01 recession brought sector to collapse. Look familiar?

US 30-year mortgage has now jumped to 5.30%, almost double the Dec’20 rate of 2.67%.

Since the start of the year we have warned investors to have a hedging strategy for what we anticipated would be a very volatile year in 2022. The market action in these last 4 months is exactly the reason investors need a strategy to protect their wealth in volatile markets.  Our Trend Technical Trader (TTT) service was originally a hedging service and although it now recommends long positions as well, TTT is still a hedging service with many hedging strategies that are doing very well as the market crashes.

If you do not have a hedging strategy, seriously consider subscribing to TTT which offers numerous hedging options. Note also, TTT includes the Gold Technical Indicator (GTI).

To ensure all readers have access to this hedge service, we temporarily reduced the price by 50%. Click button below to subscribe. It’s your money – take control!