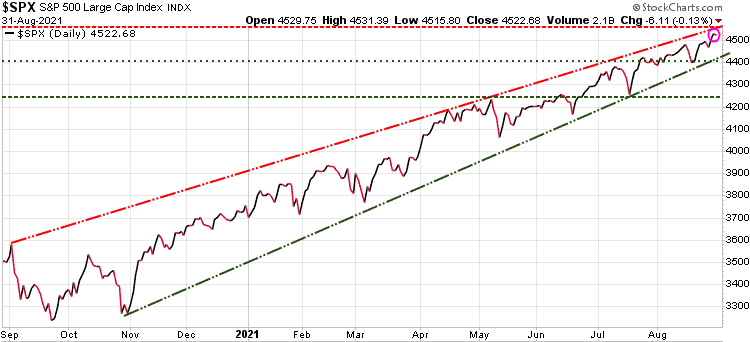
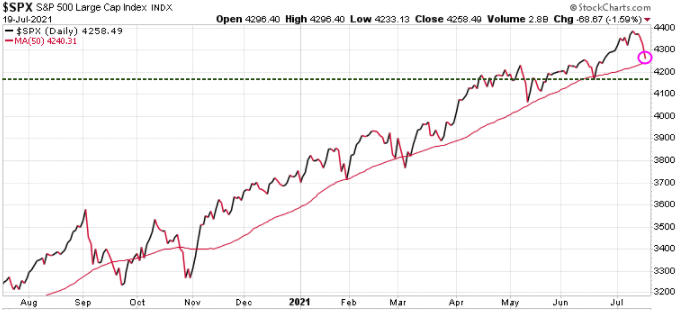
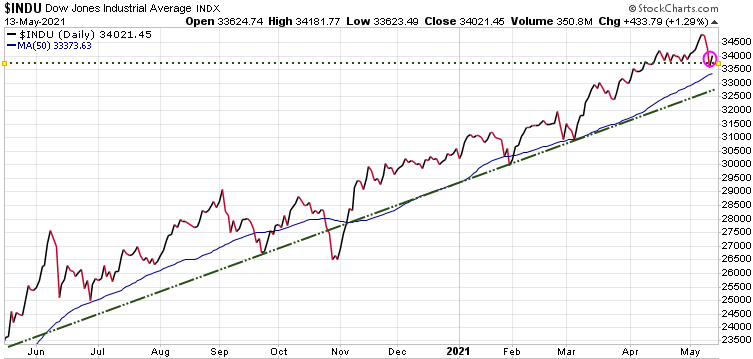
The S&P 500 index set another new record high today.

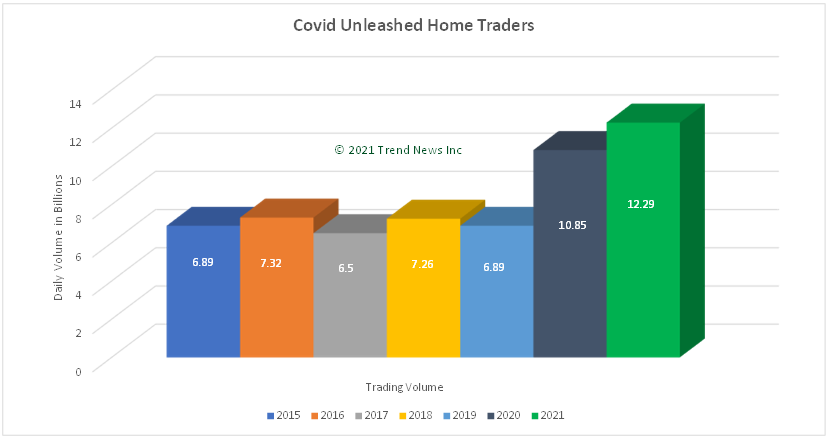
Trading volume has exploded since the pandemic lockdowns and government handouts, and the explosion on volumes is being driven by retail investors. Note the rise in 2020, and then already in 2021, with only half the year in the books, volume is on pace to be 126% higher than 2020.
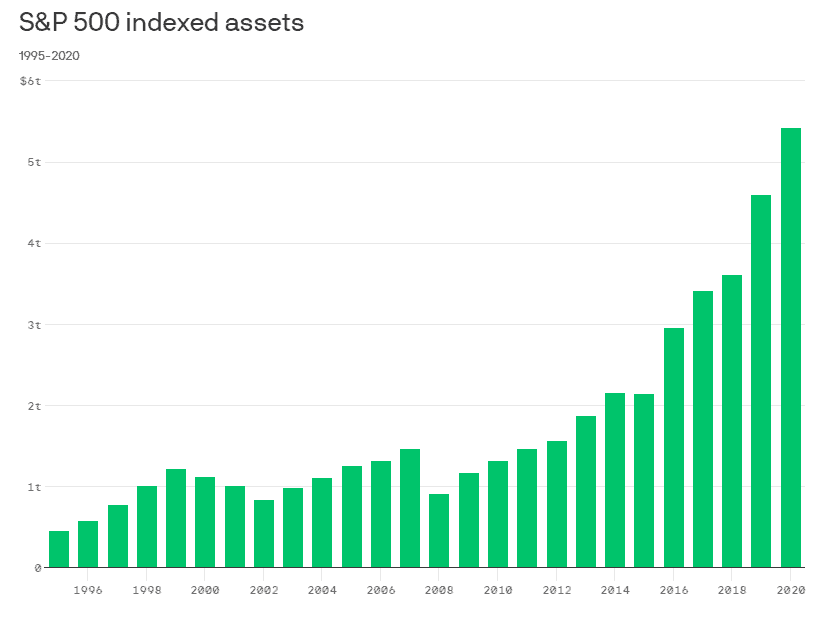
Clearly, not all investors are trying to beat the market. According to S&P Dow Jones Indices, at the end of 2008 during the financial crisis, there was just $915 billion worth of assets indexed to the S&P 500. As passive investing has become increasingly popular, assets indexed to the S&P nearly sextupled (+493%) to $5.4 trillion in 2020.
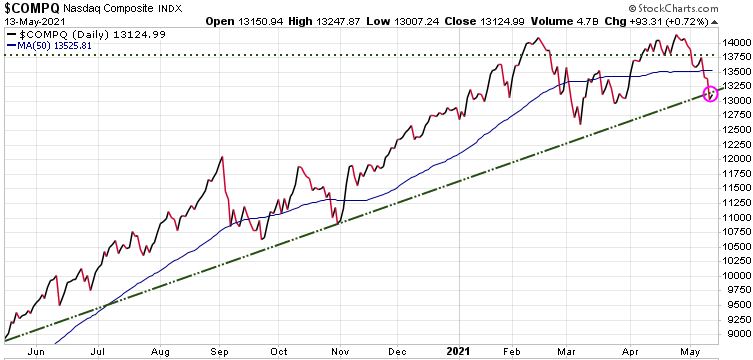
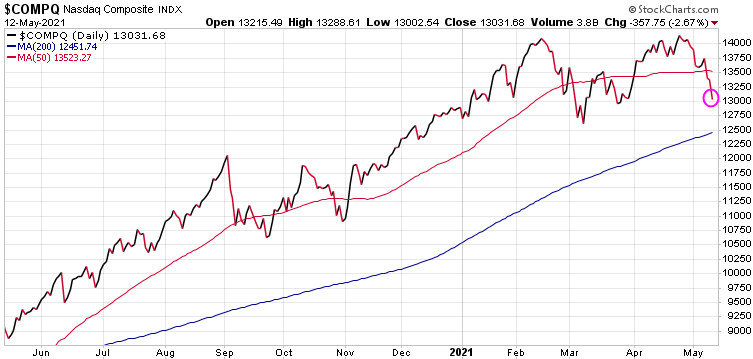
A warning signal? While the S&P 500 keeps making new highs, the number of individual stocks hitting new highs each day has been decreasing recently. The following chart shows that only 48.7% of S&P 500 stocks are trading above their 50-day moving average, down from the record high of 93% in mid April. So while the S&P 500 (gray shaded area) sets new records, less than half of the stock in that index are following that trend.
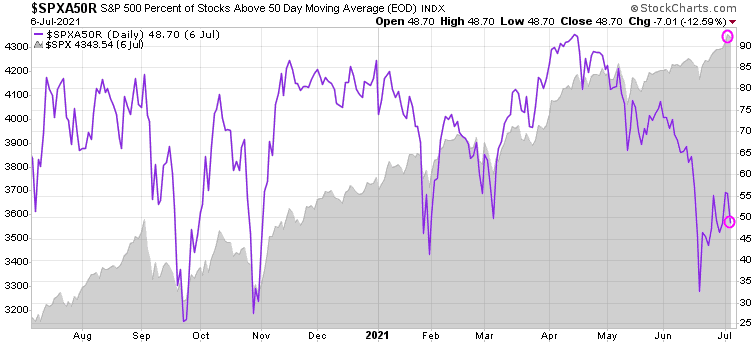
When we get this combination, it’s tends to suggest that we are closer to a top than a bottom, and that some form of sell-off is likely in the near future.
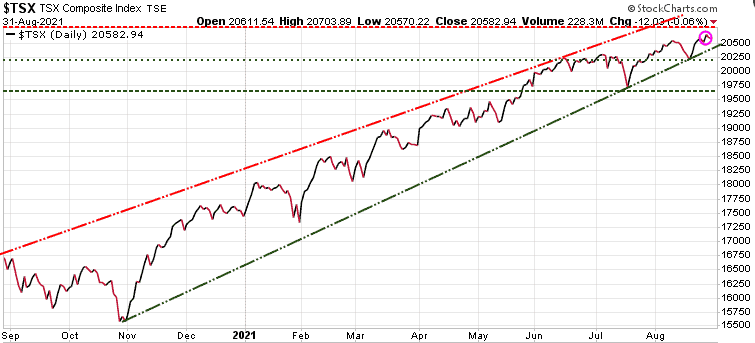
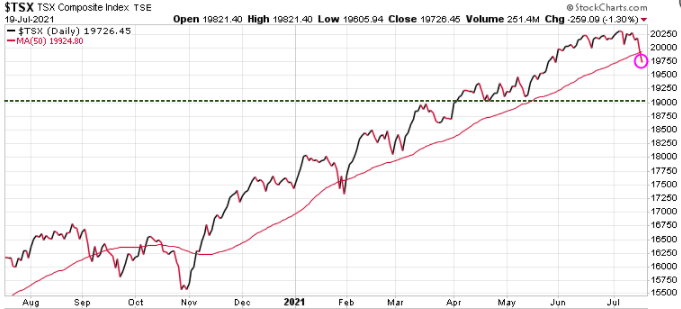
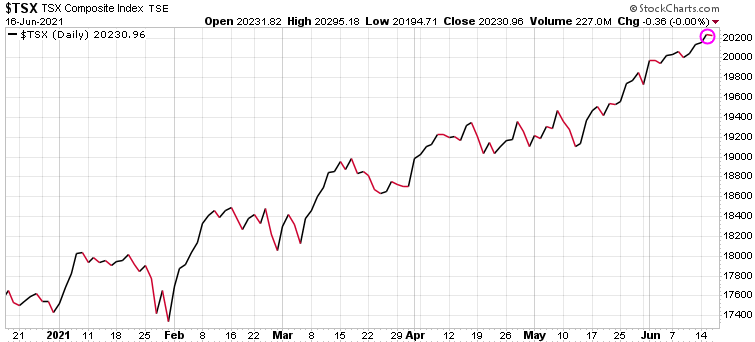
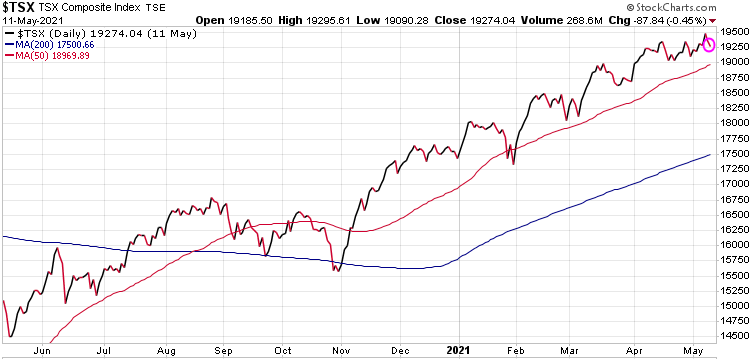
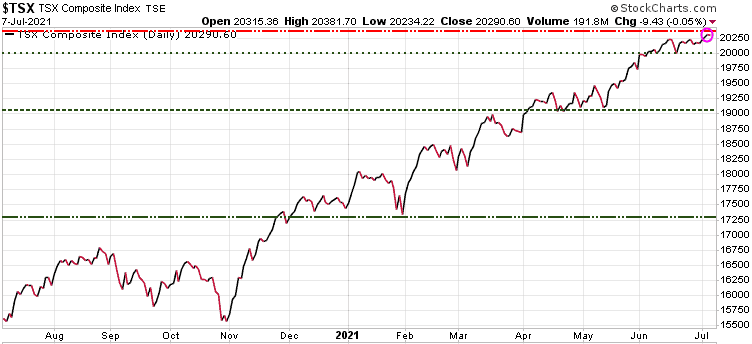
The Canadian TSX hit a new high yesterday, just down slightly today.
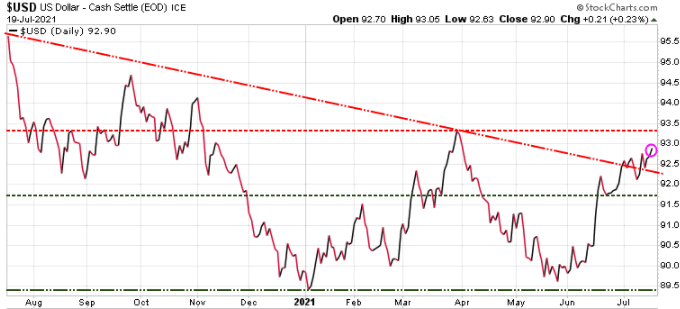
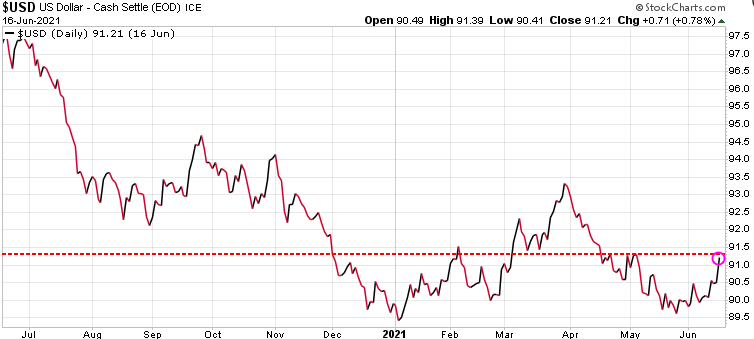
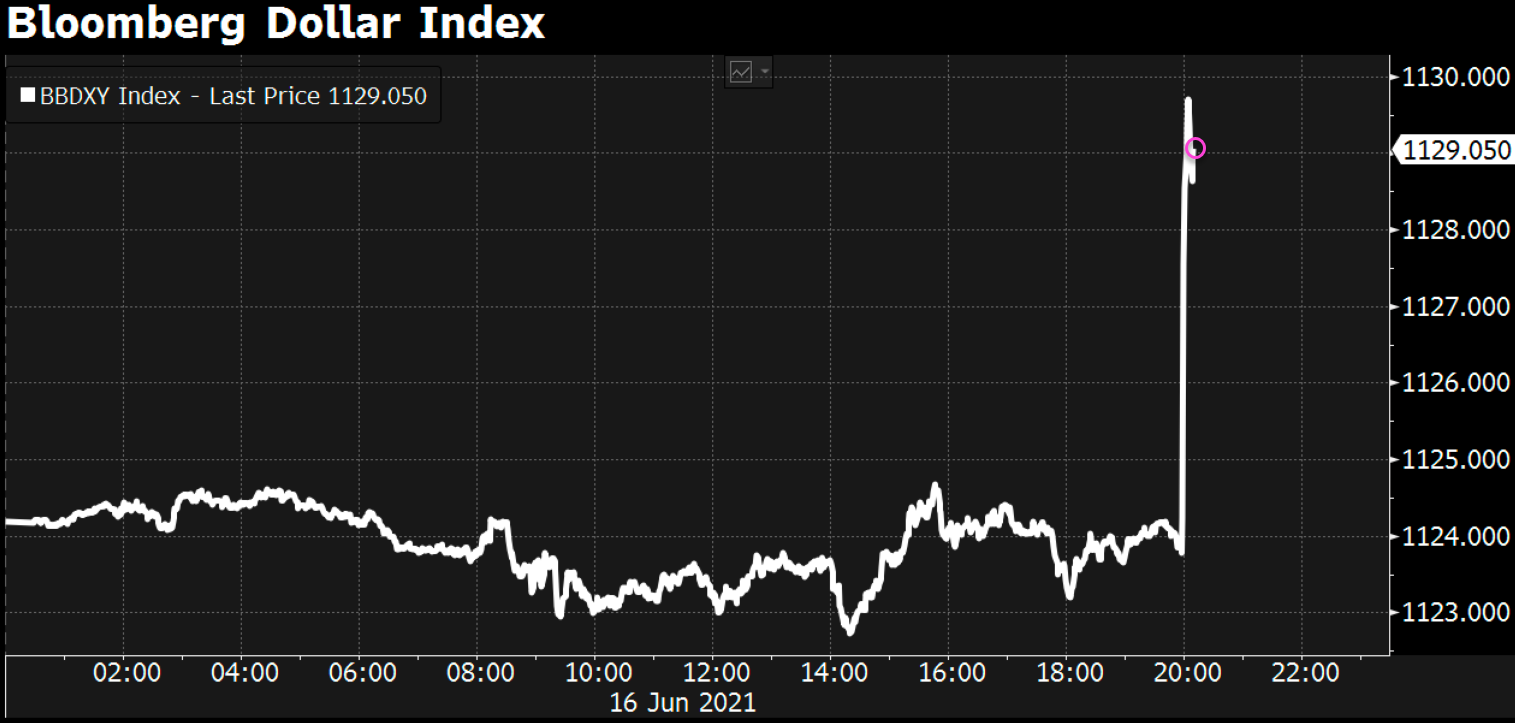
The $US made a new rally high today.

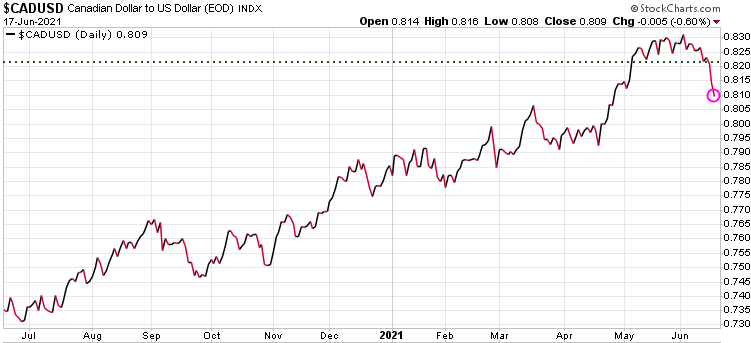
With $US strength, most other currencies are struggling, and the $CAD is no exception. After being the strongest major currency in the world the past year, the Loonie just fell below near-term support.

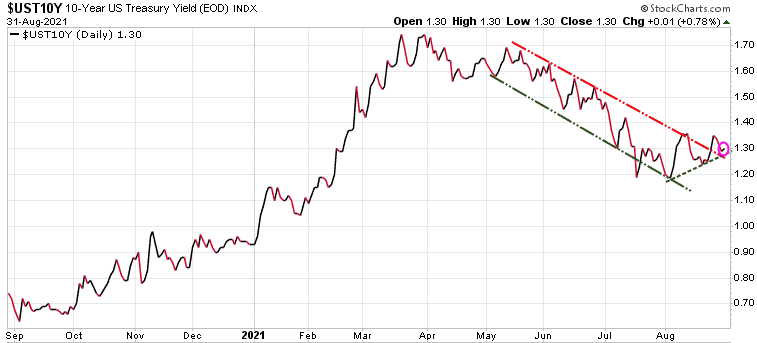
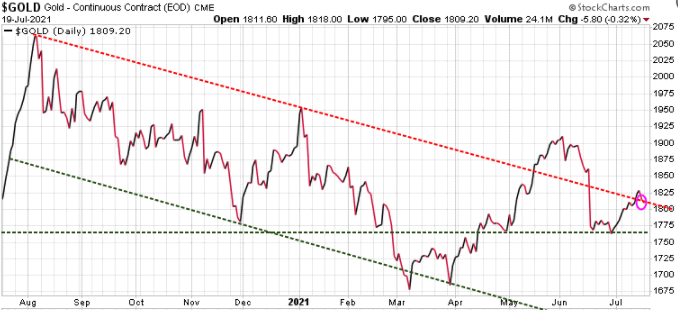
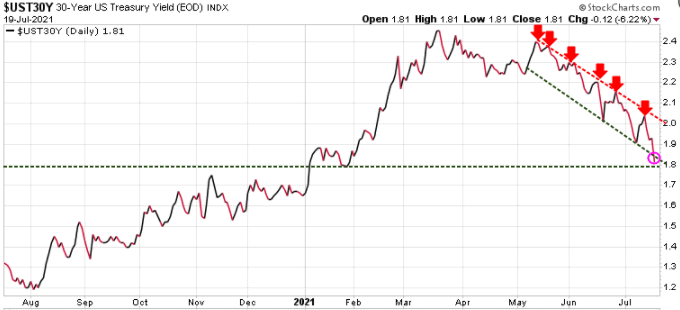
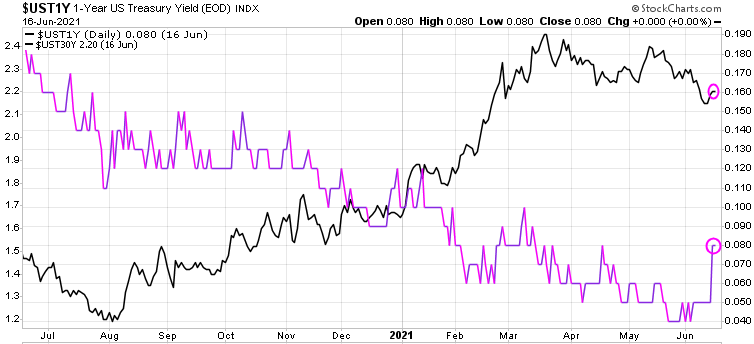
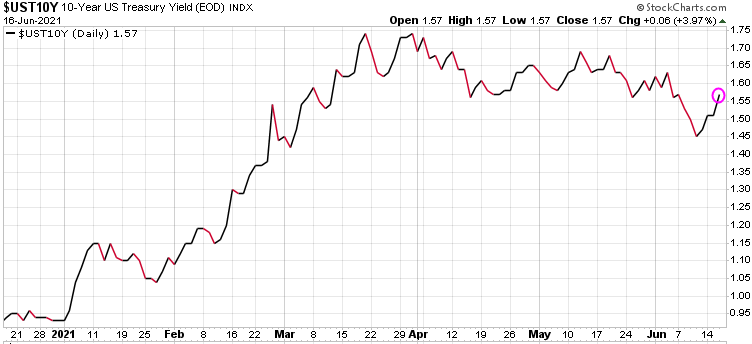
While stocks have kept rising on expectations of the economy growing post pandemic, the bond market is seeing things a little differently. Bonds have been rising, meaning yields dropping, telling us that the much bigger bond market is expecting slower growth than the equity markets are expecting.

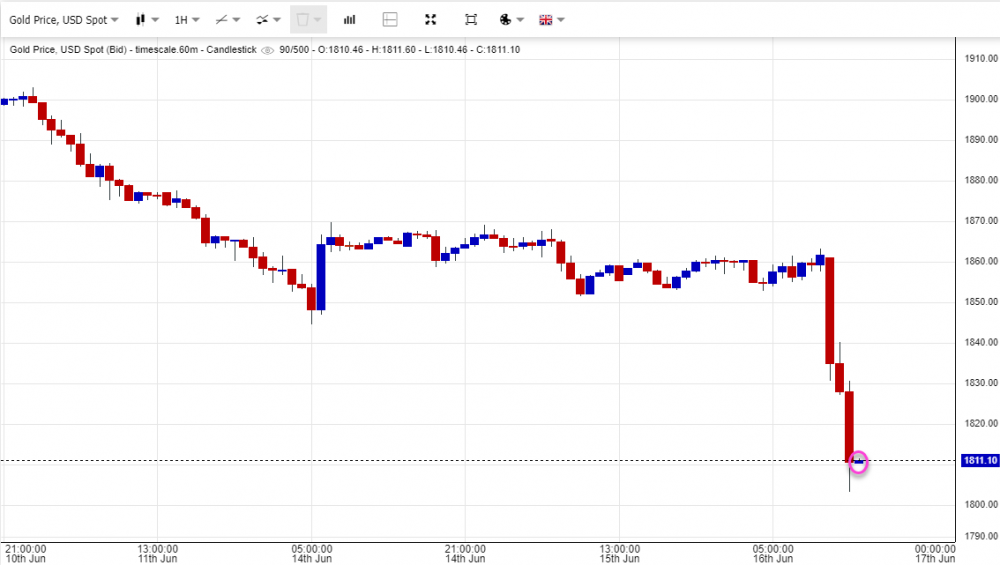
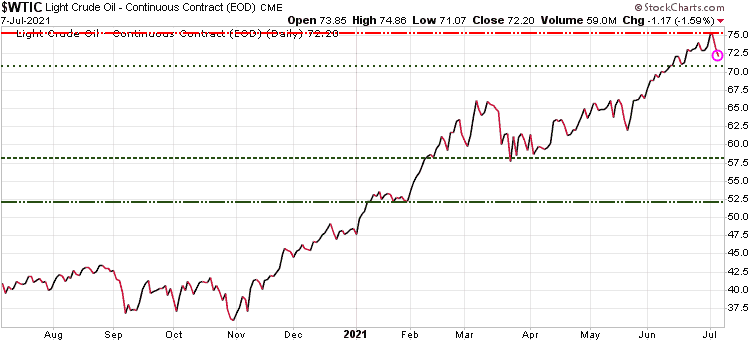
The price of oil took a hit, based on $US strength and concerns after OPEC+ cancelled talks with no resolution.
Full update on all sectors in Sunday’s issue of the Trend Letter.
Stay tuned!
If you are not a subscriber but would like to be, see below for some great Special Offers on all our services.
Trend Letter:
Since start-up in 2002 Trend Letter has provided investors with a great track record, giving exceptionally accurate information about where the markets are going, and it has explained in clear, concise language the reasons why. Using unique and comprehensive tools, Trend Letter gives investors a true edge in understanding current market conditions and shows investors how to generate and retain wealth in today’s climate of extreme market volatility.
A weekly publication covering global bonds, currencies, equities, commodities, & precious metals. Over the 20 years Trend Letter has been published, it has achieved an incredible average return of 65% on its closed trades.
Timer Digest says: “Trend Letter has been a Timer Digest top performer in our Bond and Gold categories, along with competitive performance for the intermediate-term Stock category.”
Technical Trader:
Trend Technical Trader (TTT) is a premier trading service, designed to profit in both up and down markets. Included is our proprietary Gold Technical Indicator (GTI).
TTT had another excellent year in 2020 averaging +27.3% per closed trade with an average holding time of 9.5 weeks, or +149% annualized overall.
Over the past 5 years TTT’s closed trades have averaged +40% annualized.
Trend Disruptors:
Disruptive technology trends will propel our future and the reality is that no industry will go untouched by this digital transformation. At the root of this transformation is the blurring of boundaries between the physical and virtual worlds. As digital business integrates these worlds through emerging and strategic technologies, entirely new business models are created.
Trend Disruptors is a service for investors seeking to invest in advanced, often unproven technology stocks on the cheap, with the objective to sell them when masses finally catch on. Covering Artificial Intelligence (AI), Virtual Reality (VR), Augmented Reality (AR), 5G, Quantum Computing & many more.
Trend Disruptors has realized average annualized gains of 178% over its 3 years of service.
Special Offers
| Service | Regular Price | Special Price | Saving | Subscribe |
|---|
| Trend Letter | $599.95 | $399.95 | $200 | |
| Technical Trader | $649.95 | $399.95 | $250 | |
| Trend Disruptors | $599.95 | $399.95 | $200 | |
| Better Deals | | | | |
| Trend Letter + Technical Trader | $1249.90 | $599.95 | $649.95 | |
| Trend Letter + Trend Disruptors | $1199.90 | $599.95 | $599.95 | |
| Technical Trader + Trend Disruptors | $1249.90 | $599.95 | $649.95 | |
| Best Deal | | | | |
| Trend Suite: Trend Letter + Technical Trader + Trend Disruptors | $1849.85 | $799.95 | $1,049.90 | |