Posts by The Trend Letter
MoneyTalks radio interview with Trend Letter’s Martin Straith
“The EU has now had a decade of economic crisis and is slowly moving from economic crisis towards a full-fledged social/political crisis which will be its ultimate undoing. Result: European capital will look for a safer place to park.”
The Trend Letter founder and editor Martin Straith joins Michael to discuss how moving and diversifying your capital can lead to safer and more consistent results.
The interview with Martin starts at 18:10. Click Here to listen in.
In the interview Martin offered MoneyTalks listeners a Special Offer, and will donate $50 each to Kids Help Phone & Special Olympics for every new subscription. Here is the Special Offer:
The Trend Letter = $599.95 $399.95 per year Subscribe
Great track record dating back to 2002, a weekly publication covering global bonds, currencies, equities, commodities, & precious metals
Trend Technical Trader = $649.95 $399.95 per year Subscribe
A premier online hedging service designed to profit in a declining market. Includes our proprietary Gold Technical Indicator (GTI)
Trend Disruptors = $599.95 $399.95 per year Subscribe
A service for investors seeking to invest in advanced, unproven technology stocks on the cheap, with the objective to sell them when masses finally catch on. Covering Artificial Intelligence (AI), Virtual Reality (VR), Augmented Reality (AR), 5G, Quantum Computing, & much more.
All 3 services for only $899.95 per year Subscribe
Any two subscriptions for only $699.95. Let us know which ones you are interested in subscribing to by sending a note to info@thetrendletter.com.
Trend News Team
How to identify a stock market top months before it happens
Most investors understand that the stock market doesn’t follow the economy, it leads it. That means we cannot wait for a recession to get out of the markets because the markets generally start to fall months before a recession kicks in.
If the stock market tops before the economy goes into a recession, how do we know when the stock market is going to top? Fortunately, there are a couple of key LEADING indicators that always precede a recession, and more importantly for investors, a major top in the stock market. These key indicators are the Yield Curve and the Conference Board LEI Index.
Yield Curve:
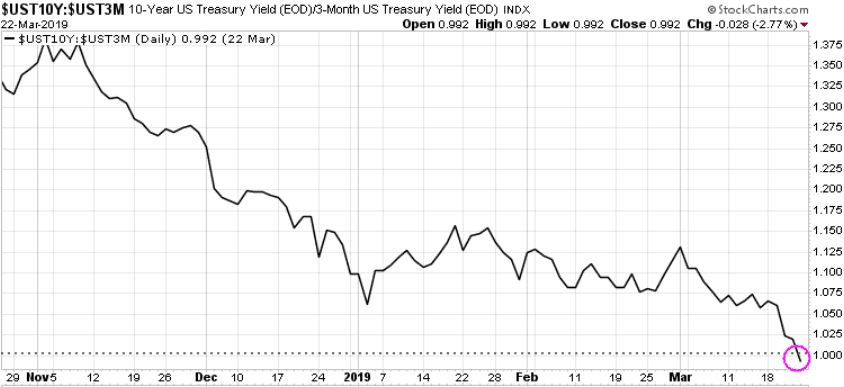
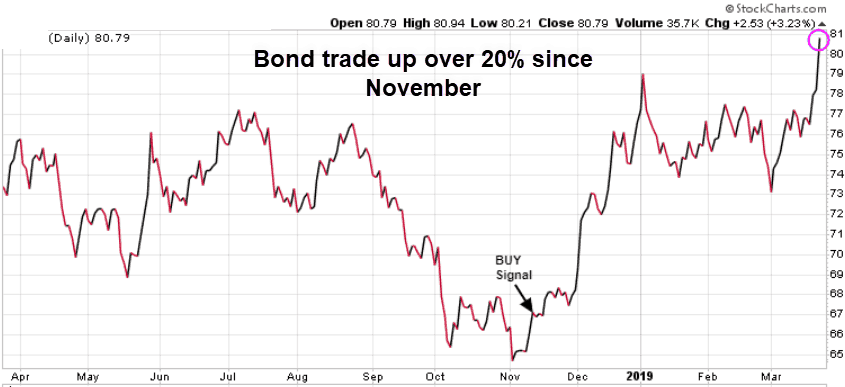
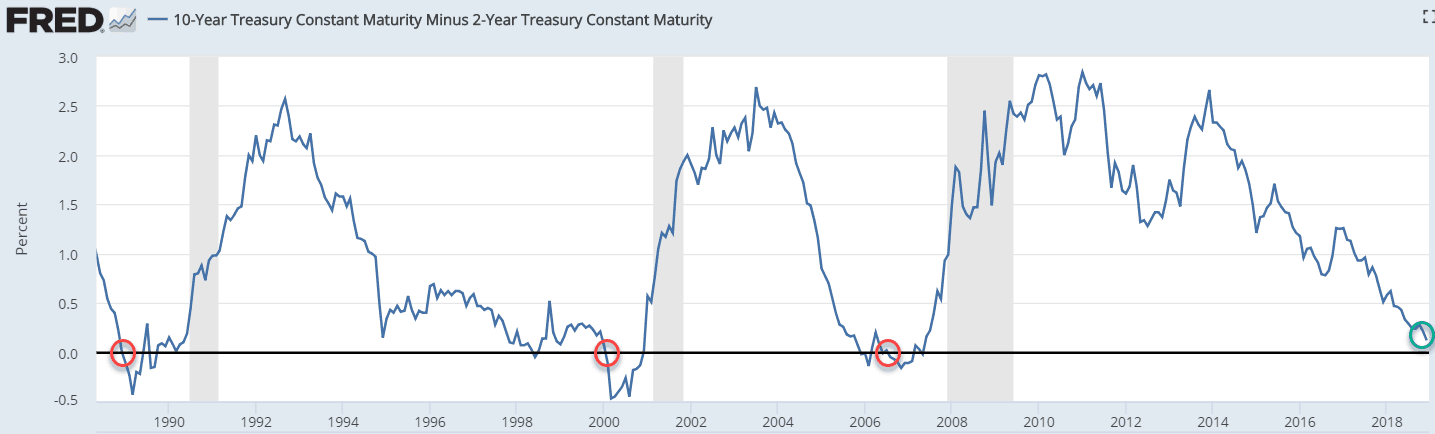
Normally, long-term yields are higher than short-term yields for the logical reason that lenders want a higher risk return when lending money for 10 years than they would for lending it for 2 years. There is a higher risk that the longer term loan may not get paid back in 10 years.. But occasionally, this relationship changes, and short-term yields rise above long-term yields. Because investors are willing to accept a lower yield in the longer-term 10-year bond over the 2-year warns that these investors are expecting lower rates in the future so the demand for longer-term bonds increases, pushing yields lower (bonds prices and yields move opposite each other).
When short-term yields are higher than long-term yields, the yield curve (spread between the long-term and short-term yields) is said to be “inverted” and when it happens it has historically been one of the most accurate predictors of recessions and the start of major bear markets in stocks.
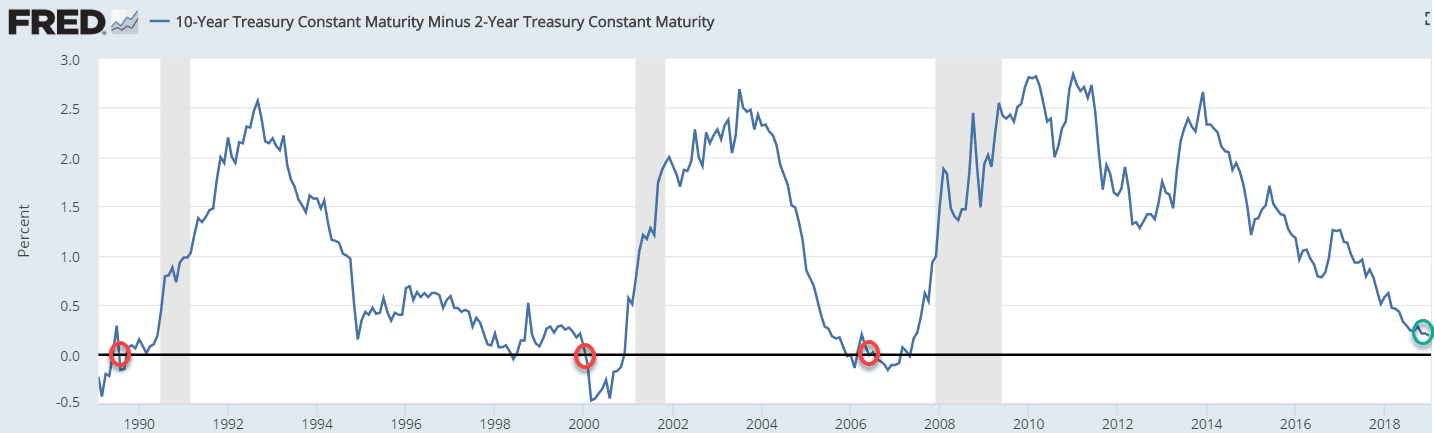
The red circles on the following chart show each time since 1990 when the yield curve ‘inverted” (below zero). Once inverted between 12 and 18 months later we see a recession starting (grey bars). We can see on the far right that the current spread is not inverted, but it is getting very close. The current spread between the 10-year and 2-year yield is only .17%.
Conference Board LEI
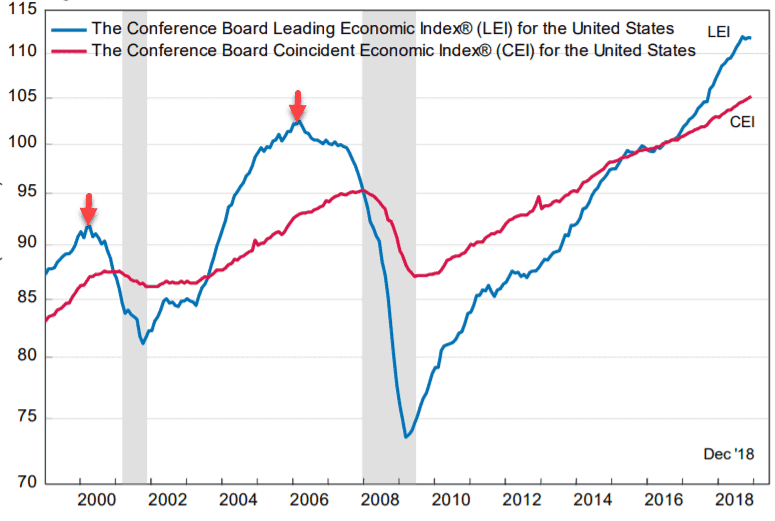
Another leading indicator we pay attention to is the Conference Board Leading Economic Indicator (LEI). The LEI for the US looks at 10 different economic indicators, everything from employment, to housing, to interest rates. Like the inverted yield curve, this indicator has an incredible track record of predicting recessions. On the chart below we can see how the red arrows highlight that when the LEI (blue line) tops out it always precedes a recession. Looking at the top far right corner we can see that the LEI has leveled off, but has not yet topped out, but we need to keep our eye on that.
A road-map to a stock market top
Now let’s look at how these indicators warn of coming stock market tops. On the chart below the pink vertical lines show when the yield curve first inverted, the yellow vertical lines show when the LEI topped out and started turning down, the red circles show when the stock market had a major top, while the grey shaded area shows a recession. We only show the last two stock market crashes in this chart, but the story is the same for decades. Every major stock market top was preceded by an inverted yield curve and a top and decline of the LEI.
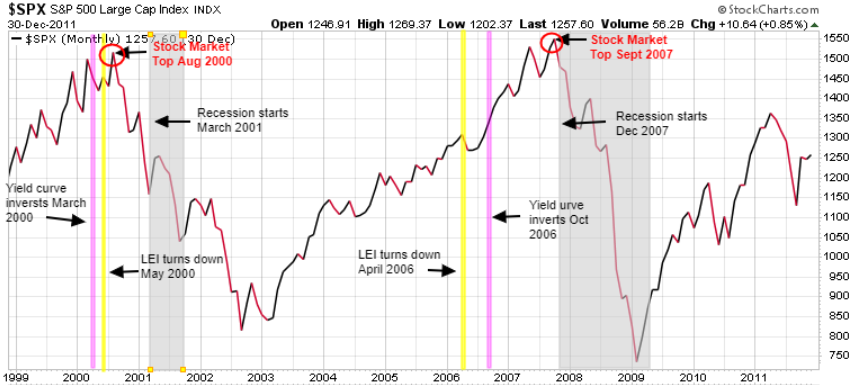
In the 2000 DOT COM market crash the Yield Curve inverted 12 months before the recession and 5 months before the stock market top. The LEI topped out 10-months before the recession and 3 months before the stock market top.
In the 2007 Financial Crisis stock market crash the LEI topped out 20 months before the recession and 17 months before the stock market top. The Yield Curve inverted 14 months prior to the recession and 11 months before the stock market top.
So while the talking heads are calling for the end of this bull market in stocks, we will wait for proof. That does not mean we will not see a very volatile market with many spikes both up and down.
Once we see the negative signals from these two key LEADING indicators we should have at least a few months warning before we see the top in the stock markets. We regularly update Trend Letter subscribers on the status of these indicators.
At this time our models are indicating we will see a final run up in stocks, likely to new highs, before we see the top in the stock markets.
But make no mistake, while we see higher highs before the bubble finally pops, the risk of a serious market pullback has risen significantly in recent months. We always preach to subscribers to always decide on an exit strategy BEFORE you make any investment. Always have a plan to get out in case the market moves against you. For our subscribers we always identify our BUY and SELL Stops before we enter a trade. If the trade starts to rise, then we raise our SELL Stop. If our SELL Stop is hit, we SELL. Each investor is responsible for deciding the right BUY and SELL Stop for their situation. Work with an independent financial analyst to ensure that you are not taking on too much risk.
One thing we know is that while the next bear market is not necessarily imminent, it is inevitable. If you’re nearing retirement or already retired, it is time to have a plan to get “defensive”.
With this historic market melt-up now over 9-years old, it is time for all who have equities exposure to prepare for the inevitable market melt-down.
Are you prepared?
Seriously think about subscribing to our hedging service Trend Technical Trader and put yourself in position to not just survive the coming melt-down, but to actually profit from it.
Stay tuned!
Do we see a top in the S&P 500 next week?
The S&P 500 closed Friday at 2670.71 up 2.87% for the week and up 13.58% from its December 24th low. While this rally has been very impressive, our timing models are showing that Tuesday will be a key date (US markets are closed Monday for MLK Day), and suggests we could see a top and directional change early next week, likely starting Tuesday.
As we can see on the following chart the S&P has now recovered all of its losses from mid December to the 24th. While it is possible we could see another spike higher on Tuesday, based on timing, we expect to see the market turn lower.
On Tuesday watch for another downturn with the key support levels being 2600, 2540, 2450 and then ultimately the December 24/18 low of 2351.10. On the bullish side, only a break above the 2725-2776 resistance level, and then holding above 2830 would suggest new highs are in the cards.
What could trigger a negative turn in the markets next week? The list is long, here are a few potential contributors:
- The British parliament voted down the Brexit proposal this week and now on Monday the UK PM May must present her new Brexit plans
- Ongoing China/US trade tensions
- Escalating tensions between China & Canada related to Huawei CFO detention
- The reality that China’s economy is slowing down which could seriously impact global economies
- The declining economy in Europe, and the looming banking crisis there
- Growing calls from Democrats for Trump’s impeachment
- Continuation of the US government shutdown
- To solicit votes from millennials the election platform from the progressive left will be: guaranteed income, free university, free healthcare, free everything, resulting in increased debt & taxes
Understand that we are getting closer to that point where the ‘trust’ & therefore ‘confidence’ in government seriously deteriorates. This will ultimately cause investors to really question whether they want to invest in government bonds or move their capital into private companies via stocks. Investors who understand how the global flow of capital drives all markets are the ones who will thrive over the next few years. Those who don’t, won’t.
Subscribers will get the full picture in Sunday’s issue of the Trend Letter. If you are not a subscriber but wish to be, click here to subscribe.
Stay tuned!
Target levels for Year-end for the S&P 500
In Wednesday’s blog after the S&P 500 soared a record 116.60 points or 4.86%, we warned “be careful here, we are not out of the woods yet!” Monday is year-end and here are our key targets for a Monday close:
Friday’s close was 2485.74
2575 – a Monday closing below this resistance level (top red line) suggests that this recent rally will be short-lived and a re-test of 2400 is likely.
2395 – a closing below this support level (lower green line) suggests a steep correction is possible.
In the bigger picture we need to see a break down below its 9+ year uptrend channel to open the door for a steep correction.
An incredibly reliable leading indicator that has an incredible record identifying stock market tops:
We show this indicator to our subscribers often as it is a key leading indicator. You have probably heard the term ‘inverted yield curve’ but likely do not know how reliable it is at warning of a coming recession and stock market top. The yield curve we are referring to is the spread between the yield on the 10-year government bond vs the yield on the 2-year bond. These yields tend to move for different reasons, with the longer-term 10-year yields moving based on the market, while the shorter-term two-year yields move largely due to the actions of the Federal Reserve.
Typically, long-term rates are higher as investors demand higher payments due to the risk of lending their money for a long time, which makes sense. But this last year the Fed has been hiking rates, which has pushed up the yield on the 2-year bonds faster than the yields have risen on long-term bonds.
Below is the current chart of the spread between the 10-year yield and the 2-year yield. We have marked with red circles each time since 1988 where the yield curve has inverted, meaning that the short-term 2-year bond had a higher yield than the longer-term 10-year bond. The key is that every time this has happened, between 12-18 months later the stock market topped and then reversed, heading much lower. As we can see on the right hand side of this chart, the yield curve is not yet inverted, but it is very close, just .18% points away. But remember this is a leading indicator, meaning that even if it inverts next week, we should have between 12-18 months before the stock market top is in.
That doesn’t mean we won’t see more volatility like we are experiencing now, it just means we are not likely to see the final top for a while yet.
There will be a full update for subscribers in this weekend’s issue of the Trend Letter.
Stay tuned!
Stocks rally for single day record
After a being down almost 16% so far in December, the S&P 500 soared a record 116.60 points or 4.86% on Boxing Day. A recovery was certainly not unexpected to Trend Letter subscribers as we have been warning on how oversold the market was. But be careful here, we are not out of the woods yet!
Typically, when you get such a large sell-off there is a rally, but that rally typically dies and we see a re-test of the lows. While we could see a nice rally here to end the year, our models are projecting that we see another test of the lows, likely early in the New Year.
Stay tuned!
Don’t panic! Profit in a declining market
Below is today’s update from our hedging service Trend Technical Trader (TTT). Links to archives will not work as this is subscriber content only. But this should give you a good understanding of how a good hedging service can not just protect you in a declining market, but actually allow you to make significant gains in a relatively short period of time. If you wish to subscribe to TTT Click Here to receive a $250 discount and pay only $399.95.
——————————————————————————————————
The DJIA dropped 1656 points this week, in what is the worst December for stocks since 1931.
Posted October 29: Please keep the DJIA chart and related commentary posted in the “General Recap” section below in mind. While the quarter isn’t over yet, we currently have a situation in quarterly momentum not seen other than on December 31 1999 and June 30 2007. Those dates immediately preceded the biggest bear markets of the past few decades. It’s still a very long way down, in points and in time, before the gross excesses of the past several years are unwound.
Posted October 03: While the senior index has made new all-time highs this week, the typically leading small-caps printed a two-month low Tuesday. That’s a historically unprecedented divergence. The only comparison was in early April of 2000, before one of the biggest market crashes of all time, when the DJIA made a two-month high while small-caps made a two-month low.
Small-caps often lead markets. The Russell 2000 Small-Caps index closed at a 2-year low and is not just down since the start of 2018 but down since the start of 2017.
GS (Goldman Sachs), our market barometer, closed at a 2-year low and below a supportive uptrend stretching back more than a decade to the low of 2008.
Don’t think this can’t happen to the DJIA or S&P500, or your favorite stocks. It can, and arguably it should since the excesses of the past decade are nowhere near unwound.
Stocks are just now finally oversold in the short term, neutral in the intermediate term, and still massively overbought in the longer term.
Keep in mind that it is from such slightly oversold conditions that crashes often occur, and that there’s been no sign of panic selling so far so that could still happen before a significant relief rally begins. The more likely short-term action however is a bounce into the new year.
Hedge position 1 (actual symbol subscriber content only) hit our sell limit today for a gain of 70% in 10 weeks!
Hedge position 2 (actual symbol subscriber content only) is up 47% for us since September. We’ll offer it up for sale as per the “Open Positions” section below.
Hedge position 3 (actual symbol subscriber content only) was recently sold for a gain of 40% in 5 weeks. We’re raising the buy limit to repurchase it.
Our 4 positions (actual symbol subscriber content only) to short junk bonds have closed at an 18-month high! We’ve raised stops on two of those.
——————————————————————————————————
***Understand that these hedging strategies are simple for any investor to action, a simple click of the mouse on your online trading account, the same as trading any other stock or ETF.
Want to subscribe?
Option 1: Subscribe to TTT and have a plan to not just protect yourself during market corrections & crashes, but to actually profit from it, CLICK HERE and save $250 off the regular price and pay only $399.95. It’s your money – take control!
Option 2: Subscribe to both the Trend Letter & Trend Technical Trader for only $699.95, a savings of $550.00. CLICK HERE to take advantage of this offer.
Stay tuned!
S&P hits our target today, but is this the bottom?
For months we have highlighted our model’s target of 2470 as a low for the S&P 500. In our November 11th post we showed our model’s bearish projection for the S&P 500 to have a cycle inversion targeting a drop to 2600 and even 2500 by year-end. In our November 20th post we showed the following chart of our models’ projected path for the S&P going into year-end.
As we can see on the chart below the S&P is trading almost exactly as our model projected, closing today at 2467, just 3 points off our target. After the initial test of 2500, our models called for a rally back to 2600, then another re-test down to 2470. Understand that if the S&P breaks below that 2470 support area we could be in for a much deeper correction. Watch Friday’s close, we will update subscribers in Sunday’s issue of the Trend Letter.
The fundamentals that are currently driving this correction are:
- The Fed’s decision yesterday to raise rates another .25%, plus targeting two more increases next year
- Ongoing concerns about trade, especially with China
- Brexit
- Ongoing concerns about Italy and the EU
- and now the threat of a US government shutdown
With trade, here is what we told our Trend Disruptors Premium subscribers this morning…
“We know that Donald Trump watches the markets closely as he feels it is virtually an arbiter of his success or failure as a President. We know that ‘The Donald’ will want a rising stock market as he enters his re-election campaign and he knows he will not get one until he gets some kind of deal with China. We believe that Chinese President Xi also needs a deal, so we expect that common interest will lead to an agreement.”
Bottom line is that technically speaking the S&P has followed our model’s projection to a tee and now we need to see if this 2470 range is indeed the bottom. As noted in prior issues, our model projected that after hitting 2470 we should see a rally back to 2600 and then likely another test of the 2500 level.
Are you worried?
If you are worried about your investments and are losing sleep at night because of this market collapse, seriously think about subscribing to our hedging service Trend Technical Trader (TTT). TTT currently has two open positions that are directly hedging against a stock market decline. Those positions are up 63% (since Oct 4/18) and 38% (since Sept 5/18). In addition to these two open positions, TTT has recently closed two hedge positions for profits of 49% (in 2 weeks), and 54% (in 6 weeks).
The message here is simple, you do not need to lose money in a declining market, you can not only protect your investments and your wealth, but you can actually make significant gains in a relatively short period of time using these hedging strategies. Think of using these hedging strategies as you would think of buying fire insurance for your family home. Understand that these hedging strategies are simple for any investor to action, a simple click of the mouse on your online trading account, the same as trading any other stock or ETF.
If you would like to subscribe to TTT and have a plan to not just protect yourself during the next market correction or crash, but to actually profit from it, CLICK HERE and receive $250 off the regular price and pay only $399.95. It’s your money – take control!
Also…
We will make the same offer for those who are not yet subscribers to the Trend Letter. CLICK HERE to subscribe to the Trend Letter for only $399.95, a savings of $200.
Best Deal…
Subscribe to both the Trend Letter & Trend Technical Trader for only $699.95, a savings of $550.00. CLICK HERE to take advantage of this offer.
Gold
Gold is finally breaking out and has now pushed through near-term resistance at 1262 and more importantly through its 200-DMA.
Gold bottomed in mid-August, and has since slowly been moving higher, and has been increasing that pace since mid-November. Next target is the strong resistance in the 1280-1300 area. Looking good so far!
Stay tuned!
Stocks tumble, Bonds rise, & Gold breaking out
Stocks:
The S&P 500 was down 62.87 points or 2.33% today and was down 4.5% for the week, its worst week since March. As we can see on the following chart the S&P 500 has been trading in a range between 2600 and 2825 and is now testing the low end of that range. If the 2600 support level does not hold, we will likely see trading algorithms kick in and push the market lower, with a test of 2500 a valid scenario.
Watch the 2600 support level for next week, it is key. We have warned that instead of a Santa Claus rally we could well see a cycle inversion where instead of a rally we see a correction.
The main noise this week was the arrest in Canada (Vancouver) of Huawei CFO (Meng Wanzhou). Ms Meng was arrested at the request of the US government. On Friday in the Supreme Court of British Columbia a Canadian government lawyer said Ms Meng was accused of “conspiracy to defraud multiple financial institutions” using a Huawei subsidiary called Skycom to evade sanctions on Iran between 2009 and 2014. According to sources she faces up to 30 years in prison in the US. This incident has the market nervous that it will negatively impact trade negotiations between the US and China.
Next week’s vote on a deal covering Britain’s exit from the European Union as well as negotiations between Italy and the EU over its budget deficit also contributed to the risk-off sentiment with investors.
Bonds:
With a risk-off sentiment in equities, capital continued to flow into US bonds, driving yields lower. The yield on the US 10-year has broken below its uptrend line and closed today at 2.85%.
Gold:
Gold had a good day and has now broken above near-term resistance at 1237, closing the week at 1253.
In the bigger picture gold has been trading in a 7+ year downtrend channel, a classic bear market. Earlier this year gold managed to break through that long-term resistance level but by April gold resumed its decline and fell back into that downtrend channel. But now gold is making a run to push through this key resistance level (pink circle on chart).
Subscribers were sent another new recommendation for gold and will get a full update on Sunday.
Stay tuned!