Posts by The Trend Letter

October 24/18

Stocks:

Today stocks fell sharply lower as losses accelerated into the close, which put both the Dow and the S&P 500 into the red for the year, and the Nasdaq into correction territory (10% decline). The S&P dropped whopping 84.59 points or 3.09%.

There are lots of news items driving this decline, but we believe that politics is now moving front and centre.  It is already ugly, but this US election is going to be very destructive. We live in Canada and have no vote in the US election. Our role is to help investors understand what is happening in the global economic environment and to help subscribers protect and grow their wealth.

What we do know is that whatever your opinion of Trump the person, his policies of lower taxes and reduced regulations have been very  good for US businesses, and they have been key drivers for this bull market.  The market right now is very concerned that if the Democrats win the election, these tax breaks and reduced regulations will be rolled back, hurting the profitability of these companies, so they are selling off.

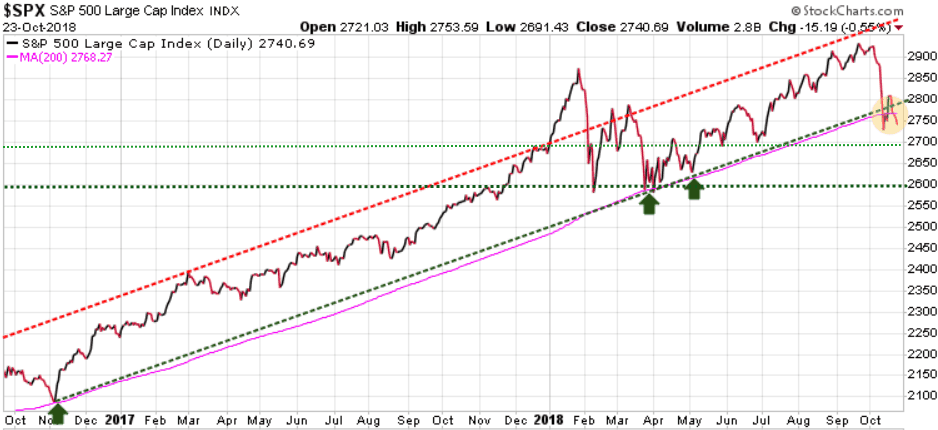
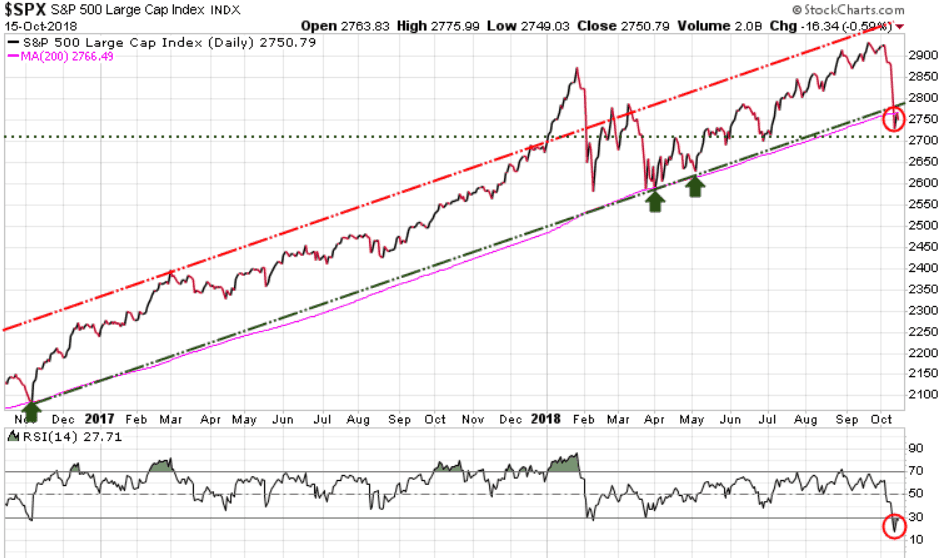
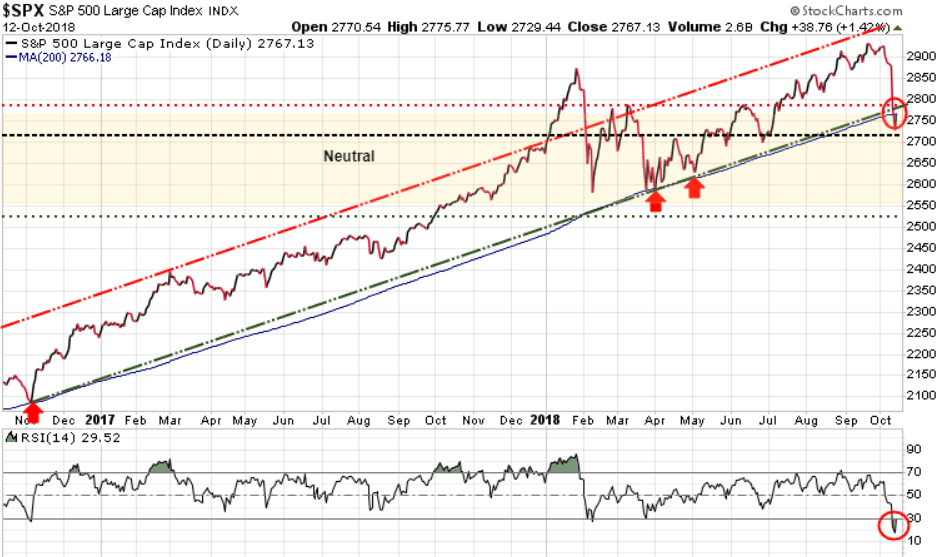
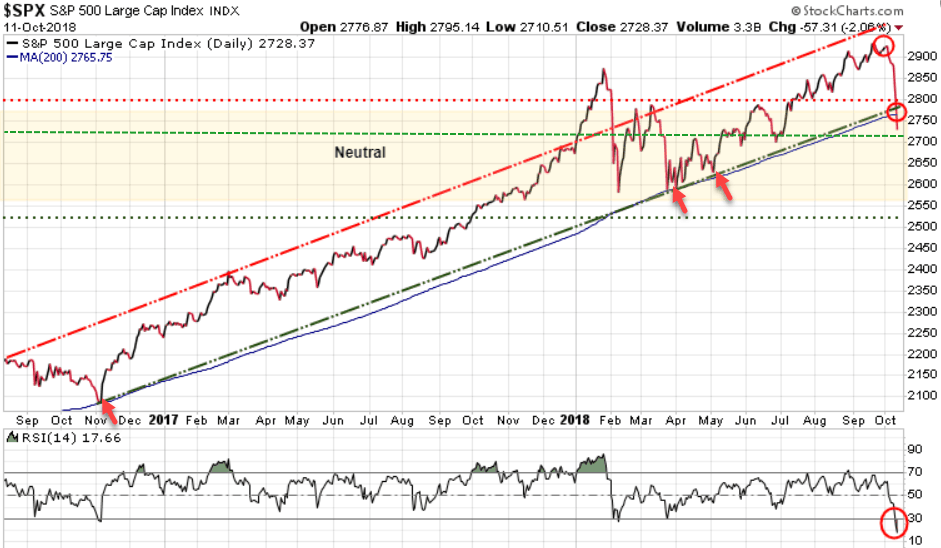
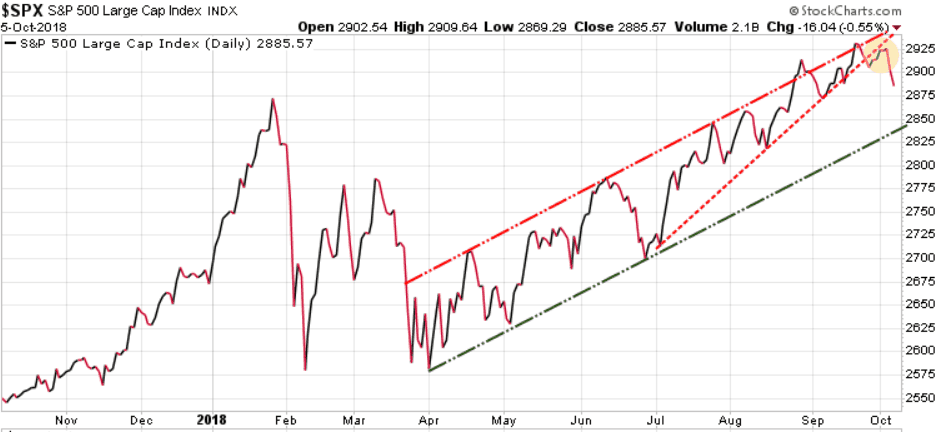
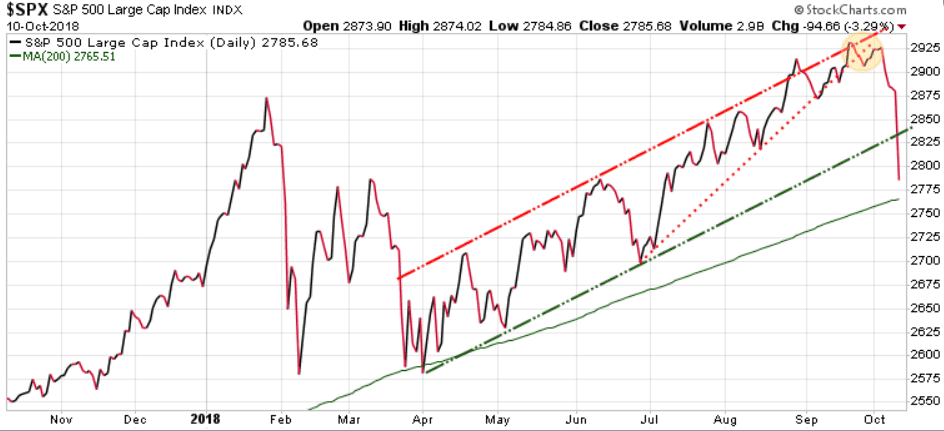
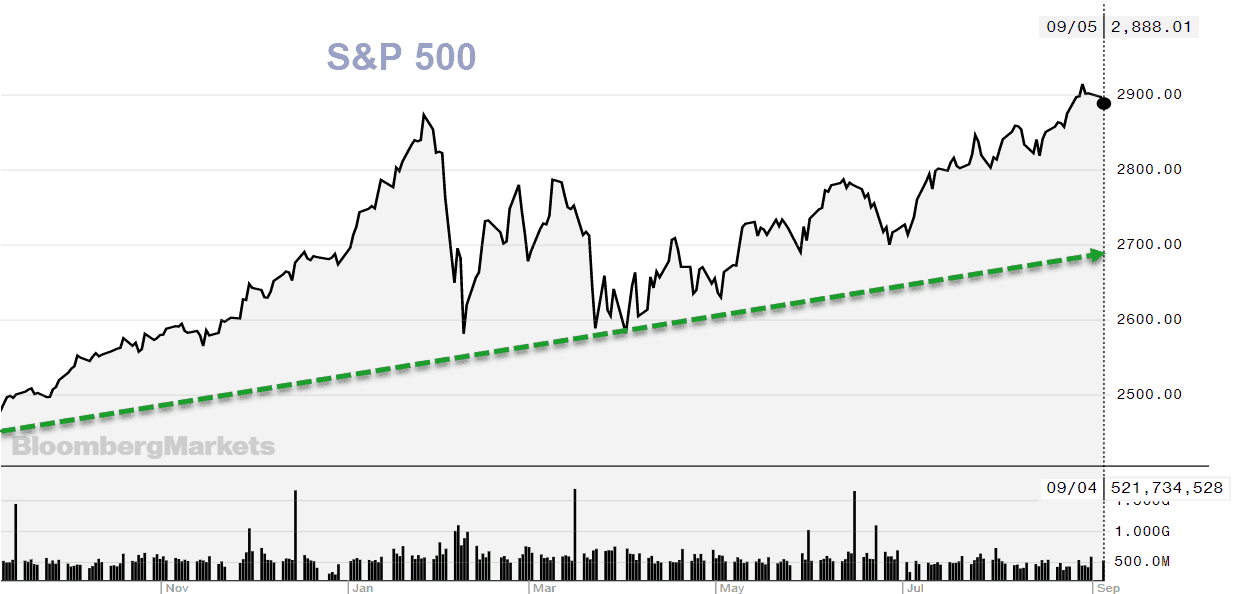
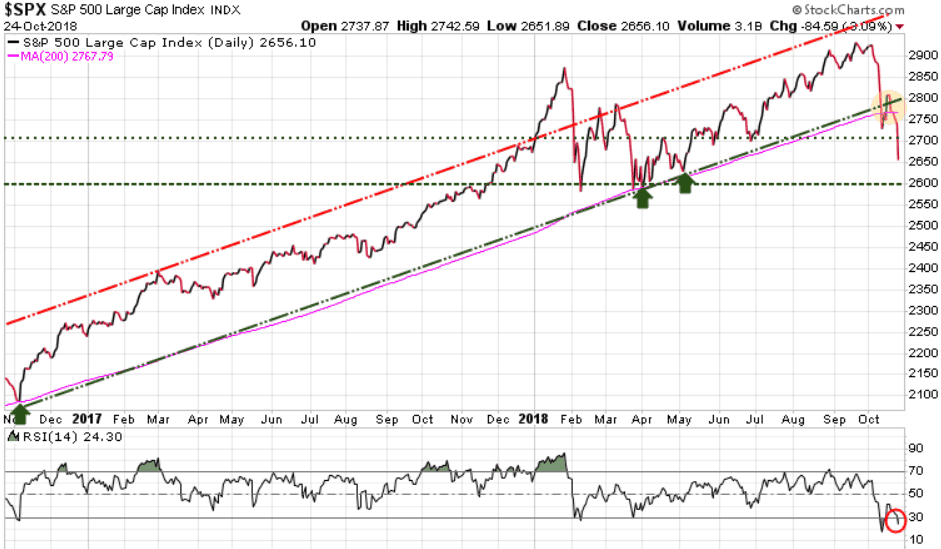
On a technical basis the S&P closed 111 points below its 200-day MA (pink line), which clearly bearish. It has also fallen definitively below its 2-year uptrend channel, also bearish.

Our next key support level is the late March low at 2600.  Our yearly forecast target low for the S&P had a potential for 2535, then 2470. Both of these will become valid if we break the 2600 level.

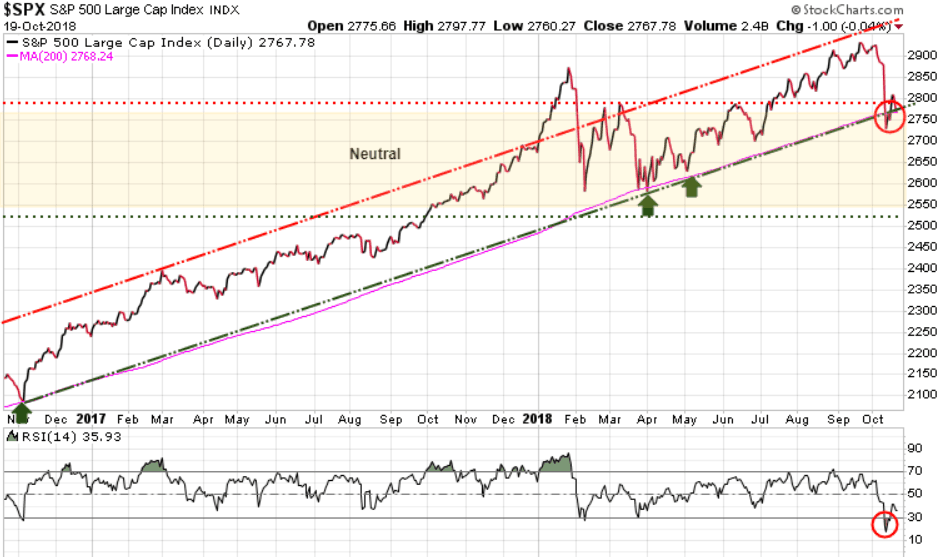
Looking at the bottom of the following chart we can see that the Relative Strength Index (RSI) has dropped to 24.30 (red circle), and whenever we see a reading below 30, it is considered oversold. This does not guarantee a rally here, but it does set up for at least a bounce soon.

spx1024

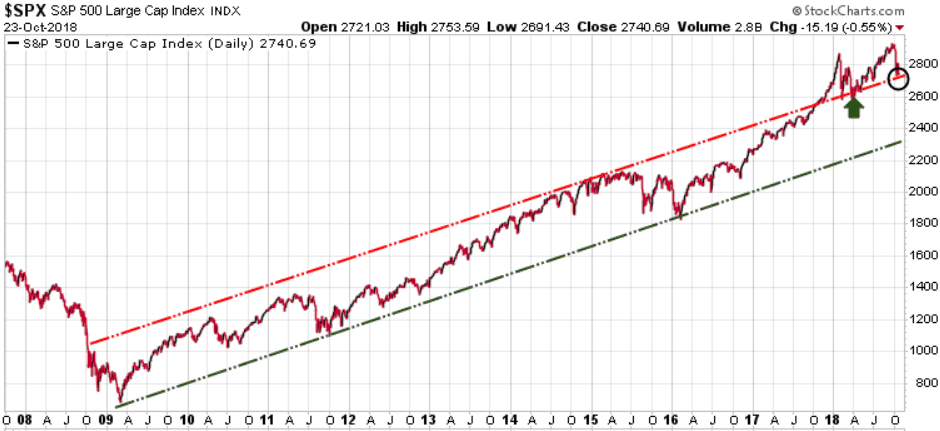
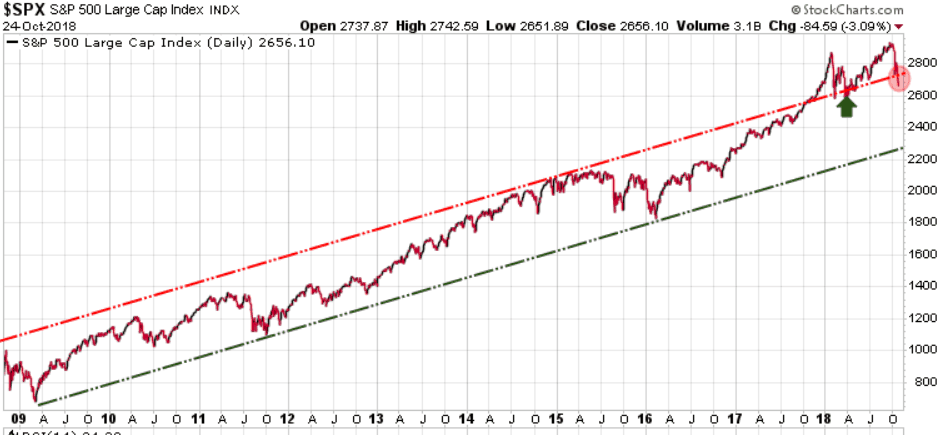
Looking at the bigger picture we see that the S&P has been trading above its 9+ year uptrend channel, although it has now fallen below the upper level of that channel.  All this action is bearish, suggesting that the S&P will very possibility test the 2600 level.  Given that markets decline much faster than they rise, we could see this support level hit this week, although the RSI suggests we see a bounce very soon.

spxlong1024

Understand that this is still a long-term bull market and that corrections are to be expected along the way. This bull market has been so strong over the past two years it appears some investors forget that corrections can be a healthy part of the process, they provide buying opportunities. We will see if this is simply a healthy correction or if it is the start of a new bear market. Everyone has an opinion, we will simply watch the numbers.

Long-term trend is bullish

Immediate trend is bearish

Our current position is neutral

Again we note: Whether you believe that this market is going to run much higher, or believe that we are now heading for a big crash, you need to have an exit or hedging strategy. This bull market will end, whether it starts today, next month, next year, or 2-years from now. Every investor needs to have a strategy to protect your wealth against a serious downside move that is accompanied by recessions.

While we are currently neutral with offsetting long and short positions, our Trend Technical Trader (TTT) hedging service has a number of more aggressive short trades and those trades have gains of 21.16% (entered Sept.5/18), 52.77(entered Sept 2/18), 45.52% (entered Oct 4/18), and 41.81% (entered Oct 4/18). All of these trades are simple click of the mouse actions, the same as trading any stock online. If you would like to subscribe to TTT, we are extending our Special Offer at $399.95, a $250 discount. Click Here to subscribe at this rate. It’s your money – take control!

Gold:

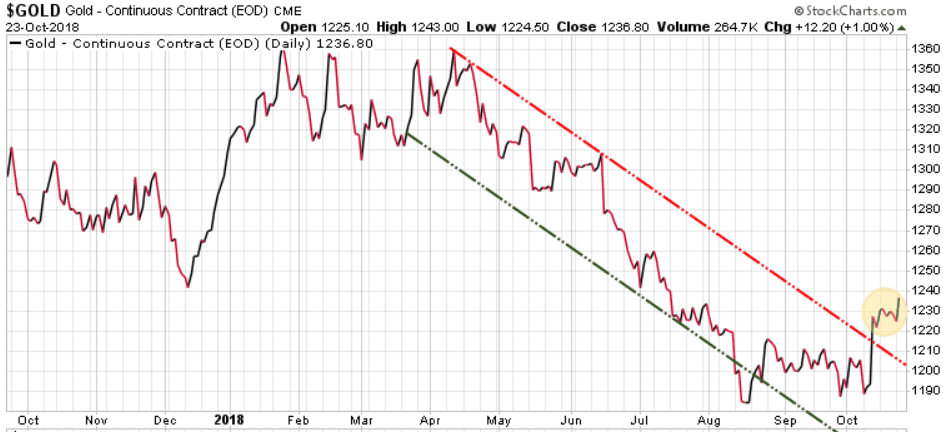
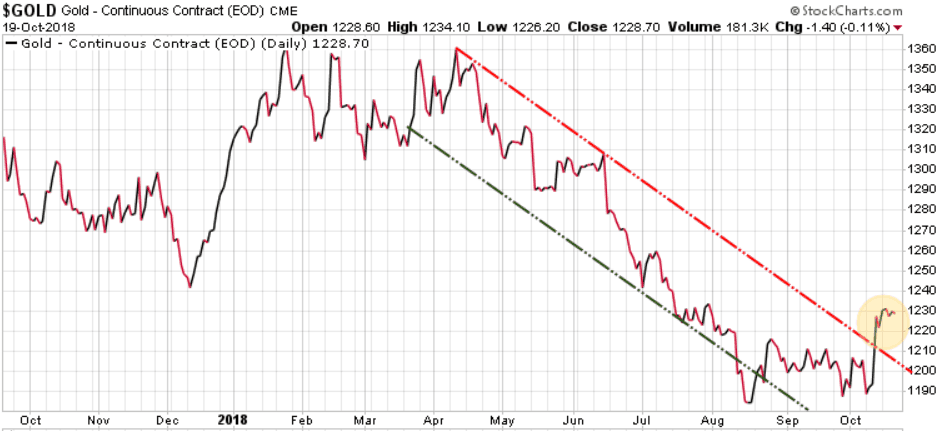
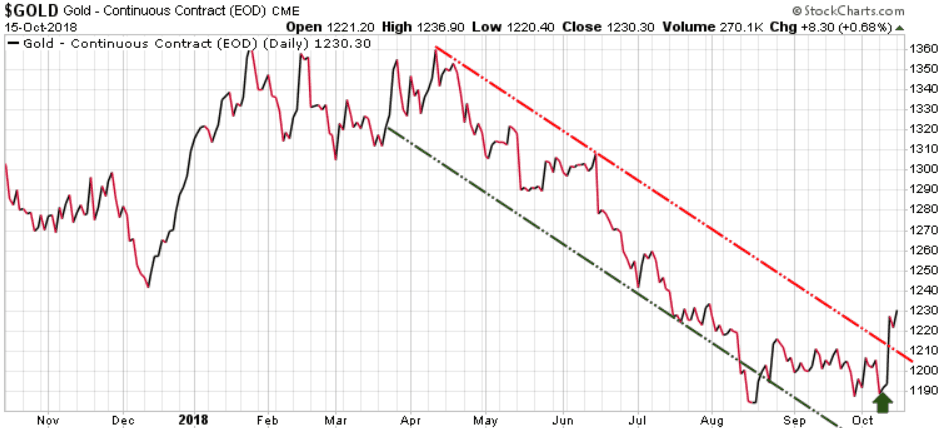
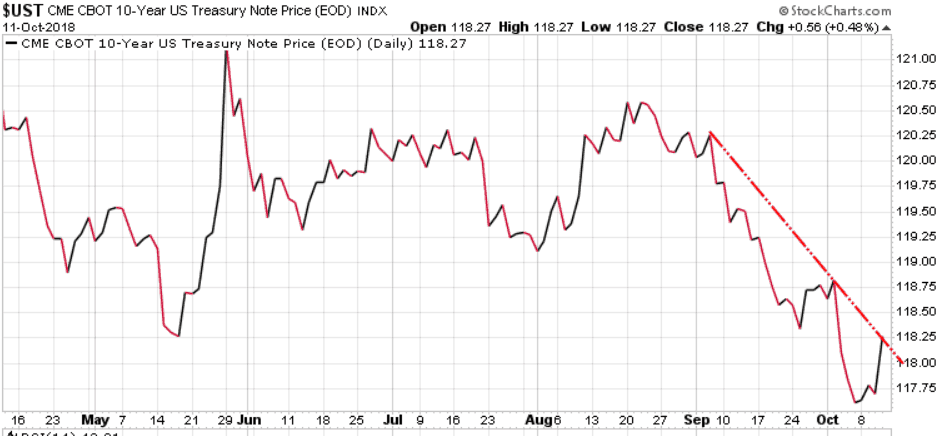
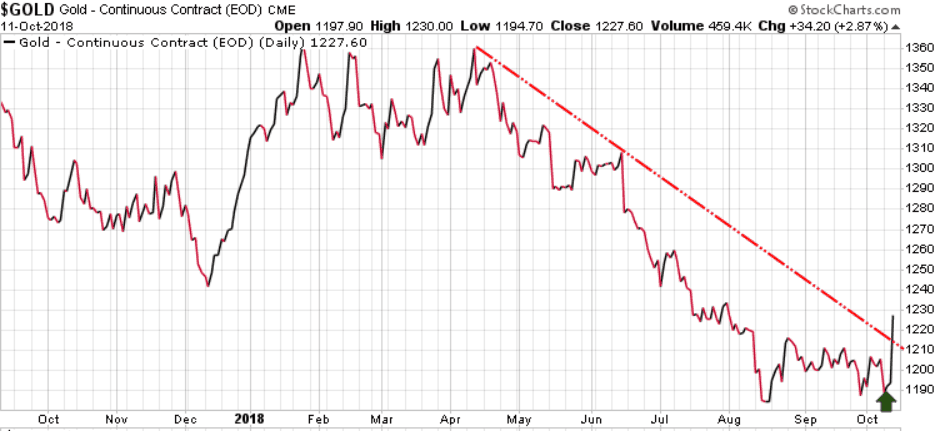
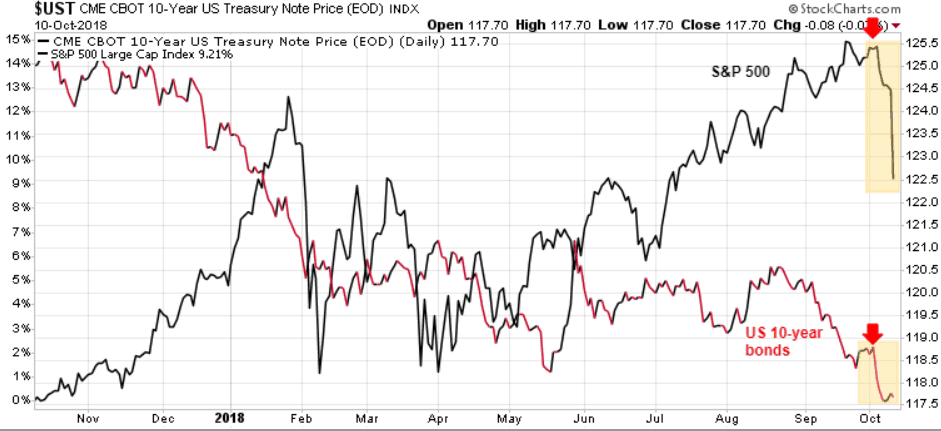
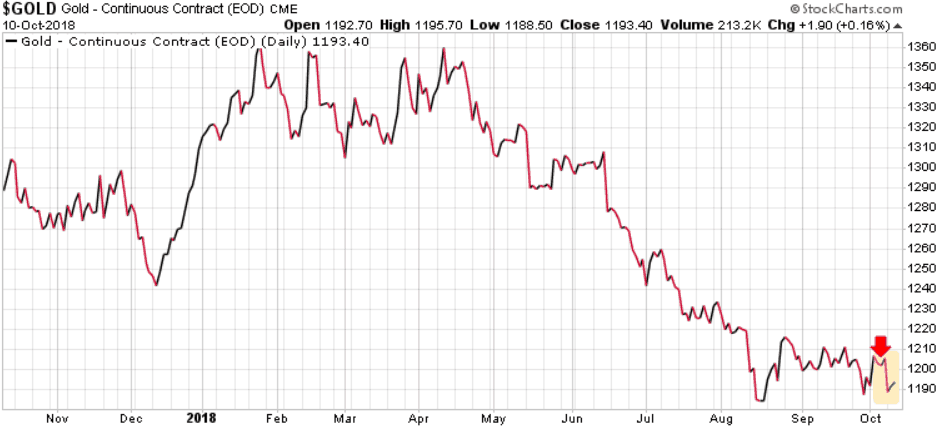
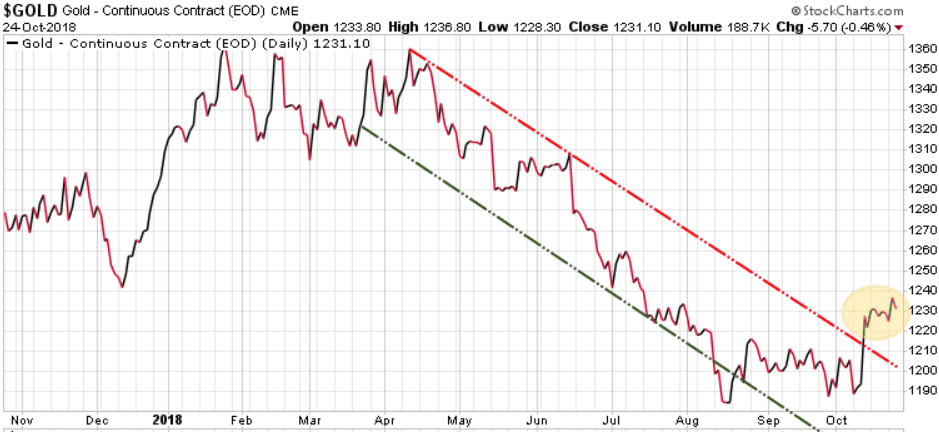
Gold was a big disappointment today, down 5.70, as it failed as a safe-haven play against a crashing equity market.  The safe-haven winners today were US bonds, the US dollar, and to a lesser degree, the Japanese Yen.

gold1024

Immediate trend is bullish

Long-term trend is bearish

Our current position is a buy

Stay tuned!

October 23/18

Stocks:

Another wild day in the markets with the S&P 500 trading in a range between the high at 2753.59 to a low of 2691.43, before rallying back some to close at 2740.69, down 15.19 or .55% for the day.

The latest news driving the market down was..

  • a Chinese official told a group of U.S. business leaders that China is not afraid of a trade war.
  • the EU has rejected Italy’s budget, demanding changes to both deficit spending and growth estimates. This is the first time the EU has rejected a countries budget. Rhetoric from both sides suggest that Italy’s relationship with the EU is not getting better.

The immediate concern here is that the S&P closed 27.58 points below its 200-day MA (pink line), so we need to keep an eye on this as in each recent test (green arrows) the 200-day MA  support level has held.

Looking at the bigger picture we see that the S&P is still trading above its 9+ year uptrend channel, although it did dip below the upper level during the day today.  In the near-term we need to see the S&P continue to close above the upper level of that channel at 2715. Keep an eye on this level.

Spxlong1023

Long-term trend is bullish

Immediate trend is neutral

Our current position is neutral

Note: Whether you believe that this market is going to run much higher, or believe that we are now heading for a big crash, you need to have an exit or hedging strategy.  This bull market will end, whether it starts today, next month, next year, or 2-years from now.  Every investor needs to have a strategy to protect your wealth against a serious downside move that is accompanied by recessions.

While we are currently neutral with offsetting long and short positions, our Trend Technical Trader (TTT) hedging service has a number of more aggressive short trades and those trades have gains of 10.9% (entered Sept.5/18), 37% (entered Sept 12/18), 33.8% (entered Oct 4/18), and 30.4% (entered Oct 4/18).  All of these trades are simple click of the mouse actions, the same as trading any stock online. If you would like to subscribe to TTT, we are extending our Special Offer at $399.95, a $250 discount. Click Here to subscribe at this rate.

Gold:

Gold popped up to 1245 at the intra-day high today as the equities were hit, but then cooled off and closed the session at 1236.80, up 12.20 for the day.

 gold1023

Immediate trend is bullish

Long-term trend is bearish

Our current position is a buy

Stay tuned!

October 19/18

We follow the trends and capital flows. Remember, this is a global market, it is all connected.

Stocks

Today was the 31st anniversary of ‘Black Monday’, when in 1987 the Dow dropped a massive 23% in one day.  Today we saw nothing like 31 years ago, with the S&P 500 up almost 30 points, before giving it all up and closing down a single point.  With volatility ramping up, traders are being more reluctant to hang on to stocks over the weekend, fearful that some event (or tweet) could send the market on another sharp decline.

Last week after the large declines on Wednesday and Thursday we highlighted how the 200-day MA (pink line on chart) was a very key support area for the S&P 500. The last three times this support area was tested (November, March, and May) this support level held (green arrows on chart below).

Last week we also noted that the Relative Strength Index (RSI) had dropped to 17.66. An RSI reading above 70 indicates that the market is ‘overbought’  and that investors have become ‘complacent’, with a ‘risk-on’ sentiment. Conversely, an RSI reading below 30 indicates that the market is ‘oversold’, and that investors have become ‘fearful’, with a ‘risk-off’ sentiment. Whenever we get to these ‘overbought’ or ‘oversold’ extremes we typically see the market reverse and move in the opposite direction.

Looking at the lower part of the chart we see that the Relative Strength Index (RSI) is now back above 30, at 35.93.

Continue to watch the 200-day MA and if the S&P cannot climb back and close solidly above this support it means we are not out of the woods yet and that more moves to the downside are certainly possible. If it can hold above that level, then this could be the low for this move and we head higher to test the previous high at 2930.

Long-term trend is bullish

Immediate trend is neutral

Our current position is neutral

spx1019

Gold

Gold was flat this week, having broken out of its near-term downtrend channel last week. Gold now needs to close above 1246, then push through and close above 1260, 1307, and 1377 to have a chance of having a solid bull run.

Long-term trend is bearish

Immediate trend is bullish

Our current position is a buy


Gold1019

There are talking heads flooding the airways with their opinions, but we just watch the numbers, and let the market tell us what direction it is going. The markets can be very deceptive and will play on your emotions. Instead of forming an opinion of what you think the market should do, watch the key support and resistance levels, and see what the market is actually doing.

The reason that we see the market reverse when it hits extremes is because the majority must always be wrong to fuel bull and bear markets. In the last stages of a bull market a mania is created where everyone wants in. Prices rise dramatically creating a FOMO (fear of missing out) sentiment where the average investor feels incredible pressure to jump into the market, right at the extreme top. At that point the early investors are more than happy to sell to the masses.  These late to the party investors are then stuck holding stocks when there are no more buyers.

In bear markets we see a similar story. As prices start to fall a new panic is created where everyone wants to sell, but there are no buyers, so the decline in prices escalates as everyone is running to the exit. Typically those same late to the party investors who bought right at the top, are the last to get out, often finally selling right near the bottom. And then the cycle repeats.


This weekend’s issue of The Trend Letter will have full coverage of where we sit with all markets, including the equity, bond, currency, precious metals, and commodity markets. If you are not a subscriber but would like to be, we are offering a special discount of $200 off the regular price of $599.95, so you only pay $399.95.  To take advantage of this offer, click here. 


If you have a substantial portion of your portfolio in stocks, or just need to protect yourself in case of a severe correction, seriously consider a ‘hedging’ strategy. While we expect to see higher highs before the ultimate top in this bull market, we certainly expect to see a great deal of volatility along the way. Last week was a wake up call for those who are not prepared for a significant correction.

We do not know of a better hedging service than Trend Technical Trader (TTT) which is designed to make money in a down market. TTT uses a combination of conservative and aggressive strategies to position subscribers to profit in a declining market. These TTT trades are simple to action, the same as any trade recommended in Trend Letter. We are offering a subscription to TTT for only $399.95 (regular price is $649.95). Click Here to take advantage of this offer. It’s your money – take control.

Stay tuned!

October 15/18

We follow the trends and capital flows. Remember, this is a global market, it is all connected.

Stocks

The S&P 500 had just surpassed Friday’s high with about an hour to go in today’s trading, then gave it all up and closed down 16.34 points or .59% on the day.

Looking at the lower chart we see that the Relative Strength Index (RSI) at 27.71 is still below 30, indicating that the S&P 500 is still oversold here. Continue to watch the 200-day MA (link line), as it has in the past acted as a very solid support level for the S&P 500. If the S&P cannot climb back and close solidly above this support, it means we are not out of the woods and that more moves to the downside are certainly possible.

Long-term trend remains bullish

Immediate trend is bearish

Our current position is NEUTRAL

spx1015

Gold

Gold had another up day, closing today up 8.30 or .68%. Gold has broken out of its near-term downtrend channel and now needs to close above 1246, then push through and close above 1260, 1307, and 1377 to have a chance of having a solid bull run.

Long-term trend is bearish

Immediate trend is bullish

Our current position is a BUY

Gold1015


Stay tuned!

October 12/18

We follow the trends and capital flows. Remember, this is a global market, it is all connected.

Stocks

A wild ride today for all core indices. The S&P 500 hit an early high at 2775.77, only to give it all up and drop to 2730.23 by noon, and then recover and close at 2767.13, ending up 38.76 points or 1.42% for the day. While the bounce today was good, as we showed in yesterday’s update, the S&P 500 was technically very oversold, so today’s rally was no surprise to our readers. We said…

the Relative Strength Index (RSI) is now at 17.66 and whenever it is below 30 it is considered oversold, suggesting that the S&P 500 could soon rally back above its 200-day MA.

Looking at today’s chart we see that the S&P 500 did indeed rally and is within a whisper of testing that 200-day MA (blue line on chart). Even though the S&P 500 rallied today it is still down 4.39% for the week, suggesting that we are not out of the woods yet, and that more volatility should be expected next week.

SPX1012

This weekend’s issue of The Trend Letter will have full coverage of how this week’s action affected all markets, including the equity, bond, currency, precious metals, and commodity markets. If you are not a subscriber but would like to be, we are offering a special discount of $200 off the regular price of $599.95, so you only pay $399.95.  To take advantage of this offer, click here. 

Also, how was your sleep factor this week? If this week’s market volatility kept you up at night, it means that you are overexposed or most likely do not have a strategy to protect your wealth in such volatile times.

If you have a substantial portion of your portfolio in stocks, consider ‘hedging’ that long exposure. This week was a wake up call for those who are not prepared for a significant correction.

We do not know of a better hedging service than Trend Technical Trader (TTT) which is designed to make money in a down market. TTT uses a combination of conservative and aggressive strategies to position subscribers to profit in a declining market. These TTT trades are simple to action, the same as any trade recommended in Trend Letter. We are offering a subscription to TTT for only $399.95 (regular price is $649.95). Click Here to take advantage of this offer. It’s your money – take control.

Stay tuned!

October 11/18

We follow the trends and capital flows. Remember, this is a global market, it is all connected.

Stocks

In yesterday’s update we showed how the S&P 500 dropped a whopping 94.66 points or 3.29% and in doing so blasted through its 2825 support level.  We also noted the NASDAQ fell a massive 4.1%, the largest decline of the year. We further highlighted how the 200-day MA for the S&P 500 was a key support level and that we needed to watch to see if it would  hold.

Well today the S&P 500 lost another 57 points or 2.06%. Interesting that the NASDAQ, the big loser yesterday, lost “just” 1.3%. What we want to keep an eye on is that 200-day MA (blue line).  As we can see on the 2-year chart, the S&P 500 had tested this level three times (red arrows) but today is the first time that the S&P 500 has closed below its 200-day MA. Typically during bull markets, stocks trade above the 200-day MA, while in bear markets they trade below it.

We now need to see if this is the start of a deep correction, even a crash, or if it is simply an overshoot of support. If we look at the bottom portion of the chart we can see that the Relative Strength Index (RSI) is now at 17.66 and whenever it is below 30 it is considered oversold, suggesting that the S&P 500 could soon rally back above its 200-day MA.

There is no end to the opinions as to why the markets are being hit so hard here. Be it the recent jump in interest rates, trade concerns, computer algorithmic trading, issues in Italy, and let’s not forget politics, as the US election is fast approaching.  Whatever the opinions, we just watch the numbers.

Key levels we need to watch here for the S&P 500:

  • Near-term Support at 2717
  • Next Support level at 2700
  • Near-term Resistance at 2775

The S&P 500 needs to close tomorrow above 2717 to signal we could be near the bottom of this correction. If 2717, then 2700 are breached, then a deeper correction is in the cards.

Bonds

Yesterday we noted that “Typically, when we see a big sell-off in the stock markets, capital flows into bonds, driving up bond prices and pushing yields lower. That did not happen today!

Today, we did see capital move into bonds, which pushed yields lower. The US 10-year is now pushing up against its near-term downtrend line. IF equities continue lower, we would expect to see bonds continue to push higher, meaning yields lower.

bonds1011

Gold

Yesterday we also highlighted how gold is typically a go-to ‘safe haven’ play when we see deep market declines, but that was not the case yesterday. Well today gold finally got some love and jumped 34.20 or 2.87% for the day.

gold1011

Cryptos

While gold was a big ‘safe haven’ play, there was virtually no reaction from the crypto currencies as Bitcoin actually moved lower today.

There are tons of opinions out there, but we will continue to let the markets tell us which of these sectors will rise, and which will fall.

Quick Note: We have had a lot of inquiries asking how can investors protect themselves from significant market corrections or crashes. While The Trend Letter uses basic insurance for a correction, note that our hedging service Trend Technical Trader (TTT) is designed to make money in a down market. Its 4 recent hedge positions are up 37% (opened Oct 4/18), 33.5% (opened Oct 4/18), 33% (opened Sept 12/18), and 16.4% (opened Sept 5/18). These TTT trades are simple to action, just the same as any trade recommended in  Trend Letter. We are offering a subscription to TTT for only $399.95 (regular price is $649.95). Click Here to get that price. It’s your money – take control.

Stay tuned!

October 10/18

We follow the trends and capital flows. Remember, this is a global market, it is all connected.

In our Sunday issue of The Trend Letter we posted the following chart highlighting how the S&P 500 had broken below immediate support (yellow highlighted area) and warned that a break below 2825 (green line) would open the door for a deeper correction.

Well, today the S&P 500 dropped a whopping 94.66 points or 3.29% and in doing so blasted through that 2825 support level.  Note, the NASDAQ fell a massive 4.1%, the largest decline of the year. The 200-day MA for the S&P 500 (lower green line) is a key support level, so we will watch to see if it holds. It is currently at 2765.51.

SPX1010

A key reason for this sell-off is the rising interest rates. After a decade of global central banks artificially keeping interest rates low (even negative), rates are starting to rise. Typically, when we see a big sell-off in the stock markets, capital flows into bonds, driving up bond prices and pushing yields lower. That did not happen today!

As we can see, for the last couple of weeks, both the S&P 500 and the US 10-year bonds have been falling.

BondsVsSPX

What about gold, that other ‘safe haven’ play? Similar story, gold has been absolutely hated by investors, and cannot seem to get any momentum, even with a massive equity market sell-off. Should we see this correction in the equities accelerate, watch for gold to rally.

Gold1010

Not even crypto currencies could catch a bid with the equity market sell-off. Bitcoin was flat today and even showed some selling in the last hour.

Bitcoin1010

There are tons of opinions out there, but we will continue to let the markets tell us which of these sectors will rise, and which will fall.

Trend Letter subscribers, be sure to check your inbox for a new position today.

Stay tuned!

MoneyTalks radio interview with Trend Letter founder Martin Straith

No matter what your opinion of Donald Trump the person, that administration’s policy of reduced business taxes and regulations are very good for US businesses. Compare that to what we have in Canada and the EU.”

The Trend Letter founder and editor Martin Straith joins Michael to discuss what this divergence in policy means for investors – and more importantly, the specific markets that will benefit.

The interview with Martin starts at 17:30. Click Here to listen in.

In the interview Martin offered MoneyTalks listeners a Special Offer, and will donate $50 each to Kids Help Phone & Special Olympics for every new subscription. Here is the Special Offer:

All 3 services for only $999.95 per year Subscribe

The Trend Letter = $599.95 $399.95 per year  Subscribe

Great track record dating back to 2002, a weekly publication covering global bonds, currencies, equities, commodities, & precious metals

Trend Technical Trader = $649.95 $399.95 per year Subscribe

A premier hedging service designed to profit in a declining market. Includes our proprietary Gold Technical Indicator (GTI)

Trend Disruptors = $699.95 $399.95 per year Subscribe

A service for investors seeking to invest in advanced, unproven technology stocks on the cheap, with the objective to sell them when masses finally catch on. Covering Artificial Intelligence (AI), Virtual Reality (VR), Augmented Reality (AR), 5G & many more

If you have any questions, send us a note at info@thetrendletter.com.

Trend News Team

Stock Market ‘Red Flag’ close to being triggered

This bull market in stocks is still very much alive, and we are even anticipating a powerful run or ‘melt-up’ before it is all over. But after this big ‘melt up’ we expect that we will have a ‘melt down’.

Whether our prediction of a melt-up is true or not, the next question is when does this nearly 10-year bull market end? One of the key indicators that we trust to tell us when this powerful stock market bull run will end is if we see an ‘inverted yield curve.’

Typically, long-term interest rates are higher than short-term rates, which makes sense the longer someone owes you money, the greater risk  that you won’t be paid back in full increases the further out in time you agree to lend.  Meaning that all things being equal, your risk is much lower when lending for 3-months versus 10 years.

But on occasion when the Federal Reserve wants to slow the economy down, they push short-term rates higher than long-term rates. When that happens, we have what’s called an inverted yield curve. History shows that every stock market top over the past 40 years has been preceded by an inverted yield curve, so when it happens, we must pay attention.

An inverted yield curve is a leading indicator, meaning that the stock market top does not happen right after the yield curve inverts. Typically, the market crash starts 12-18 months after the yield curve becomes inverted. The two most recent time we saw an inverted yield curve in was in 1999 before the DOT COM crash in 2000 top and 2006 before the global financial crisis in 2008.

Today, the spread between US 2-year & 10-year yields is just .27% and is threatening to invert very soon.

yield_curve0922

If we see the yield curve invert in the next few months, we could then expect to see a serious market crash or correction 12-18 months later.

Given that the yield curve has not yet inverted we could have at least another year before the ultimate end of this bull market. If the yield curve inverts in the next few months, we should see the  end of the bull market sometime in 2020/2021. When the melt-down starts, it could be the nastiest of our lifetime, worse that 2008.

All investors need to start planning so they have an exit strategy for when the market has a significant decline…we can discuss how to do that later. The coming bear market crash may not be imminent, but it is coming.

Do you have a strategy to protect your wealth when the melt-down comes? Seriously consider subscribing to Trend Technical Trader, which is a hedge service designed to not just protect you in a melt-down, but to allow you to profit from a melt-down.

Stay tuned!

Global Market Update – September 5/18

To be a successful investor today you must understand what is happening in the markets globally, one cannot simply look at what is happening domestically. Capital flows out of perceived risky areas, and into perceived safer areas.  The current perceived risky area is the emerging market debt, and in particular, emerging market debt denominated in $US.  This is a theme that subscribers to The Trend Letter are well aware of, and one that could well be the start of the global debt crisis that we have have warned about for a couple of years now. We recently posted a blog on this issue which you can read here.

When viewing the following charts, note how it is only US equities, and the US dollar that are in uptrends.

Global Equity Markets

Asia

The Asian markets opened first and sold off on light volume, as concerns continue to grow over US dollar denominated debt in emerging market countries.

Shanghai was down 1.68% on light volume. Down 24% since January

The Japanese Nikkei was also down, but only .82%. Down 9% since January.

Nikk0905

Europe

European markets were the next to open and they too felt the tension over emerging market debt, as well as trade concerns. The UK FTSE, German DAX, Italian MIB, Spanish IBEX, were all down about 1%, but the French CAC lead the decline at -1.57%. CAC down 6.7% this year.

CAC0905

Turkey saw its stock market drop .43% today, and is down about 24% this year.

Turkey XU-100

North America

North American stocks were mixed today, with the Dow Industrials up slightly by .09%, but remains in a solid uptrend, up 19.4% year over year.

Dow0905

The S&P 500 was down slightly by .28% for the day, but is also in a strong uptrend, up 17.5% year over year.

S&P0905

The Nasdaq was the big loser in the US, down 1.16% with Netflix leading the decline, down over 6% on the day. Tech stocks have been the biggest gainers, up 25.7% in a year. But they will also take the biggest fall in a correction.

Nasdaq00905

Global Currencies

US dollar was down slightly on the day. Expect the $US to remain strong against most currencies for the foreseeable future.

 USD

Euro struggling to gain traction. We expect the Euro to go into crisis mode in the next year.

Japanese Yen can be a ‘safe haven’ play, but concerns over Japanese debt is well founded. Ultimately, the Yen will decline steeply.

British Pound will continue to struggle with BREXIT noise.  We are bearish long-term.

Pound0905

Canadian dollar heavily impacted by NAFTA concerns. Will rise when commodities rise.

  Candollar0905

Turkish Lira down over 47% in the last year. Could be the canary in the coal mine regarding emerging market debt crisis.

Turkish Lira

Argentine Peso down 56% in the last year. Another leading candidate for debt default.

ArgPeso

In addition to the very real and legitimate concerns over emerging market debt, we have the coming US elections, and the concerted effort to take down Trump. Whatever one’s feelings are for Trump the person, his policies have been very good for the markets. If Trump goes down, so will the markets. If you don’t have a strategy to protect yourself in a severe market decline, check out Trend Technical Trader.

Stay tuned!

The selected Optin Cat form doesn't exist.