S&P 500 – November 20/18

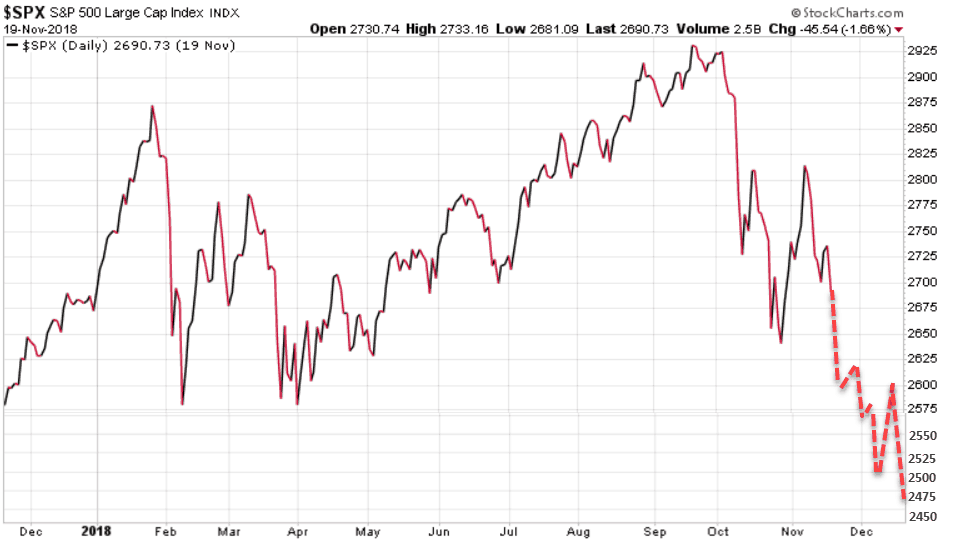
In our November 11/18 issue of the Trend Letter we showed a chart with our model’s bearish projection for the S&P 500 to have a cycle inversion targeting a drop to 2600 and even 2500 by year-end.  With last night’s close of 2690 being sub 2700, we now have the scenario where this 2600 target could be achieved much sooner than year-end, potentially in the next week.

Below is our model’s updated bearish chart. If we do test 2600 in the next week watch for a further decline to test 2500 in early December.  A gap down to 2500 should then trigger a rally back up to 2600, but then look for a double bottom to re-test 2500, and even our initial target low of 2470 by year-end.

We are now short-term bearish and we would need a rally and close this week above 2700 to open the door for a run to test the key resistance at 2830.

Long-term trend is  bullish

Immediate trend is bearish

Our current position is neutral

Stay tuned!

Are you ready for the Third Wave?

Market cycles tend to happen in waves, and technology companies have become a bigger and bigger part of recent market waves.  Since about 1989, many tech companies have pushed their way into the top ranked firms in terms of capitalization, profits, and investment success.  In the early days, it was just IBM and Microsoft.  As internet developments matured there was much more success spread around, with the likes of Bing, Amazon, and Yahoo joining in.  This was the First Wave, and it gave us the internet boom of the 1990’s and those wild boom and bust investments in the technology sector.

The first wave was exciting – a time of over-the-top speculation, but the innovations eventually caught on with consumers, in a very big way, and profits started to roll in, also in a very big way.  This paved the way for a second wave.

The iPhone was the catalyst and poster child for the Second Wave, as tech companies are all striving to greatly improve their communication networks and the convenience of being constantly “in touch”.  There are also great efforts being made for information to be more convenient, more personal, and more manageable.  Making sense of all the available data is a huge challenge, as there has been a gigantic tidal wave of data produced recently.  IBM estimates that 90% of the data in the world has been produced in the last 2 years, so how do we figure out what to read, what to believe, what to trust?

A part of the solution is to make the data more personal, so that systems get to know you, and vice versa.  Examples include:

  • NEST thermostats that learn when you are home or away, and what temperature you’re comfortable with when you are home
  • Music systems like SPOTIFY and PANDORA that learn your listening preferences and help you discover new music you will probably like
  • Trip planning websites that learn your travel adventure interests and devise specific trip plans just for you
  • GOOGLE Home and Amazon Alexa / Echo devices that interact personally with you and make efforts to help you through your busy day

And then there are all those APPS that help us to manage our day, like UBER , LYFT, Weather Channel, or communicate with others via Snapchat, Instagram, Twitter etc.  All are trying to lessen the effort and worry about everyday tasks, although there is a growing concern about the surrendering, stealing, and mismanagement of such a large amount of our personal information – advertisers, scammers, and governments want more of it every day.  When technology does its job well, users benefit in that they spend less time managing tasks and chores and spend more time doing things they really like.  As the Second Wave matures, innovations come along that assist and support us in decision making, critical thinking (information discernment), and time management.  The Second Wave brings us a plethora of helpers that ease our everyday lives with small and useful touches.

So what about the next wave – The Third Wave? We are now seeing this wave starting to form.  Each wave starts with an innovative catalyst, leading to more innovation, speculation, and investment opportunities.  There will be winners and losers along the way, but when the wave breaks, huge profits will be made by those who have the best information and analysis.  A possible catalyst for starting this Third Wave is Augmented Reality (AR), with innovations that could transcend the iPhone and all Smartphones, making them obsolete.  AR is different than Virtual Reality (VR) in that AR overlays graphics and images on top of the real world around you, something like the Pokemon Go game that became wildly popular on Smartphones a few years ago.  AR is also the technology that fighter pilots use for the Heads-Up-Displays (HUD) in the cockpit of their jet fighters.  If you put advanced AR capability into a pair of glasses, with voice, gesture, or eye movement controls, then every current Smartphone capability could be accomplished with a pair of glasses.  Google glasses first appeared in 2013 and the project morphed into Google Glass Enterprise in 2017.  Recently, a highly valued private company, Magic Leap, released an AR headset called Magic Leap One. These are first generation devices and have yet to achieve significant consumer adoption. Much like waves One and Two, Third Wave innovations can sound like science fiction, but we tend to always underestimate the speed of progress and the depth of amazing ideas and devices that are bound to change our lives.

The Trend Disruptors team analyzes new technologies and identifies the companies that stand out in terms of investment potential.  These companies may be large or small.  The best and most promising generate Trend Disruptors Premium recommendations.  We are watching a broad range of companies and technologies, all striving to disrupt specific market segments and/or be part of the next wave.

Let Trend Disruptors be your guide to the future, as we continue to identify technology investment opportunities that can lead to financial success. Subscribe today for just $599.95  $399.95, a $200 savings. Click Here to subscribe at this special rate.

Stay Tuned!

S&P 500 and Gold

S&P 500:

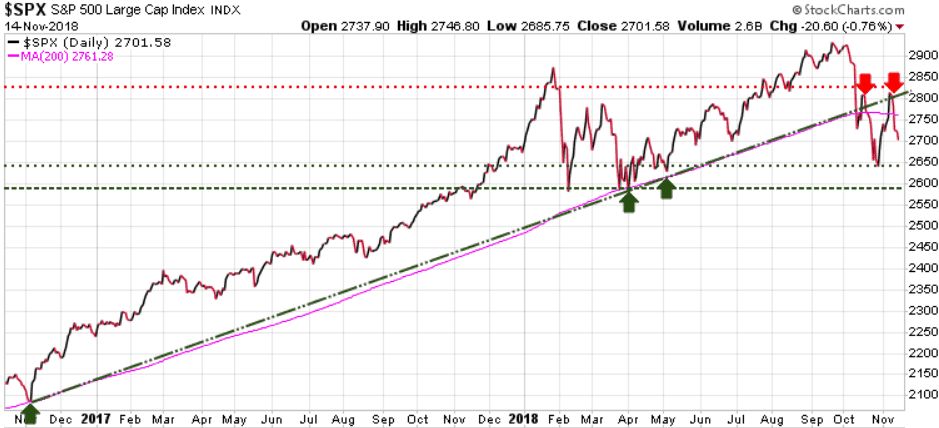
Another wild day in the equity markets with the S&P hitting a high of 2746.80, then hitting a low of 2685.75, before closing at 2701.58. As we warned in Sunday’s issue of the Trend Letter, instead of a year-end rally we could see a cycle inversion if the S&P cannot push through the 2830 resistance level. In Sunday’s Trend Letter we showed a chart of a bearish scenario with a test of 2600 in December, and a potential low of 2475 before year-end.

The S&P has fallen below both its uptrend line (green diagonal) and its 200-day MA (pink line),

spx1114

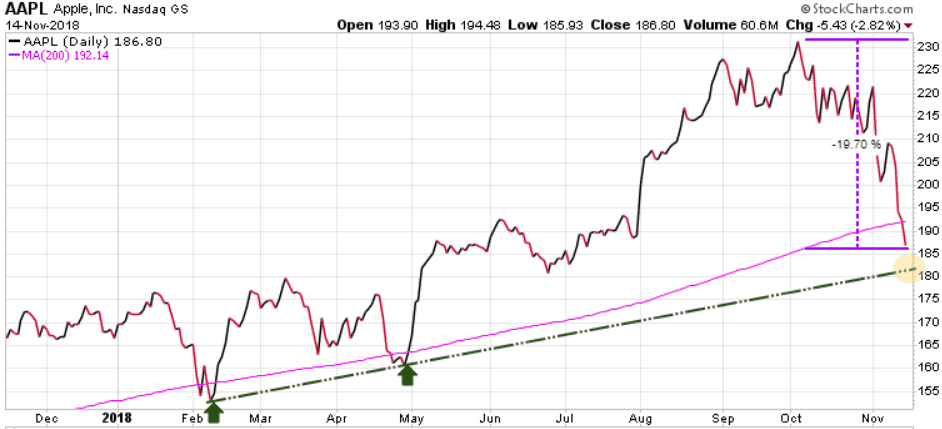
One of the negative drivers was that Apple has now dropped below its 200-day MA and is down almost 20% since its high in October. Tech stocks which have been the darlings of the bull market are being sold-off and are leading the way down. Apple has Key Support at 182, its uptrend line (yellow shaded area).

AAPL1114

S&P 500 trends:

Long-term trend is bullish

Immediate trend is bearish

Our current position is neutral

Gold:

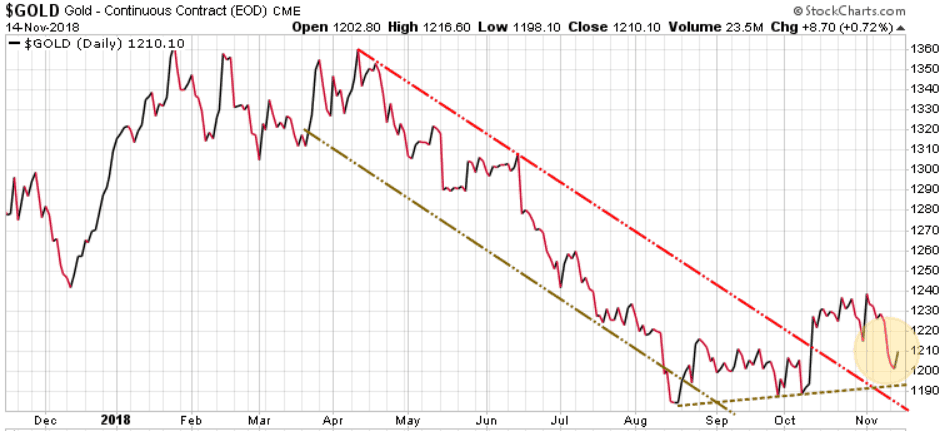
Gold was finally able to have an up-day closing up 8.70 after declining all through November.

Gold1114

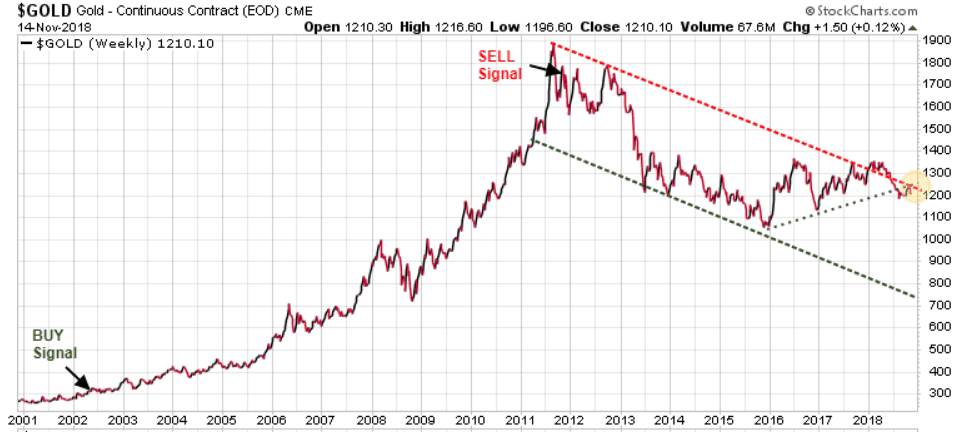
In our very first issue of the Trend Letter in 2002 we recommended buying gold when it was trading at 290. We rode that bull market all the way up to August 2011 when it hit our SELL Stop at just under 1800, a  500% gain. Since then gold has been in a 7+year downtrend channel.

Goldlong1114

So what happened? After the peak in 2011, after years of decline, investors got tired of waiting for gold to rebound, to the point where today gold is hated by the investment community. Over the past month based on the Commitment of Trader (COT) data, gold is oversold to an extreme. It means that future traders are massively pessimistic on gold and even more so on silver. As contrarians will love these scenarios because at the extremes futures traders often get it wrong.  When these speculative traders all bet in one direction, the opposite usually occurs. This opens a scenario where we could see a very good run for gold, silver, and other precious metals.

But understand, while we are looking for gold to have a good run up here, we do not see this as the ultimate low for gold. So if adding gold or gold stocks at these levels be sure to determine your SELL Stops to protect yourself in case this expected rally does not materialize, or does not last long. Gold must push through 1370 before we even consider a long-term rally.

Long-term trend is bearish

Immediate trend is neutral

Our current position is buy

Stay tuned!

November 8/18

S&P 500:

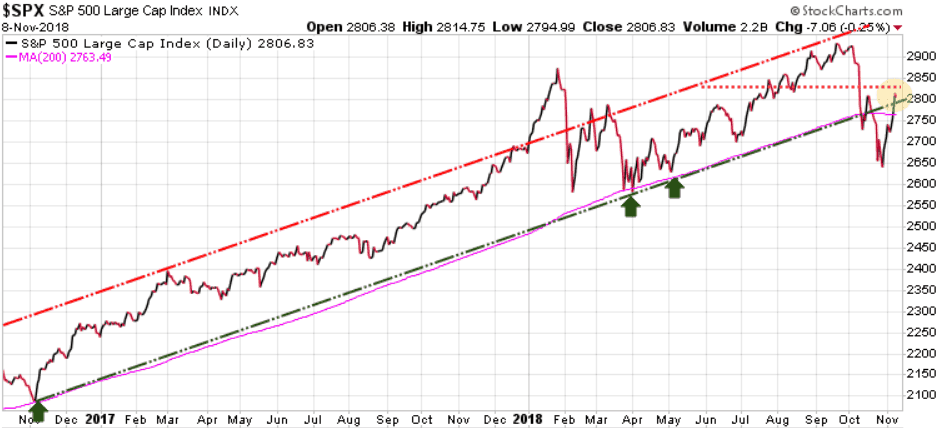
After a huge up day yesterday the S&P 500 consolidated today, closing down 7 points. The S&P is trading above its 200-day MA (pink line) and within its 2-year uptrend channel. The S&P needs to push above the 2830 level by Monday or it re-opens the door for a possible cycle inversion where instead of a rally through to year-end we see a re-test of the 2600 level with a potential challenge down to the 2475-2500 level we discussed in Monday’s blog

Long-term trend is bullish

Immediate trend is bullish

Our current position is neutral

Subscribers to the Trend Letter will get a full update on Sunday.

Stay tuned!

November 7/18

S&P 500:

In Monday’s update we highlighted a potential scenario where depending on the election results we could see a quick drop to test the previous 2600 support level and if that level gave way, black box algorithmic SELL Stops would be triggered, causing a potential spike lower to 2500. We also noted that a quick run to 2800 would diminish the odds of a move to 2500. Fortunately for the bulls, we saw the latter scenario.

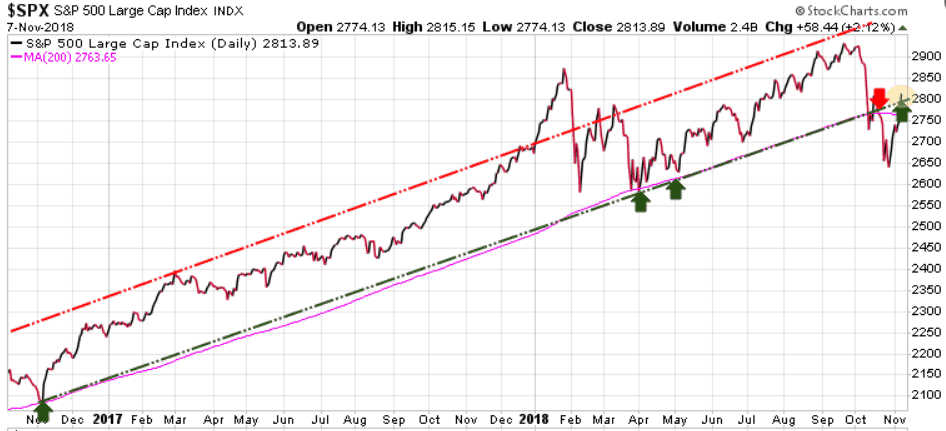
As we can see on the chart below, the S&P closed the day at 2813, an impressive 58.44 point or 2.12% move  higher, putting it back into its 2-year uptrend channel, and above its 200-day MA…bullish action.

spx1107

Long-term trend is bullish

Immediate trend is bullish

Our current position is neutral

Note that the S&P must close above 2830 this week to maintain its immediate bullish trend.

Stay tuned!

Really, the S&P 500 below 2500 this week?

Stocks:

In our October 24th Market Update we stated:

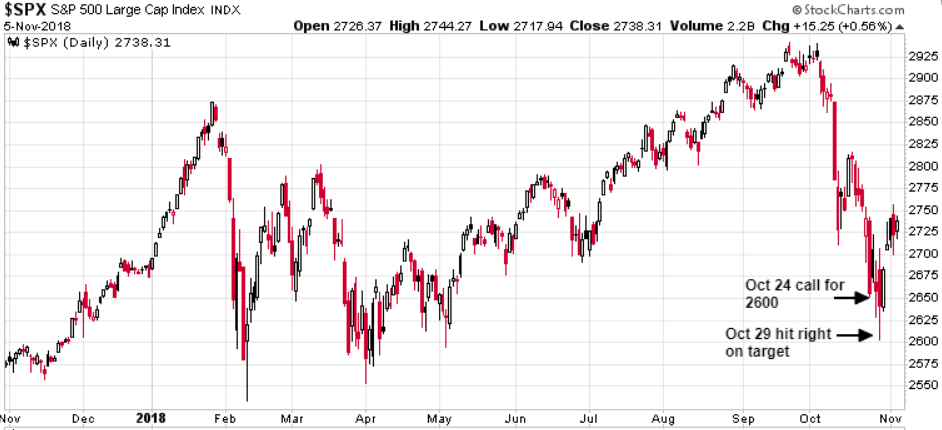
S&P has been trading above its 9+ year uptrend channel, although it has now fallen below the upper level of that channel.  All this action is bearish, suggesting that the S&P will very possibility test the 2600 level.  Given that markets decline much faster than they rise, we could see this support level hit this week

Five days later the S&P hit an intra-day low at 2603, just 3 points from our target.

spx1105

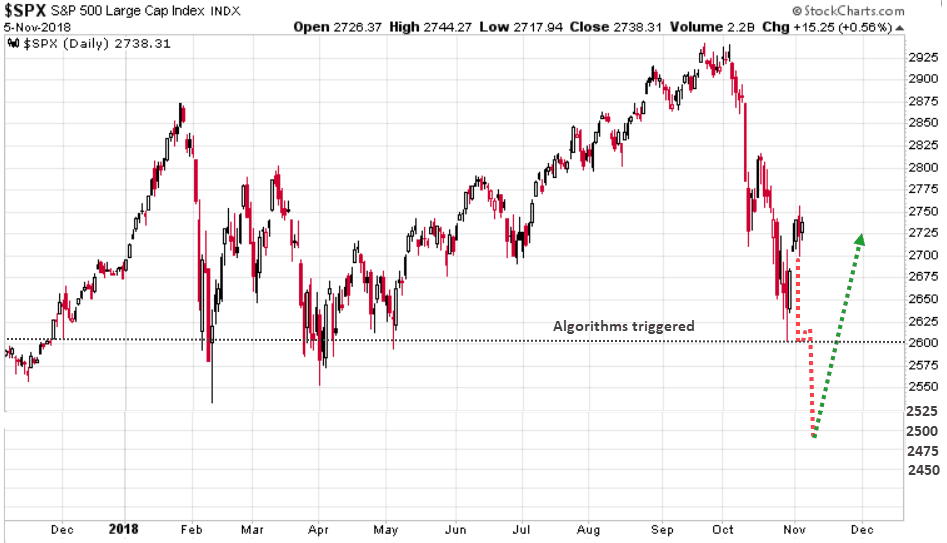
Tomorrow is the US mid-term election and over the next few days we could see some wild action in the markets. Below is one of the scenarios our models are projecting, so be prepared. If the market gets nervous and re-tests the 2600 level, a breach of this level could trigger black box algorithms initiating a series of SELL Stops that could quickly push the S&P down below key support levels at 2535 and 2500.  This scenario would then validate our model’s Feb’18 call for an ultimate low of 2470. If this scenario plays out, the market would be then be extremely oversold opening the door for a significant rally right back through 2600, potentially closing the week close to 2725.

An immediate push through 2800 would diminish the odds of a bearish decline to 2500 target and would signify a likely early resumption of the uptrend.

spx1105altrig

Let’s watch and see how the mid-term elections play out.

————————————————————————————

In the recent market correction Trend Technical Trader (TTT) recommended 4 plays to profit during a market decline. At their peak these plays gained 24%, 46%, 49% & 54% in  less than 2 months. If you would like to subscribe to TTT and have a plan to not just protect yourself during the next market correction or crash, but to actually profit from it, CLICK HERE and receive $250 off the regular price and pay only $399.95

————————————————————————————

Stay tuned!

November 1/18

Stocks:

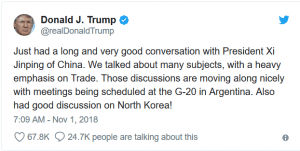
The S&P 500 rallied over 1% for the 3rd straight day for the first time in six weeks after Trump tweeted that he and Xi of China had a good conversation on trade.

TrumpChina

However, in after market trading Apple shares were down up to 7% after it warned that it could miss its December revenue target due to weakness in the emerging markets.

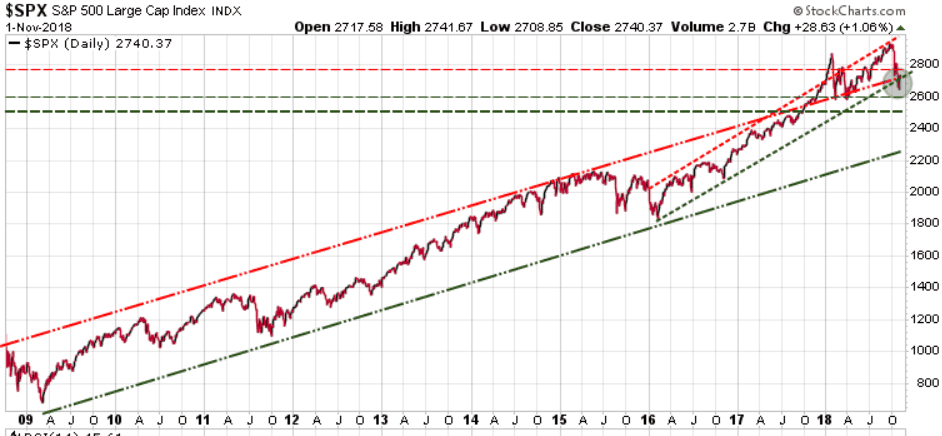
The S&P is now back above its 9+ year uptrend channel (green shaded area). What we are looking for is that 2600 support level to hold. We have resistance at 2770 and if the S&P cannot get up through that resistance level we could see a sharp decline testing 2600.  If 2600 is tested and does not hold, then we have 2580, 2535 and 2500. Our previous long-term projection was after 2930 we would see a sharp correction with a potential low of 2470 – that projection is still valid.

spx1101

There are lots of reasons for the market to drop dramatically and do not underestimate the impact of a Democratic win in the upcoming elections. As investors we do not participate in political discussions other than to say if the markets felt that Trump’s tax and regulation policies were to be rolled back we would see a violent reaction.

Key support levels to watch tomorrow and next week are  27002600, 2580, 2535. Expect a wild ride over the next month.

Long-term trend is bullish

Immediate trend is neutral

Our current position is neutral

Once again we implore every investor to have a hedging or exit strategy.  As an investor you need to be prepared for a serious market correction, or potential crash.  If the recent market action has caused you to lose sleep at night then you are not properly protected.  Now is the time to protect your investments.

If you have not done so already, for each of your positions determine how low you are willing to let them go before selling. Then use SELL Stops and if they are hit, SELL, do not change your mind and talk yourself out of  selling. Or if you do not want to sell for tax or other reasons, use a hedging service like Trend Technical Trader. TTT subscribers who have followed its lead have booked gains of over 40% in a number of trades in just the last 5 or so weeks. If you want to subscribe, we will extend our earlier offer of a $250 discount, meaning you only pay $399.95.

If you had been a TTT subscriber and actioned those trades, they could have covered a decades’ worth of subscriptions. Click here to take advantage of this offer. It’s your money – take control!

Gold:

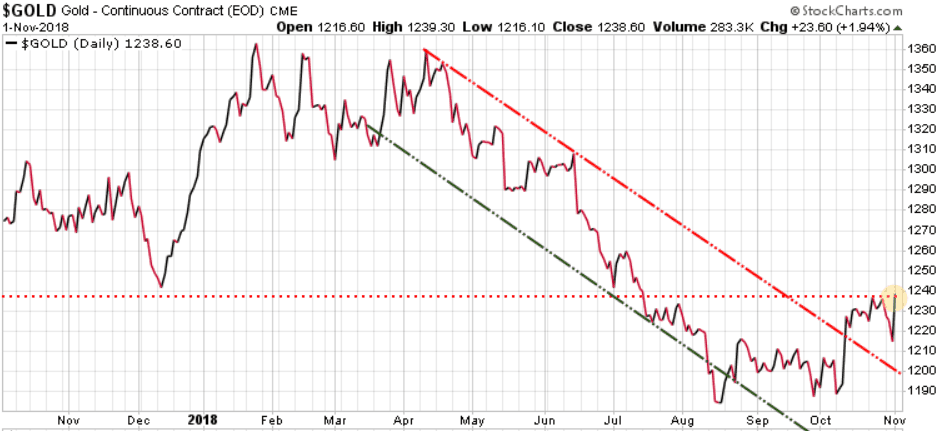
Gold had a solid day gaining 23.60 and closing just above its previous high.  If it can continue higher, 1260 is its next resistance level.

gld1101

Long-term trend is bearish

Immediate trend is bullish

Our current position is bullish

Stay tuned!