Market Charts – February 1/22
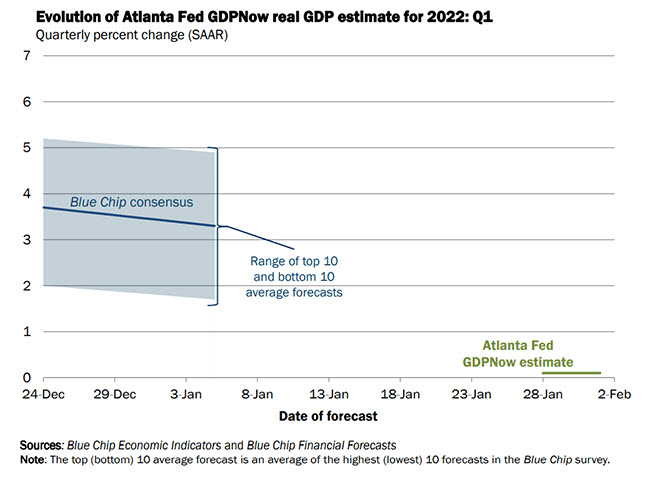
With all the chatter about inflation it is interesting that the Atlanta Fed’s first two forecasts for 2022 call for 0.1% growth, far below what mainstream economists are saying. The Atlanta Fed is unique in that their forecasting method only uses available data, and not projections for future data used by most other economic forecasts.
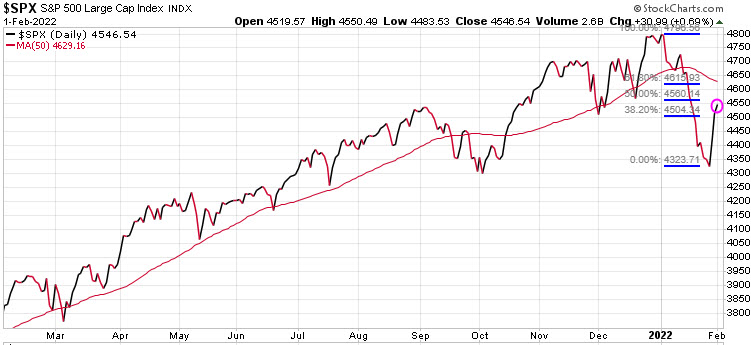
The S&P 500 has rallied off the last Friday’s low so the question is, was that the low or are we just seeing a rally off an oversold bear trend? Typically, after a small correction a retracement of 50%-61% would be normal. The wavy red line on the chart is the 50-DMA and if the S&P 500 can push past that, which also happens to be very close to a 61% retracement, then the bull market could continue. However, if that level holds and the market turns south again, we are likely to see new lows.
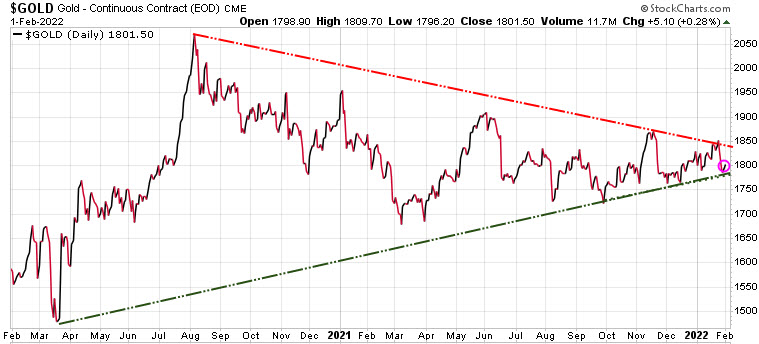
Gold has been in a wedge pattern since August 2020. It has been making painfully slow progress this week but progress it has been. Our models show we could see a rally here over the next few weeks
Stay tuned!