Market Charts – February 2/22
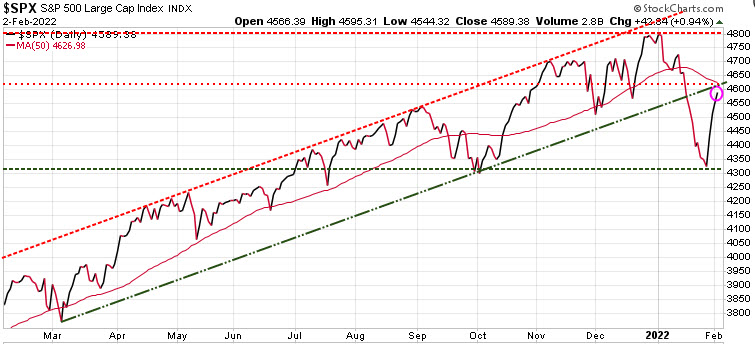
The S&P 500 managed to clock in another solid gain today, its fourth consecutive after the big sell-off in January. Better than expected earnings from Alphabet were the main driving force for today’s gains, but disappointing jobs data and a big earnings miss after the close from Meta (previously Facebook) could cause a setback tomorrow.
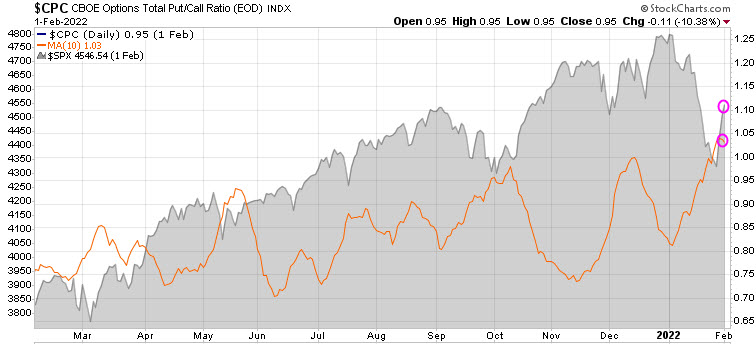
The CBOE put/call ratio tells us what traders are doing with their money and can be a contrarian indicator. The ratio is quite volatile, so we use a 10-DMA to smooth it out (orange line). When this ratio is low it tells us that investors are bullish with a risk-on sentiment, and when it rises, it tells us investors are becoming nervous, more risk averse.
As you can see, it has climbed to a 15-month high, in spite of the recent sharp rally, which suggests that option buyers don’t trust the rally. But given we see it as a contrarian indicator, it suggests that this rally could last longer than most anticipate.
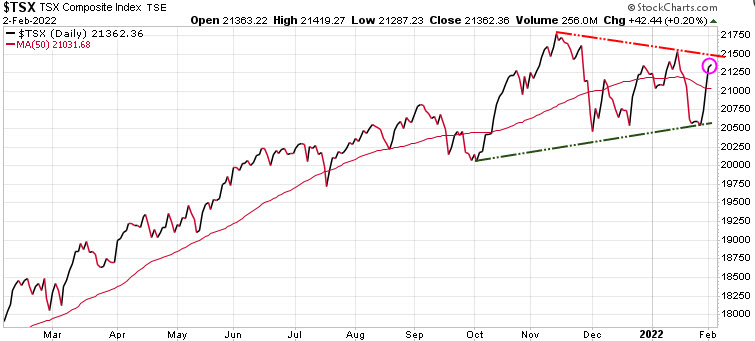
The Canadian TSX has been one of the best performing indexes and as we can see, it has broken through its 50-DMA (red wavy line) and is not too far off its all-time highs.
Stay tuned!