
October 11/18
We follow the trends and capital flows. Remember, this is a global market, it is all connected.
Stocks
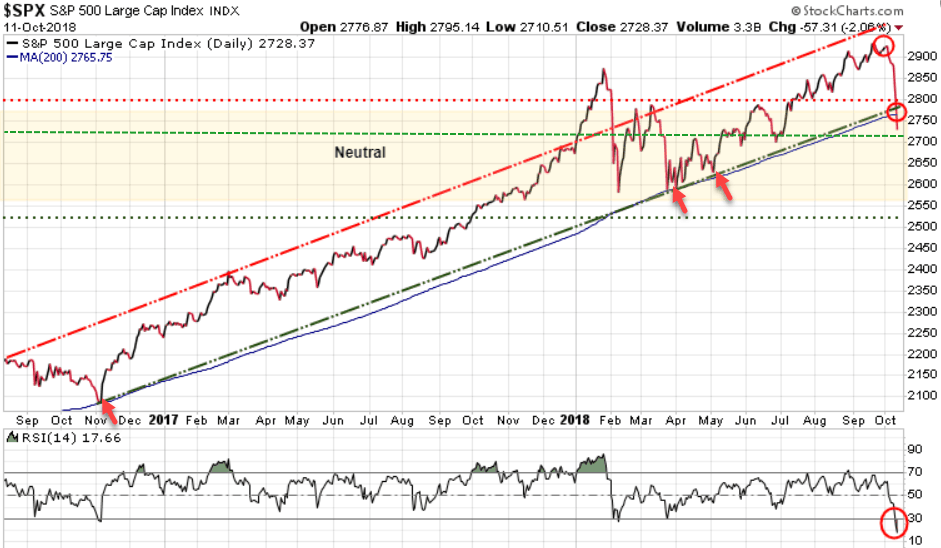
In yesterday’s update we showed how the S&P 500 dropped a whopping 94.66 points or 3.29% and in doing so blasted through its 2825 support level. We also noted the NASDAQ fell a massive 4.1%, the largest decline of the year. We further highlighted how the 200-day MA for the S&P 500 was a key support level and that we needed to watch to see if it would hold.
Well today the S&P 500 lost another 57 points or 2.06%. Interesting that the NASDAQ, the big loser yesterday, lost “just” 1.3%. What we want to keep an eye on is that 200-day MA (blue line). As we can see on the 2-year chart, the S&P 500 had tested this level three times (red arrows) but today is the first time that the S&P 500 has closed below its 200-day MA. Typically during bull markets, stocks trade above the 200-day MA, while in bear markets they trade below it.
We now need to see if this is the start of a deep correction, even a crash, or if it is simply an overshoot of support. If we look at the bottom portion of the chart we can see that the Relative Strength Index (RSI) is now at 17.66 and whenever it is below 30 it is considered oversold, suggesting that the S&P 500 could soon rally back above its 200-day MA.
There is no end to the opinions as to why the markets are being hit so hard here. Be it the recent jump in interest rates, trade concerns, computer algorithmic trading, issues in Italy, and let’s not forget politics, as the US election is fast approaching. Whatever the opinions, we just watch the numbers.
Key levels we need to watch here for the S&P 500:
- Near-term Support at 2717
- Next Support level at 2700
- Near-term Resistance at 2775
The S&P 500 needs to close tomorrow above 2717 to signal we could be near the bottom of this correction. If 2717, then 2700 are breached, then a deeper correction is in the cards.
Bonds
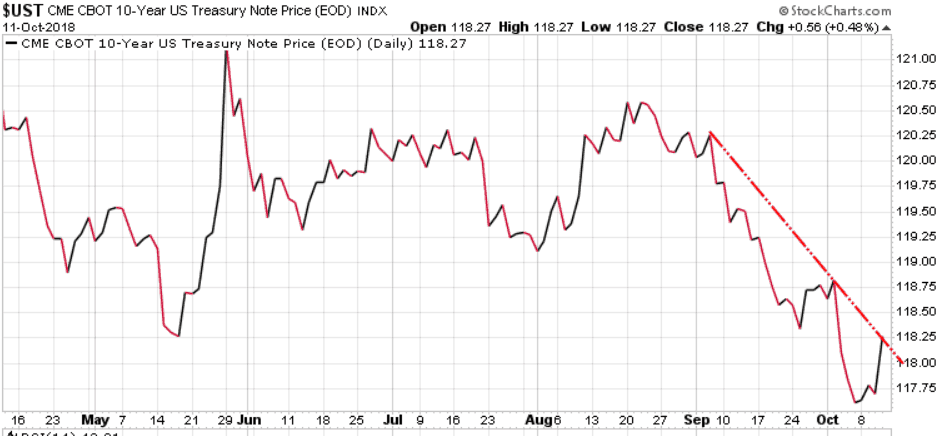
Yesterday we noted that “Typically, when we see a big sell-off in the stock markets, capital flows into bonds, driving up bond prices and pushing yields lower. That did not happen today!“
Today, we did see capital move into bonds, which pushed yields lower. The US 10-year is now pushing up against its near-term downtrend line. IF equities continue lower, we would expect to see bonds continue to push higher, meaning yields lower.
Gold
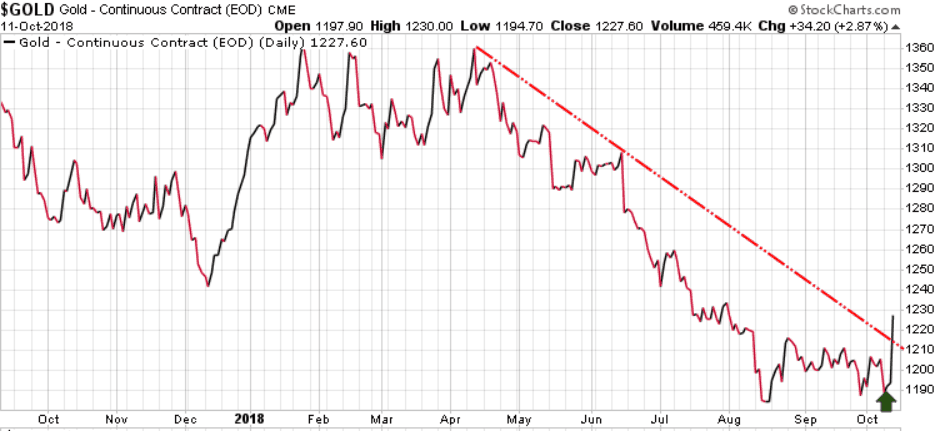
Yesterday we also highlighted how gold is typically a go-to ‘safe haven’ play when we see deep market declines, but that was not the case yesterday. Well today gold finally got some love and jumped 34.20 or 2.87% for the day.
Cryptos
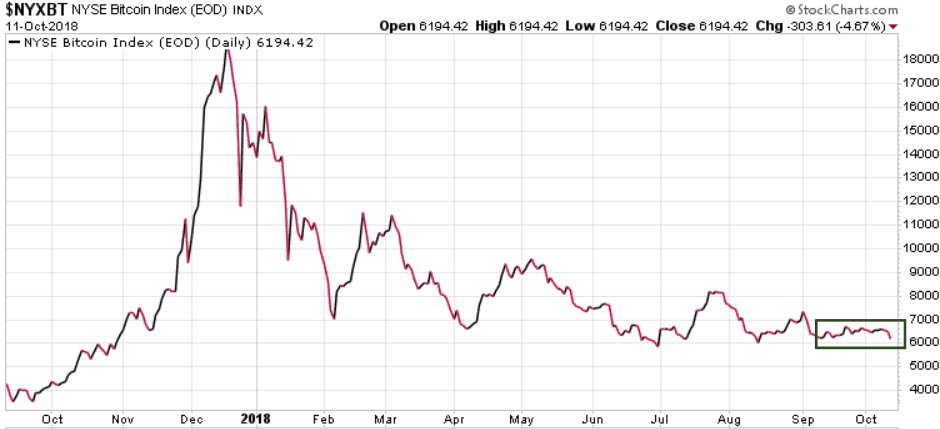
While gold was a big ‘safe haven’ play, there was virtually no reaction from the crypto currencies as Bitcoin actually moved lower today.
There are tons of opinions out there, but we will continue to let the markets tell us which of these sectors will rise, and which will fall.
Quick Note: We have had a lot of inquiries asking how can investors protect themselves from significant market corrections or crashes. While The Trend Letter uses basic insurance for a correction, note that our hedging service Trend Technical Trader (TTT) is designed to make money in a down market. Its 4 recent hedge positions are up 37% (opened Oct 4/18), 33.5% (opened Oct 4/18), 33% (opened Sept 12/18), and 16.4% (opened Sept 5/18). These TTT trades are simple to action, just the same as any trade recommended in Trend Letter. We are offering a subscription to TTT for only $399.95 (regular price is $649.95). Click Here to get that price. It’s your money – take control.
Stay tuned!