Market Notes

Market Charts – February 10/22

Stocks sold off and yields climbed after the Bureau of Labor Statistics’ January Consumer Price Index (CPI) showed the biggest annual jump in inflation since 1982.

The surging 7.5% jump in prices escalated calls for the Federal Reserve to raise interest rates more aggressively than previously expected and begin rolling assets off its balance sheet, in moves that would curb liquidity in the financial system and dampen soaring consumer demand and prices. St. Louis Federal Reserve President James Bullard told Bloomberg News on Thursday he wanted to see interest rates be raised by a full percentage by July and start the Fed’s balance sheet run-off process in the second quarter, in one of the most hawkish paths so far telegraphed by a Fed official.

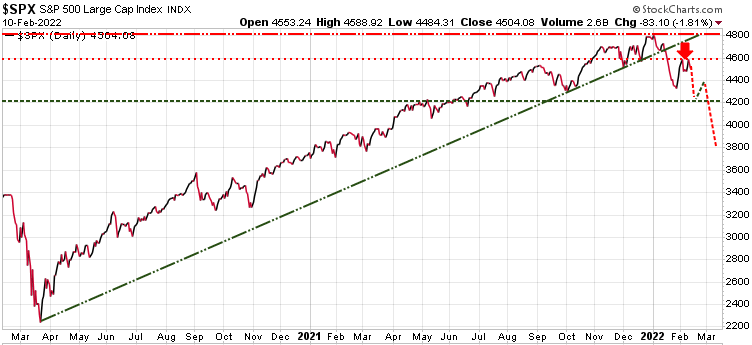
On Tuesday, for the S&P 500 we said ‘Watch the 4600 level as near-term resistance as our model sees this as a key short-term resistance level and if we can’t push past this level we could see the market start to break down with a potential near-term low in the next 6 weeks.’

So far that 4600 has held, so the scenario laid out on Tuesday is still very valid.
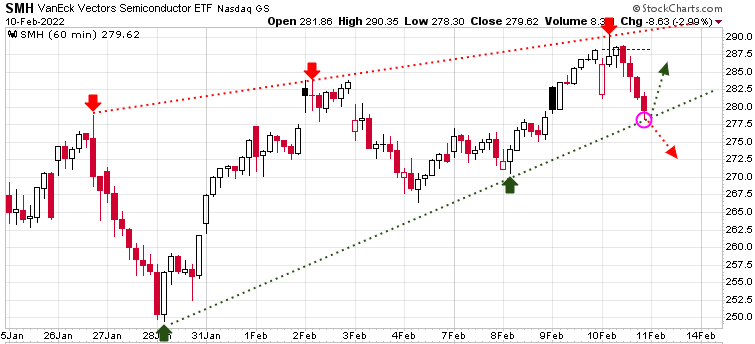
This is a chart of the VanEck Semiconductor ETF and it is suggesting that we are at a potential key inflection point. As we can see, this ETF is in a rising wedge pattern where both the upper level (red lines) and lower level (green lines) have acted a key short-term resistance and support levels. As the wedge narrows, one of these levels is going to give way. We are now testing the lower level, and if it breaks then the high today may have been the top for a few weeks at least.

On the other hand, if SMH bounces off this support level, then we could see one more test of the upper level of the wedge.
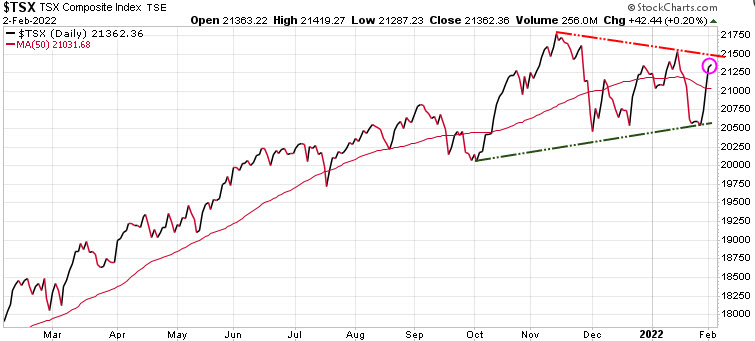
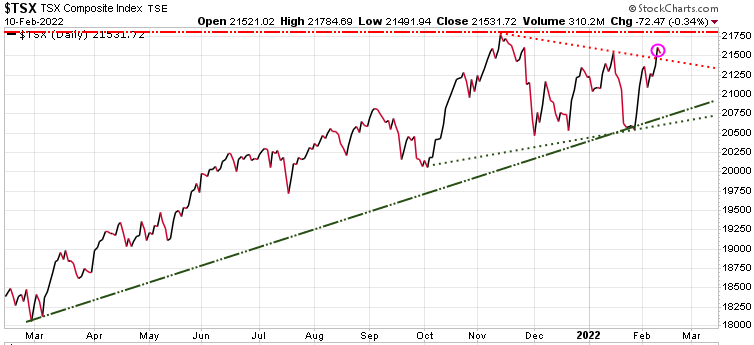
The Canadian TSX has been one of the best performing indexes in the world lately and is within a hair of a new all-time high.
Stay tuned!

Again, if the near-term high is in, seriously think about subscribing to our hedging service Trend Technical Trader. We are offering it at a $300 discount so all investors can have access to these great hedging strategies.

Stay tuned!

Market Notes

Market Charts – February 8/22

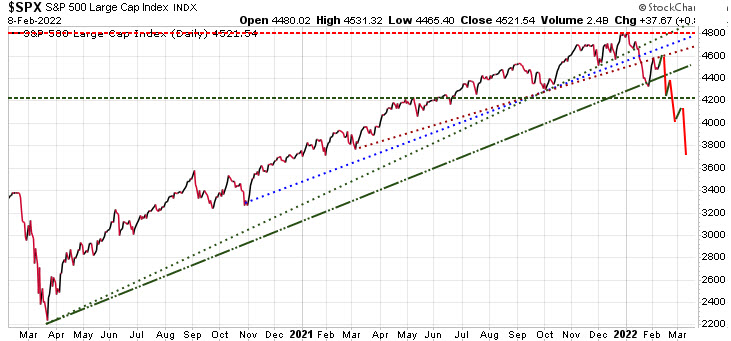
The  S&P 500 was up ~38 points today, but the markets are still quite nervous. Watch the 4600 level as near-term resistance as our model sees this as a key short-term resistance level and if we can’t push past this level  we could see the market start to break down with a potential near-term low in the next 6 weeks.

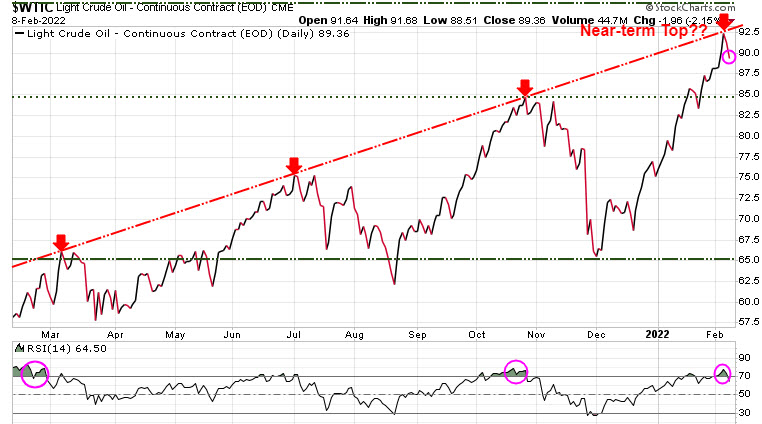
Oil has been on an absolute tear in the last year+ but is now hitting some strong technical resistance. The uptrend line (red diagonal)  has shown to be strong resistance the last three times oil challenged it. Is this a near-term top? It certainly could be.  If so, the first level of support would be 85.00, and then there is a big gap down to 65.00. Any invasion of Ukraine by Russia would negate any correction and most likely give oil a push higher, although much of a potential Russian invasion is already priced in.

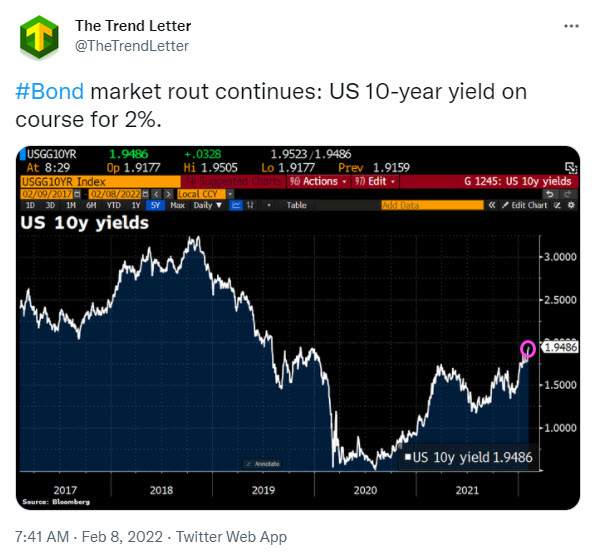
The yield on the benchmark 10-year Treasury is approaching 2%. January 2020 was the last time we saw the 10-year Treasury yields were above 2%. There has  been over $8 trillion of new debt added (government & corporations) since the pandemic. If the 10-year U.S. Treasury yield hits 2%, with the Fed looking to raise rate, investors are likely to get very nervous.

If you are overweight in equities seriously consider subscribing to our premier hedging service, Trend Technical Trader. To ensure all readers have access to this hedge service, we are reducing the price by $300. Click button below to subscribe. It’s your money – take control!

Stay tuned!

Market Notes

Market Charts – February 7/22

Stock turned lower to close a choppy session at the start of another busy week for corporate earnings and fresh economic data, as investors continue to assess the Federal Reserve’s path forward for monetary policy.

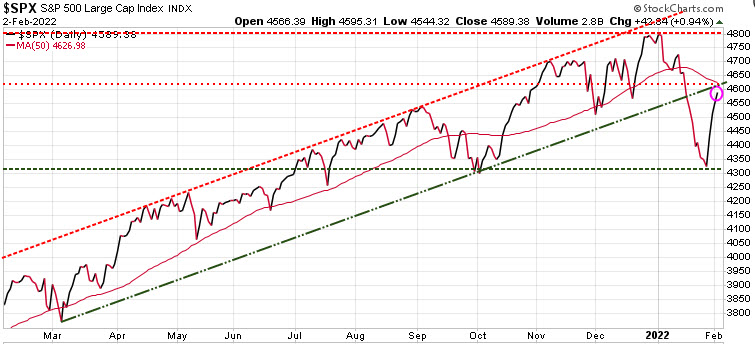
The S&P 500 declined after posting its best weekly rise of the year last week. The Dow traded little changed, and the Nasdaq underperformed as technology shares fell anew.

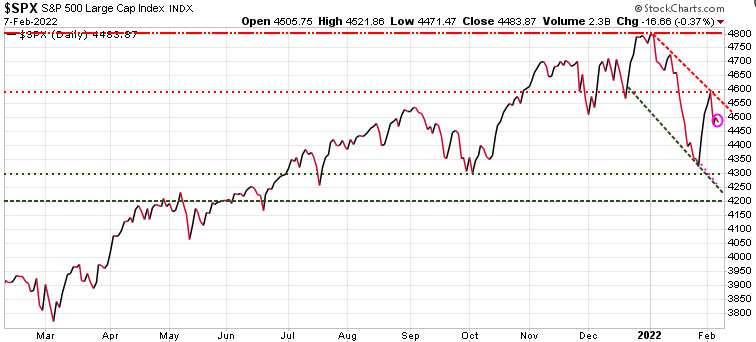
Looking at the S&P 500 chart, we can see that it is in a near-term downtrend channel and needs to break above near-term resistance at 4600 to decisively break out of that channel. Ultimately, the S&P 500 needs to break through to a new high to confirm the resumption of the bull market. Near-term support sits at 4300 and key support is the 4200 level. A break below that 4200 level opens the door for a significant decline.

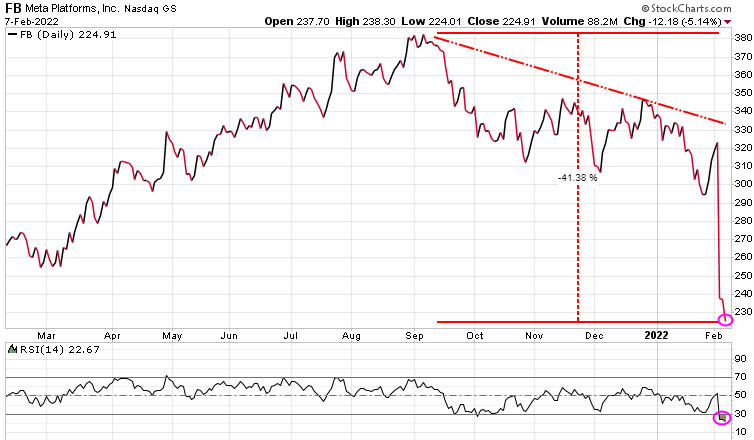
Tech stocks were down led by Meta (Facebook) again. Meta is now down over 41% from its September high.  At the bottom of the chart, we can see that based on RSI, Meta is now oversold. If you are looking to dip your toe in here understand the this is like a falling knife, you need to wait till you see it start to turn higher.

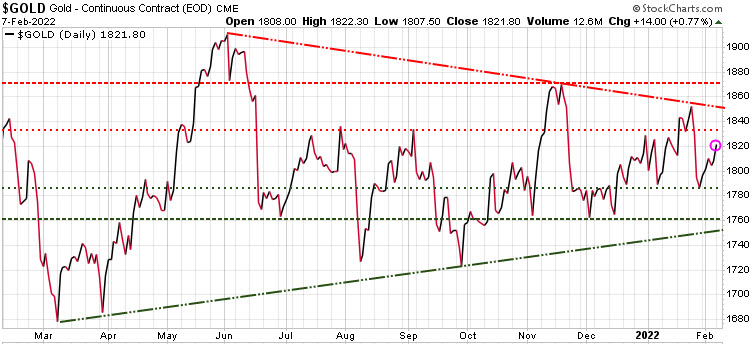
Gold was up 14.00 today, and is slowly trying to work its way to test near-term resistance of 1830, and then key support at 1870. We are in a seasonal period of strength for gold, but it has had a tough time trying to break out of this wedge pattern it has been in since last May.

Note: All investors should have a hedging or exit strategy. If you do not have a hedging strategy seriously consider subscribing to Trend Technical Trader, the best hedging service we know of. To ensure all readers have access to this hedge service, we are reducing the price by $300. Click button below to subscribe. It’s your money – take control!

Stay tuned!

Market Notes

Market Charts – February 2/22

The S&P 500 managed to clock in another solid gain today, its fourth consecutive after the big sell-off in January. Better than expected earnings from Alphabet were the main driving force for today’s gains, but disappointing jobs data and a big earnings miss after the close from Meta (previously Facebook) could cause a setback tomorrow.

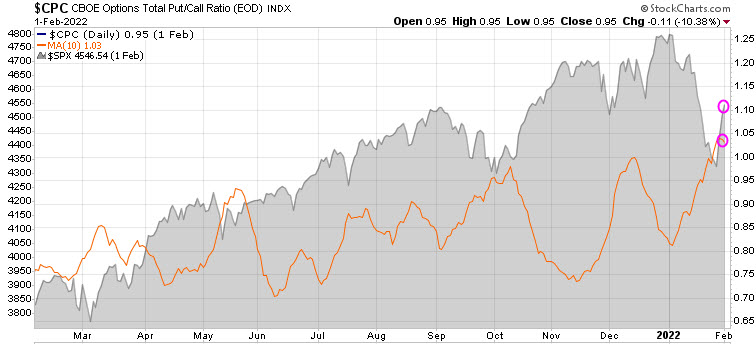
The CBOE put/call ratio tells us what traders are doing with their money and can be a contrarian indicator. The ratio is quite volatile, so we use a 10-DMA to smooth it out (orange line). When this ratio is low it tells us that investors are bullish with a risk-on sentiment, and when it rises, it tells us investors are becoming nervous, more risk averse.

As you can see, it has climbed to a 15-month high, in spite of the recent sharp rally, which suggests that option buyers don’t trust the rally. But given we see it as a contrarian indicator, it suggests that this rally could last longer than most anticipate.

The Canadian TSX has been one of the best performing indexes and as we can see, it has broken through its 50-DMA (red wavy line) and is not too far off its all-time highs.

Stay tuned!


Market Notes

Market Charts – February 1/22

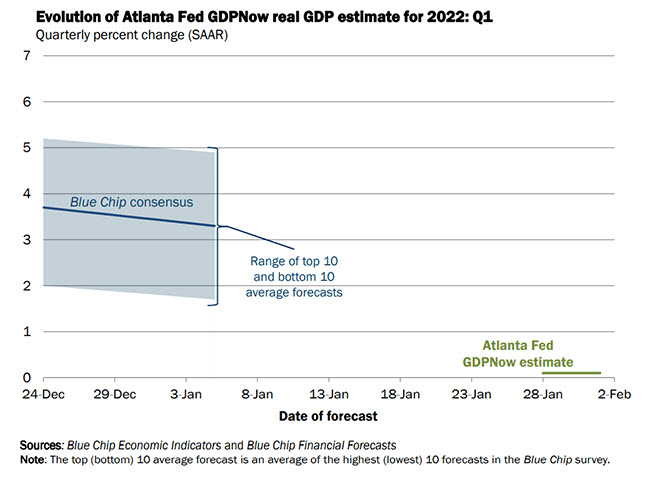
With all the chatter about inflation it is interesting that the Atlanta Fed’s first two forecasts for 2022 call for 0.1% growth, far below what mainstream economists are saying.  The Atlanta Fed is unique in that their forecasting method only uses available data, and not projections for future data used  by most other economic forecasts.

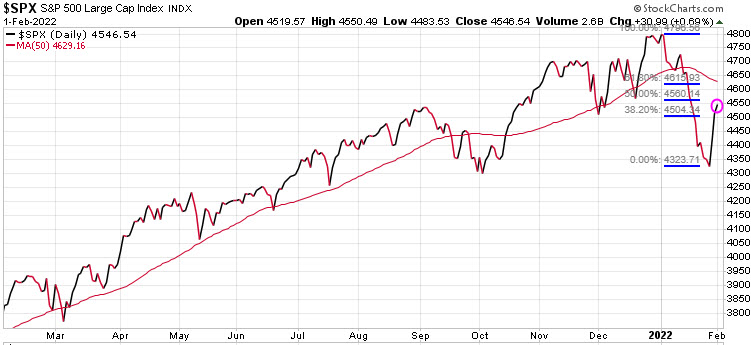
The S&P 500 has rallied off the last Friday’s low so the question is, was that the low or are we just seeing a rally off  an oversold bear trend? Typically, after a small correction a retracement of 50%-61% would be normal. The wavy red line on the chart is the 50-DMA and if the S&P 500 can push past that, which also happens to be very close to a 61% retracement, then the bull market could continue. However, if that level holds and the market turns south again, we are likely to see new lows.

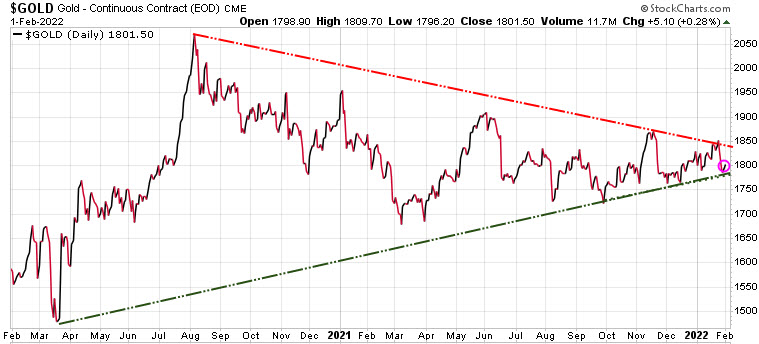
Gold has been in a wedge pattern since August 2020. It has been making painfully slow progress this week but progress it has been. Our models show we could see a rally here over the next few weeks

Stay tuned!