Posts by The Trend Letter

Bill Gates says ‘No’ to sharing vaccine formulas with global poor to end pandemic

Bill Gates, one of the world’s richest men and most powerful philanthropists, was the target of criticism from social justice campaigners on Sunday after arguing that lifting patent protections on COVID-19 vaccine technology and sharing recipes with the world to foster a massive ramp up in manufacturing and distribution—despite a growing international call to do exactly that—is a bad idea.

Directly asked during an interview with Sky News if he thought it “would be helpful” to have vaccine recipes be shared, Gates quickly answered: “No.”

Asked to explain why not, Gates — whose massive fortune as founder of Microsoft relies largely on intellectual property laws that turned his software innovations into tens of billions of dollars in personal wealth — said: “Well, there’s only so many vaccine factories in the world and people are very serious about the safety of vaccines. And so moving something that had never been done — moving a vaccine, say, from a [Johnson & Johnson] factory into a factory in India — it’s novel — it’s only because of our grants and expertise that that can happen at all.”

Contrary to Gate’s claims, there are facilities available to produce hundreds of millions of COVID-19 vaccines. In an industrial neighborhood on the outskirts of Bangladesh’s largest city lies a factory with gleaming new equipment imported from Germany, its immaculate hallways lined with hermetically sealed rooms. It is operating at just a quarter of its capacity.

It is one of three factories that The Associated Press found on three continents whose owners say they could start producing hundreds of millions of COVID-19 vaccines on short notice if only they had the blueprints and technical know-how. But that knowledge belongs to the large pharmaceutical companies who have produced the first three vaccines authorized by countries including Britain, the European Union and the U.S. — Pfizer, Moderna and AstraZeneca. The factories are all still awaiting responses.

Across Africa and Southeast Asia, governments and aid groups, as well as the World Health Organization, are calling on pharmaceutical companies to share their patent information more broadly to meet a yawning global shortfall in a pandemic that already has claimed over 2.5 million lives. Pharmaceutical companies that took taxpayer money from the U.S. or Europe to develop inoculations at unprecedented speed say they are negotiating contracts and exclusive licensing deals with producers on a case-by-case basis because they need to protect their intellectual property and ensure safety.

Read AP article here.


Sell in May ?

Our Forecast Model has targeted the week of May 3/21 as potential high and near-term turning point for the markets, so we need to be on alert. We have been in a 12-year bull market and things are now at a point where a significant correction is not only possible, but to be expected. At the top of any bull market, we tend to see a number of false tops, before the final real one is in place. So we expect to see quite a bit of volatility through the summer.

A $246 billion boom means stock ETF inflows already beat 2020. Record haul in Q1 helps surpass 2020’s $231 billion.

When this market finally tops, and it could be soon, all investors need to be aware of the massive amount of leverage in the markets right now. Investors had borrowed $814 billion against their portfolios as of late February, according to data from the Financial Industry Regulatory Authority (“FINRA”).

Investors obtain margin debt from their brokerages to buy stocks and other securities. The investor puts up the securities he owns as collateral for the loan. During a bull market, margin debt tends to rise, as the value of securities goes up, investors can borrow more money to buy even more securities.

It all works fine, as long as the markets keep rising. But today, margin debt levels are well above just a normal increase. Take a look at the extreme rise in the past year.

When we see this level of borrowing, we need to be cautious. We saw a similar pattern at the end of the 2000 tech bubble crash, and in 2007 just before the financial crisis.

After a major bull market, like the one we are in, ends, the subsequent decline can be very sharp and nasty. The resulting value loss in securities usually triggers ‘margin calls.’ For those investors who borrowed all this money from their brokerages, the value of their accounts drops with the stock prices, so they then need to add more cash to their accounts. If they don’t have enough money to meet the margin calls, their brokerages can liquidate other positions in their accounts to recapture the loans.

So far, stocks have been rocking higher, so this extra leverage is paying off.  But when the markets top out, it could lead to a powerful decline or crash, as all that margin needs to be paid back.

Looking at the market today, we can see that the S&P 500 has been trading in a tight range for the last two weeks. Our model had forecast a temporary high next week at 4200, so today’s close of 4183 leaves us in that ballpark. Now this top could simply be a period of consolidation where it trades sideways for a while. Or it could be a pull back or a more severe correction.


We do not believe at this time that this is the top for this 12-year bull market, but it could be a turning point, where we see a significant pull back or correction. Understand that this massive bull market WILL end, they all do. Be sure you have a plan in place to protect your wealth in the event of a serious market correction. If you need assistance, our Trend Technical Trader service was originally designed as a hedging service, to actually make money on market declines.

We are offering some great discounts to all of our services.  Check the offers below:

 Trend Letter:
Since start-up in 2002 Trend Letter has provided investors with a great track record, giving exceptionally accurate information about where the markets are going, and it has explained in clear, concise language the reasons why. Using unique and comprehensive tools, Trend Letter gives investors a true edge in understanding current market conditions and shows investors how to generate and retain wealth in today’s climate of extreme market volatility.

A weekly publication covering global bonds, currencies, equities, commodities, & precious metals. Over the 20 years Trend Letter has been published, it has achieved an incredible average return of 65% on its closed trades.

Timer Digest says“Trend Letter has been a Timer Digest top performer in our Bond and Gold categories, along with competitive performance for the intermediate-term Stock category.”


Technical Trader:
Trend Technical Trader (TTT) is a premier trading service, designed to profit in both up and down markets. Included is our proprietary Gold Technical Indicator (GTI).

TTT had another excellent year in 2020 averaging +27.3% per closed trade with an average holding time of 9.5 weeks, or +149% annualized overall.

Over the past 5 years TTT’s closed trades have averaged +40% annualized.


Trend Disruptors:
Disruptive technology trends will propel our future and the reality is that no industry will go untouched by this digital transformation. At the root of this transformation is the blurring of boundaries between the physical and virtual worlds. As digital business integrates these worlds through emerging and strategic technologies, entirely new business models are created.

Trend Disruptors is a service for investors seeking to invest in advanced, often unproven technology stocks on the cheap, with the objective to sell them when masses finally catch on. Covering Artificial Intelligence (AI), Virtual Reality (VR), Augmented Reality (AR), 5G, Quantum Computing & many more.

Trend Disruptors has realized average annualized gains of 178% over its 3 years of service.

Special Offers

ServiceRegular PriceSpecial PriceSavingSubscribe
Trend Letter$599.95$399.95$200
Technical Trader$649.95$399.95$250
Trend Disruptors$599.95$399.95$200
Better Deals
Trend Letter + Technical Trader$1249.90$599.95$649.95
Trend Letter + Trend Disruptors$1199.90$599.95$599.95
Technical Trader + Trend Disruptors$1249.90$599.95$649.95
Best Deal
Trend Suite: Trend Letter + Technical Trader + Trend Disruptors$1849.85$799.95$1,049.90


Gold update

Gold gave up another 17.60 on Monday, as it struggles to gain any traction here. Gold has been in a downtrend channel since August and we need to see it break out of the tight trading range it has been in this month. Based on the Relative Strength Index (RSI) gold is not oversold at this point (RSI is highlighted at the bottom of the chart).

Subscribers to the Trend Letter are presented with our various Forecast Models, which are dynamic and are updated at the end of each week. Our Forecast Models calculate both bull and bear scenarios. Below is the updated Model Forecast for gold which was sent to subscribers Sunday.

• In both scenarios there is an immediate decline to the 1640 range, then a rally to 1800 by the end of April.
• The bullish scenario sees a decline to 1640, then a rally up to 1940 by June
• The bearish scenario would see a decline to 1640, then a rally to 1800, which would be the high, and then see a prolonged decline into early 2022

If you are not a subscriber to the Trend Letter, we are offering some great discounts to all of our services.  Check the offers below:

 Trend Letter:
Since start-up in 2002 Trend Letter has provided investors with a great track record, giving exceptionally accurate information about where the markets are going, and it has explained in clear, concise language the reasons why. Using unique and comprehensive tools, Trend Letter gives investors a true edge in understanding current market conditions and shows investors how to generate and retain wealth in today’s climate of extreme market volatility.

A weekly publication covering global bonds, currencies, equities, commodities, & precious metals. Over the 20 years Trend Letter has been published, it has achieved an incredible average return of 65% on its closed trades.

Timer Digest says“Trend Letter has been a Timer Digest top performer in our Bond and Gold categories, along with competitive performance for the intermediate-term Stock category.”


Technical Trader:
Trend Technical Trader (TTT) is a premier trading service, designed to profit in both up and down markets. Included is our proprietary Gold Technical Indicator (GTI).

TTT had another excellent year in 2020 averaging +27.3% per closed trade with an average holding time of 9.5 weeks, or +149% annualized overall.

Over the past 5 years TTT’s closed trades have averaged +40% annualized.


Trend Disruptors:
Disruptive technology trends will propel our future and the reality is that no industry will go untouched by this digital transformation. At the root of this transformation is the blurring of boundaries between the physical and virtual worlds. As digital business integrates these worlds through emerging and strategic technologies, entirely new business models are created.

Trend Disruptors is a service for investors seeking to invest in advanced, often unproven technology stocks on the cheap, with the objective to sell them when masses finally catch on. Covering Artificial Intelligence (AI), Virtual Reality (VR), Augmented Reality (AR), 5G, Quantum Computing & many more.

Trend Disruptors has realized average annualized gains of 178% over its 3 years years of service.

Special Offers

ServiceRegular PriceSpecial PriceSavingSubscribe
Trend Letter$599.95$399.95$200
Technical Trader$649.95$399.95$250
Trend Disruptors$599.95$399.95$200
Better Deals
Trend Letter + Technical Trader$1249.90$599.95$649.95
Trend Letter + Trend Disruptors$1199.90$599.95$599.95
Technical Trader + Trend Disruptors$1249.90$599.95$649.95
Best Deal
Trend Suite: Trend Letter + Technical Trader + Trend Disruptors$1849.85$799.95$1,049.90


Market Notes

Potential temp high

The S&P 500 rose on Wednesday and the blue-chip Dow hit a record high after tepid consumer price data for February calmed inflation worries and Congress gave final approval to one of the largest economic stimulus measures in US history. Investors paid little attention to the Treasury Department posting the latest deficit numbers which showed the US ran a $1 trillion deficit from October through February, compared with $624 billion during the same period a year earlier. Federal outlays totaled $2.5 trillion, a 25% increase, while total receipts rose 5% to $1.4 trillion, both record amounts for that period.

Today, the S&P 500 closed at 3898.81, up 23.37 points for the day or .60%.


For the last couple of weeks, the Trend Letter Forecast Model  has been signaling we may be approaching a temp high for the S&P 500 sometime next week.  The target high is 4000-4020 and if indeed we do see a reversal at that level we could see two-month decline to the targeted level of 3150 in mid-May. If this plays out as forecasted, we could  get a BUY Signal in May.

Understand, this is a dynamic model and is updated at the close of each week. If we do not see a high next week, the model will then adjust and create an updated forecast at the end of next week.

If you are not currently a subscriber, but are interested in our services, we are offering some great Special Rates. For an overview of each service and the special pricing options being offered, click the button below.


Market Notes

Market Update – March 4/21

Markets continued their decline today after Federal Reserve Chairman Jerome Powell said that as the national economy begins to reopen, “we will see inflation move up through base effects. That could create some upward pressure on prices.” While the Fed is expecting some inflation, Powell said he does not expect to raise interest rates this year until employment and inflation are back to sustainable levels.
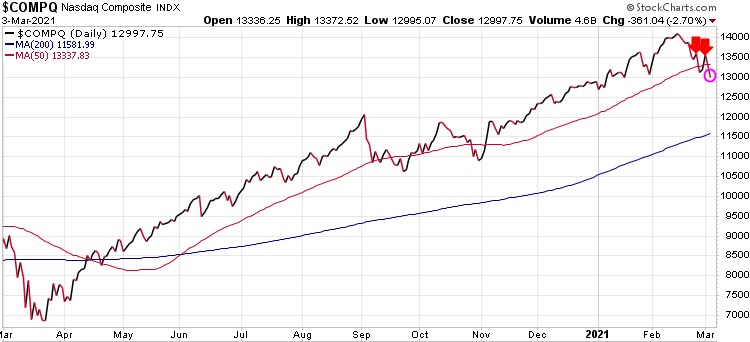
Nasdaq

Another big down day for the markets, with the techs again leading the way down. The Nasdaq dropped another 274 points or 2.11% today  and is now trading down 164 points for the calendar year. After breaking below its 50-DMA yesterday (red wavy line), the Nasdaq has now breached its uptrend line (green diagonal line) dating back a year ago.
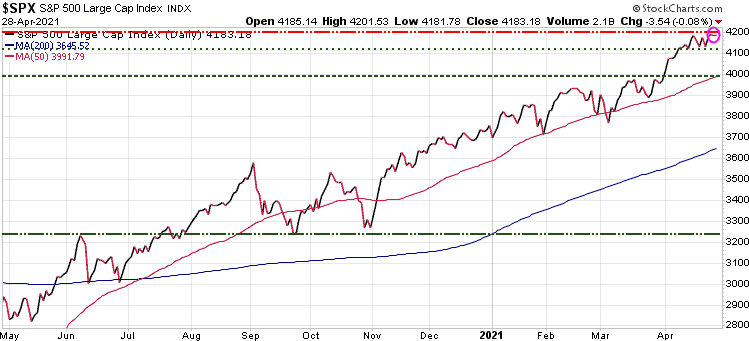
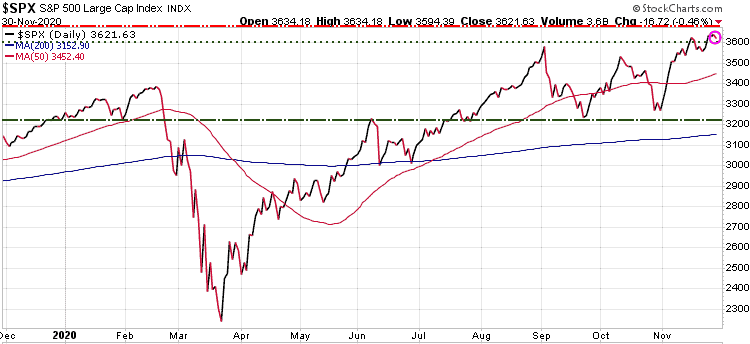
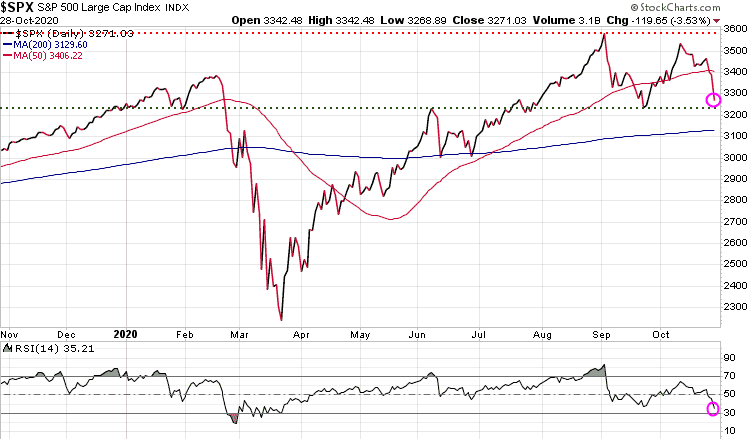
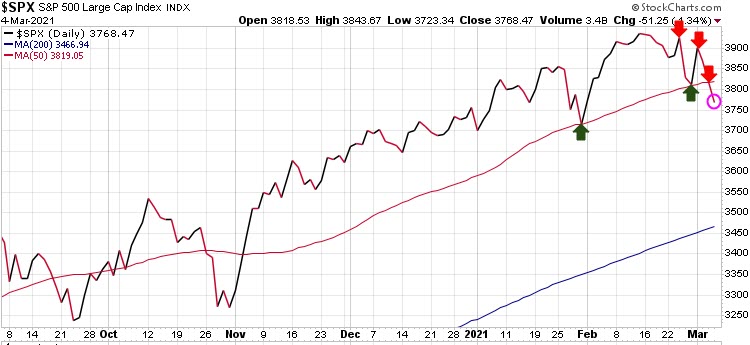
S&P 500

The S&P 500 lost another 51.25 points today or 1.34%. The S&P 500 broke below its 50-DMA today, which had acted as a strong support level when tested late January and late February (green arrows).

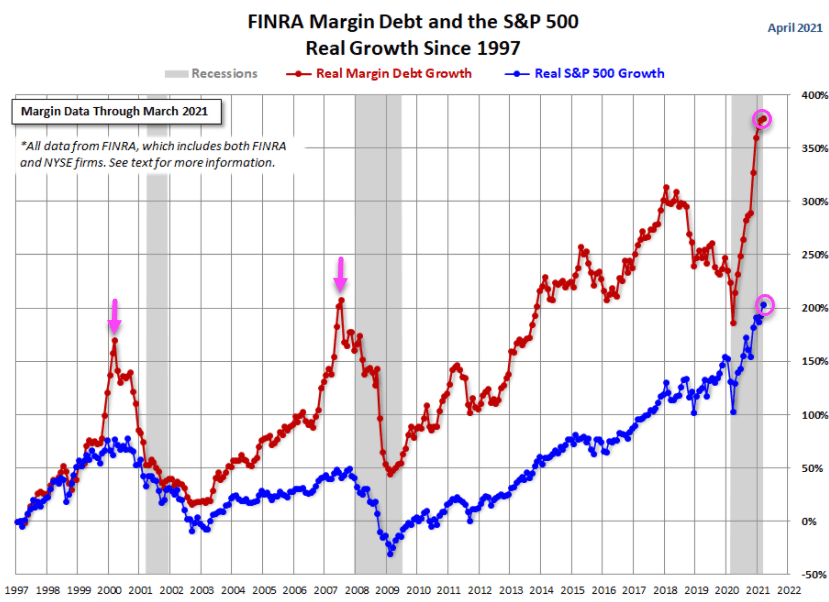
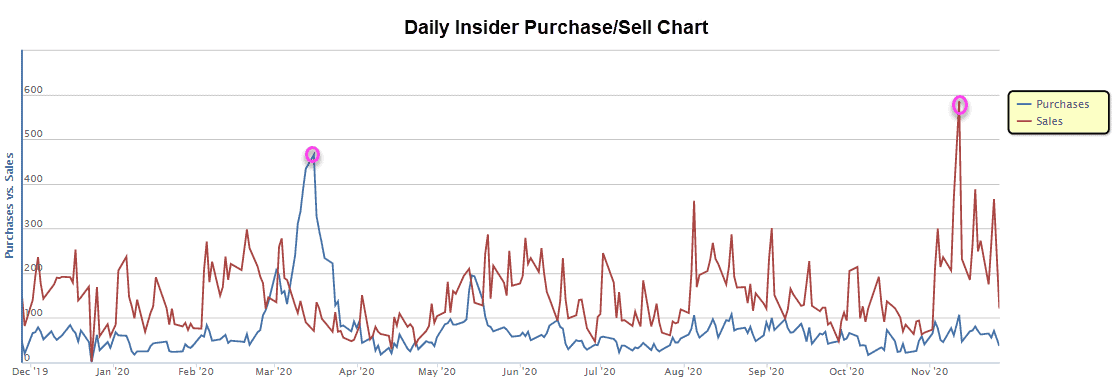
Insiders are selling

The chart below shows that insiders have clearly decided to sell shares.
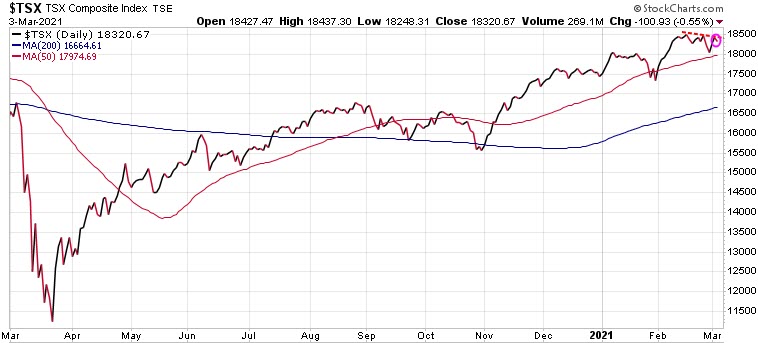
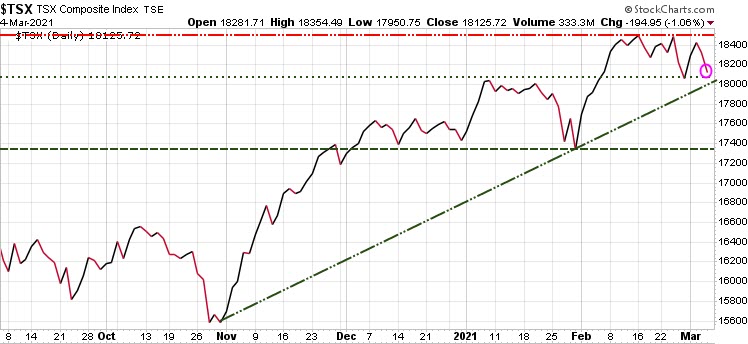
Canadian equities

The TSX Index was down as well, but held up better as oil prices surged today.
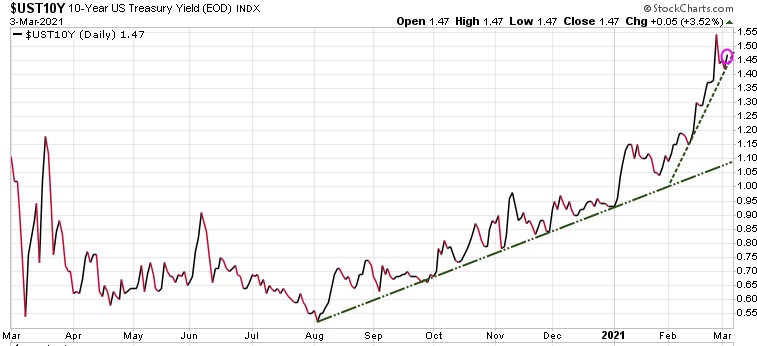
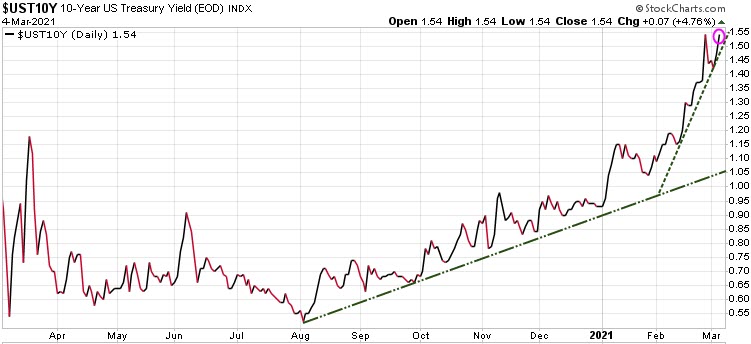
Bonds

The bond vigilantes continue to challenge the Fed’s policy of low rates and dovish outlook. When investors perceive that inflation, or credit risk is rising, they demand higher yields to compensate for the added risk. The term refers to the ability of the bond market investors to serve as a restraint on the government’s ability to overspend and over-borrow. It will be interesting to see who wins this battle.  Trend Letter subscribers have benefitted handsomely with a recommendation  made in August, betting on yields rising. As we can see on the chart, that recommendation was very timely, hitting the turn within days. That trade recommendation is up 38% since August.
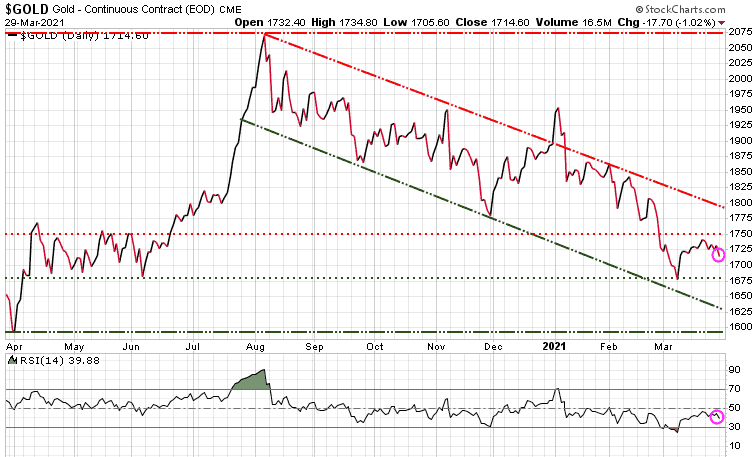
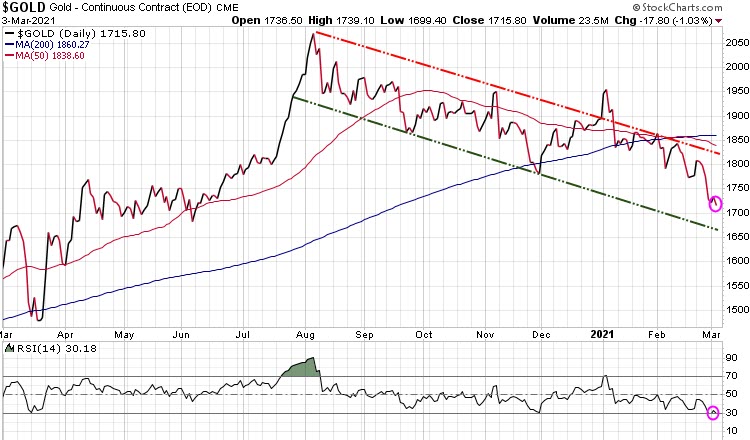
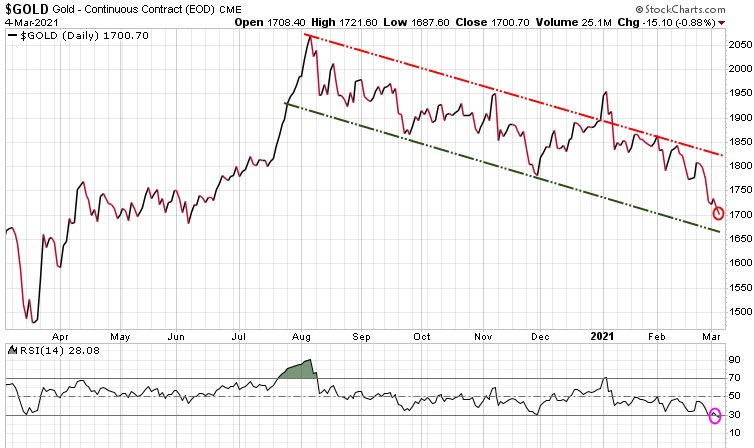
Gold

Gold had another rough day, down 15.15 for the day. The only optimism for gold right now is that it is now oversold technically based on RSI (bottom of chart) so we should see at least some consolidation soon, if not a bounce off these levels.
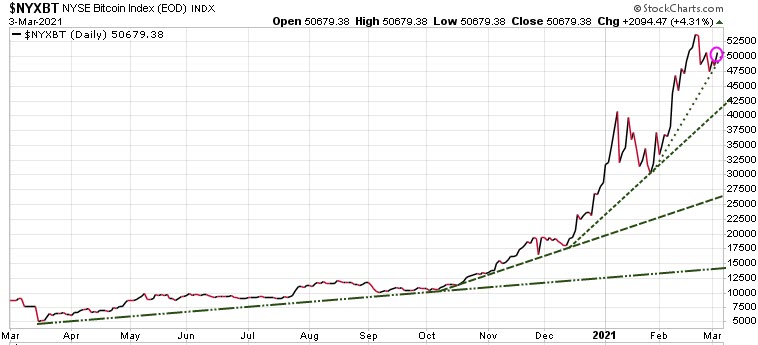
Bitcoin

Bitcoin continues to be volatile, falling below the $50,000 level today.
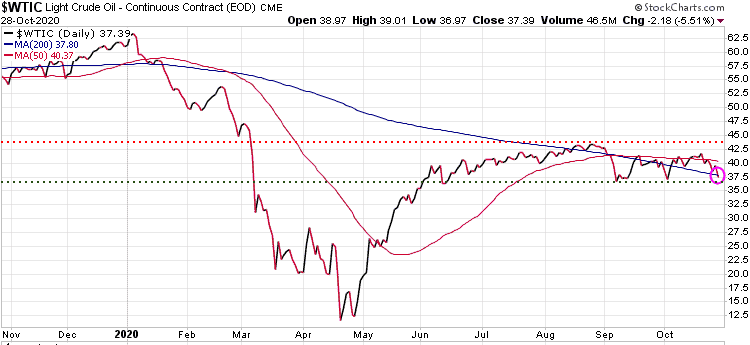
Oil

Oil surged to the highest level in nearly two years after closing at 62.83, up  2.55 or 4.15% after the OPEC+ alliance surprised traders with its decision to keep output unchanged, signaling a tighter crude market in the months ahead.
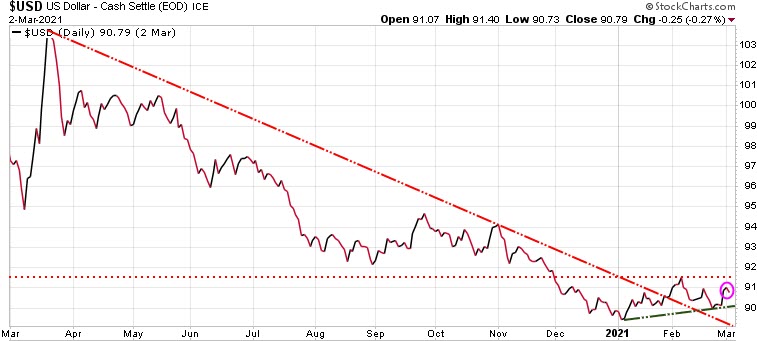
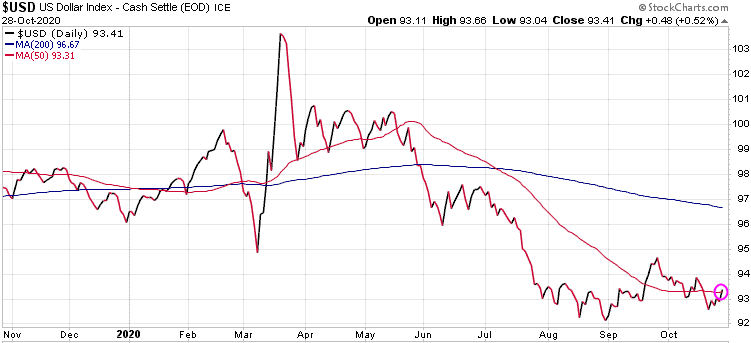
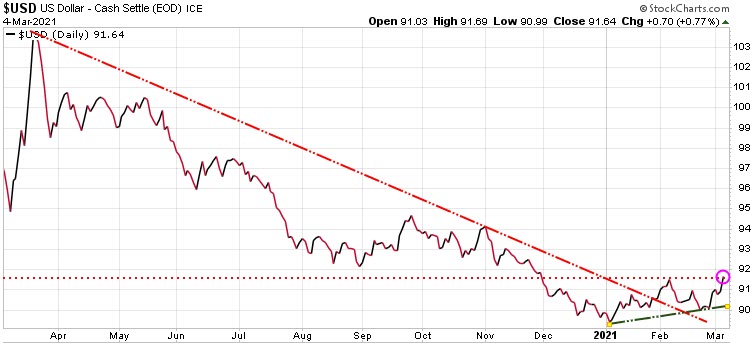
US dollar

The US dollar continues to gain momentum on equity weakness and capital flows, especially from Europe.  With expected increased volatility in the equity markets this year, the US dollar could see a significant rally going into 2022.

Do you have hedge or exit strategy?

Hedging is a useful practice that every investor should know about.

It’s a way to protect your portfolio, and protection is often just as important as portfolio appreciation.  Even if you are a beginner, you can learn what hedging is and put it to work for you.

The best way to understand hedging is to think of it as a form of insurance.  When people decide to hedge, they are insuring themselves against a negative event to their finances.  This doesn’t prevent all negative events from happening, but when something does happen and you’re properly hedged, the impact of the event is reduced.

Risk is an inherent part of investing.  Regardless of what kind of investor one aims to be, having a basic knowledge of hedging strategies will lead to better awareness of how investors can protect themselves.

While typically the goal of hedging is to protect from losses rather than to make money, with Trend Technical Trader (TTT) we take it one step further.  Cycles will always occur, and we seek to profit greatly from those cycles.

TTT is a hedging service that is designed to profit during stock market declines, and the bigger the decline, the bigger the gains TTT trades can generate.  Our objective is to help serious investors avoid losing a significant portion of their wealth in the next downturn, and position them for the next big buying opportunity.

It is also possible to make a lot of money during a market downturn, not just mitigate losing money.  It’s even possible to have typical long positions that stay flat or go higher when markets collapse, if they’re properly and prudently chosen.

Trend Technical Trader is not just for hedging, or seeking to profit when markets plunge.  TTT has made phenomenal gains when it was prudent to be bullish – in stocks, gold, oil, currencies… whatever is compelling at the time.  In fact, our proprietary Gold Timing Indicator (GTI) has a record better than any other we’ve seen.

Why is timing so important?  Those who rely on “fundamentals” are ignoring history, unaware of how creative corporate accounting often is, and at best basing their valuations on quarterly-reported numbers and metrics that are already months old.  We believe a timing element is essential to successful speculating and investing over time, so while we consider fundamentals, we also heavily factor technical and sentiment measures.

TTT had another excellent year in 2020 averaging +27.3% per closed trade, with an average holding time of 9.5 weeks, or +149% annualized overall.

Over the past 5 years, TTT’s closed trades have averaged +40% annualized.

If you do not have a hedging or exit strategy, seriously consider subscribing to Trend Technical Trader at this special discounted rate.

For other special pricing, click button below.

Market Notes

Market Update

S&P 500

The S&P 500 was down 50.57 points or 1.31% today and is now testing near-term support at 3819, which is the 50-DMA (red wavy line on chart). The last two times the 50-DMA has been a strong support level, so if this level does not hold here it would be a bearish signal.  What is troubling here is that we are seeing a pattern developing of lower highs and lower lows. A close below 3817 opens the door for the next support level at 3714, with key support being at the 200-DMA at 3462.  Key resistance is at 4010.

Nasdaq

The Nasdaq was the biggest loser today, down 361 points, or 2.70%.  The tech sector just experienced its worst two days since September. As we can see on the chart, the Nasdaq is also seeing lower highs and lower lows, and it has broken below its 50-DMA. This is bearish action.

According to a Deutsche Bank survey,  younger individuals were more likely to use their recent fiscal relief payments to invest in stock market. while income levels varied, majority have less than  12 months of online investing experience.

Canadian Equities

The Canadian market also declined today, down 100.93 pints of .55%. The Canadian market is also seeing lower highs and lower lows and will need to see its 50-DMA hold or we could see a more significant sell-off in this market.


Bonds

Bonds resumed their sell-off, meaning yields were rising again, a  key reason equities are selling off.

Gold

Gold was down 17.80 and remains stuck in its downtrend channel, unable to gain any momentum.  Gold prices are falling as yields keep rising and the gold ETF capital exodus continues. Gold ETFs holdings had the 13th straight day of declines, the longest losing streak since December 2016.  Based on RSI (bottom of the chart) gold is getting close to being technically oversold so a bounce should occur soon.

Bitcoin

Bitcoin continues to be volatile and seems to be the millennials’ preferred inflation hedge over gold. Bitcoin once  pushed above through the $50,000 level.

US dollar

The US dollar continues to consolidate and attempt to gain some momentum to break through resistance  at 91.50.

If we do see the equity markets decline here, capital will flow to the US dollar and US bonds as temporary safe-havens.

Are you prepared for this coming debt crisis? If not, seriously consider subscribing to Trend Letter & Trend Technical Trader for easy to follow strategies to not just protect your wealth during this coming crisis, but to actually increase your wealth. Click the button below to subscribe to both services and save $600 off the regular prices.

Stay tuned!

Some reasons for caution

Our model gave a recent warning of a potential market top coming soon and we sent subscribers a strategy to protect their portfolio. Below we show a few charts that allow investors to see some reasons for concern here.

The first chart shows the daily purchase and sell transactions by corporate insiders – officers, directors, and holders of more than 10% of company shares. The SEC requires these shareholders to report purchases and sells within two days of a transaction. As we can see on the chart, during the massive sell-off in February and March, insiders were big buyers of their company’s shares (pink circle on blue line). But now in this record setting rally in November, corporate insiders have been massive sellers of their company’s stock (pink circle on red line) .

On the second chart we see CNN Fear & Greed Indicator. This indicator combines seven real-time market indicators to assess current investor mood. Of those seven indicators, six have reached “Extreme Greed,” levels, which is typically indicative of at least a short-term market top.

As investors we need to be aware that this transfer of shares from strong insider hands to weaker retail investors is a warning that we could be in for a correction very soon.

Our models monitor these and many other indicators, and are they have given us a warning signal that we could see a top here in the next 10 days. At the beginning of the year our model forecast the S&P 500 would reach 3600 by the end of 2020; well we have now achieved that target.  Over the next 10 days we have a target high of 3740 for the S&P 500, and our first support level is 3600. A drop below 3600 warns of a steeper decline, with further support targets at 3462, (the 50-Day Moving Average ((red wavy line)), then 3220 ((green horizontal line)), and then the 200-DMA at 3152 ((blue wavy line)).

 If, like many investors today, you are heavily invested right now, you might want to consider some hedging strategies. Every investor should have a plan, an exit strategy to turn to during a a major correction. If you have no strategy on how to lighten up and protect your investments, plus you want to potentially achieve significant gains in a severe correction, seriously consider subscribing to our Trend Technical Trader service. Cyber Monday price only $649.95 $399.95


Attack of the Debt Tsunami

For 10 years we have been pounding the table warning that we were heading for a credit market disaster. Governments around the globe have been spending far more than they were collecting, to the point where we warned that ‘far more debt has been created than can ever be paid off.’ And this was BEFORE COVID-19 and the massive spending that governments have been doing since March of this year.

Now the Institute for International Finance (IIF) says that global debt, as of the end of September, has hit a new all-time high of $272 trillion, and it warned of the ‘attack of the debt tsunami.’ The IIF said that global debt will break new records in the coming months to reach $277 trillion by year-end; this would push the debt-to-GDP ratio to 365%. To put this debt total into perspective, there are 7.7 billion people in the world, meaning the $277 trillion in debt equals $35,974 for every man, woman and child.

Are you prepared for this coming debt crisis? If not, seriously consider subscribing to Trend Letter & Trend Technical Trader for easy to follow strategies to not just protect your wealth during this coming crisis, but to actually increase your wealth. Click the button below to subscribe to both services and save $600 off the regular prices.

Market Notes

Market update – October 28/20

According to data compiled by LPL Financial,  historically the S&P 500 averages its highest return of the entire year on October 28th. Well, that certainly was not the case today, the markets got hammered.

There were many factors contributing to today’s slaughter, and leading the way were fears related to soaring coronavirus case numbers, especially in Europe, followed by Trump’s apparent acknowledgement that a stimulus package won’t be passed prior to the election. And then of course there is the election itself.

The S&P 500  – dropped 119 points or 3.53%.

The S&P 500 has fallen through its 50-DMA (red wavy line) and is approaching near-term support at 3220. The 200-DMA (blue wavy line) will be a key test of support. Note at the bottom of the chart, the Relative Strength Index (RSI) is at 35.21, not yet in oversold territory.

Gold – down 32.70 or 1.71%

Gold also took it on the chin as fears of the global economy falling into a deeper recession or even a depression suggest deflation, not inflation. Deflation is not gold’s friend. Gold remains in it near-term downtrend channel and will need to break out of it before we can start thinking of a breakout.

Oil – down 2.18 or 5.51%

Oil also got smacked and is close to testing near-term support at 36.80

US Dollar – up .48 or .52%

When investors get spooked they look to safety, and the $US is the safe haven currency.

Interesting chart comparing US service sector to the Euro Area. Those who think the Euro will outperform the $US need to have a good look at this chart. The gap between these two economies is now at the widest it has been since the Euro crisis in 2012.

Stay tuned!

The Elephant in the Room

The Elephant in the room

Every so often we review the latest debt numbers as tracked on the US Debt clock site. These numbers are US based, but the story is similar all over: governments have been racking up massive debts for decades and now with COVID-19, they are accelerating this practice to unprecedented levels

  • The US national debt is $26.8 trillion
  • In the US there are 330.2 million people
  • Therefore, the debt per man, woman & child equals $81,145
  • Of those 330.2 million citizens only 124.4 million pay income tax, so the debt per taxpayer equals $214,845

  • The US also has $154 trillion of Unfunded Liabilities (Social Security, Pensions Plans etc)
  • That adds another $468,217 per citizen & $1.24 million per taxpayer

  • Add the National Debt + Unfunded Liabilities together = $181.44 trillion
  • Which equals $549,485 per citizen & $1,458,520 per taxpayer

These numbers are as of today and are growing rapidly. In the US there are negotiations to add a Phase IV COVID emergency funding of at least $2 trillion. We could easily see the US debt hit $30 trillion in a year and $50 trillion by 2025.

Your family may have sacrificed for years, made smart investments, built up your savings, and now believe you are debt-free, but the reality is you are also citizens and most likely taxpayers. These massive government debts are going to end up on the backs of those who have a job, pay taxes, who own a home and have accumulated some wealth. We are seeing government across the globe use COVID-19 as an excuse to create new programs and fueling what we see as frightening Big Government initiatives that have nothing todo with fighting the virus.

Here in Canada, the federal government throne speech was an incredible 17 pages long, and only six of those pages were actually devoted to dealing with the COVID-19 pandemic. The rest included over 30 new initiatives, with absolutely no mention of what they will cost or how they will be paid for. The only reference to funding was a promise to ‘tax the rich.’ This has become a very popular mantra, as there is a widening wealth inequality, but to suggest that simply taxing the rich will cover all these costs is absurd, there simply are not enough rich people to cover all these costs. And realistically, if you threaten to tax the rich at 75% or more of their income, as France did, they will simply leave the country.

The reality is, it is the middle class, the group every politician claims to be protecting, who ends up paying the price.

Stay tuned!


If you are not a subscriber but would like to be, we are offering some great discounted rates for the Trend Letter & Trend Technical Trader.

Trend Letter:

Since start-up in 2002 Trend Letter has provided investors with a great track record, giving exceptionally accurate information about where the markets are going, and it has explained in clear, concise language the reasons why. Using unique and comprehensive tools, Trend Letter gives investors a true edge in understanding current market conditions, and shows investors how to generate and retain wealth in today’s climate of extreme market volatility.

A weekly publication covering global bonds, currencies, equities, commodities, & precious metals.

Timer Digest says: “Trend Letter has been a Timer Digest top performer in our Bond and Gold categories, along with competitive performance for the intermediate-term Stock category.”

Regular price =$599.95  Special discounted price = $399.95 

Technical Trader:

Originally developed to be a premier hedging service designed to profit in declining markets, Trend Technical Trader (TTT) has evolved into an excellent all round trading service that prospers in both up and down markets. After delivering excellent gains during the March melt-down, TTT steered subscribers into gold trades and a number of long equity positions for phenomenal gains in very short holding periods.

TTT is an online service, updated every Monday, Wednesday and Friday, after the market clo

Regular price =$649.95  Special discounted price = $399.95 

Better Deal:

Both the Trend Letter & Trend Technical Trader for only $699.95