If the Fed cuts rates will that be the time to buy stocks?
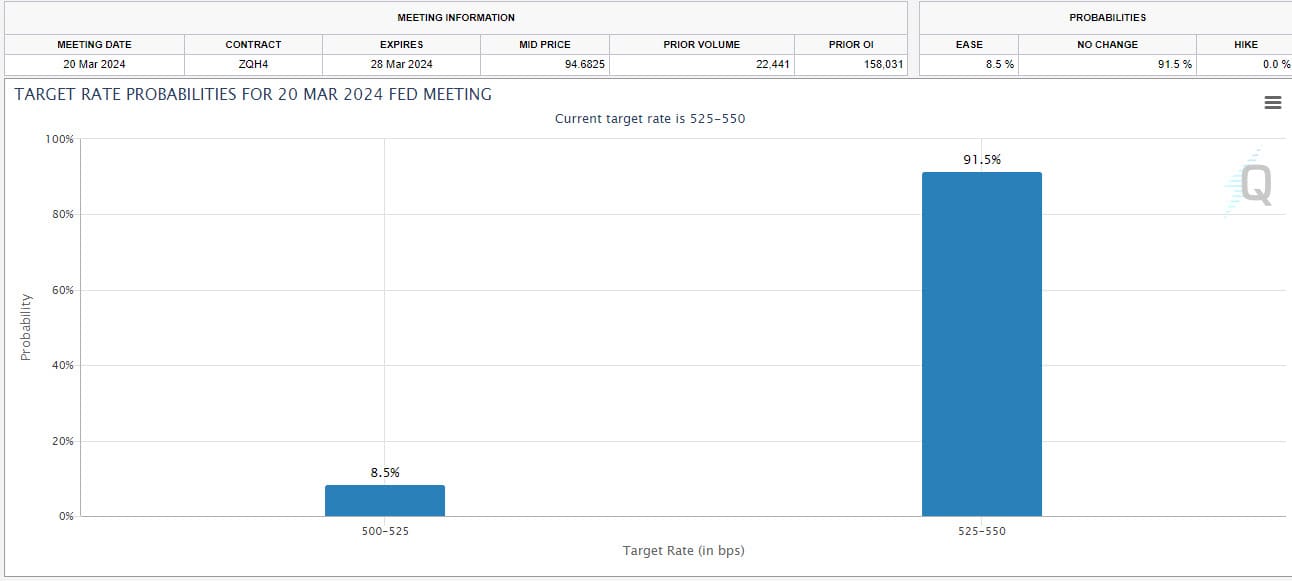
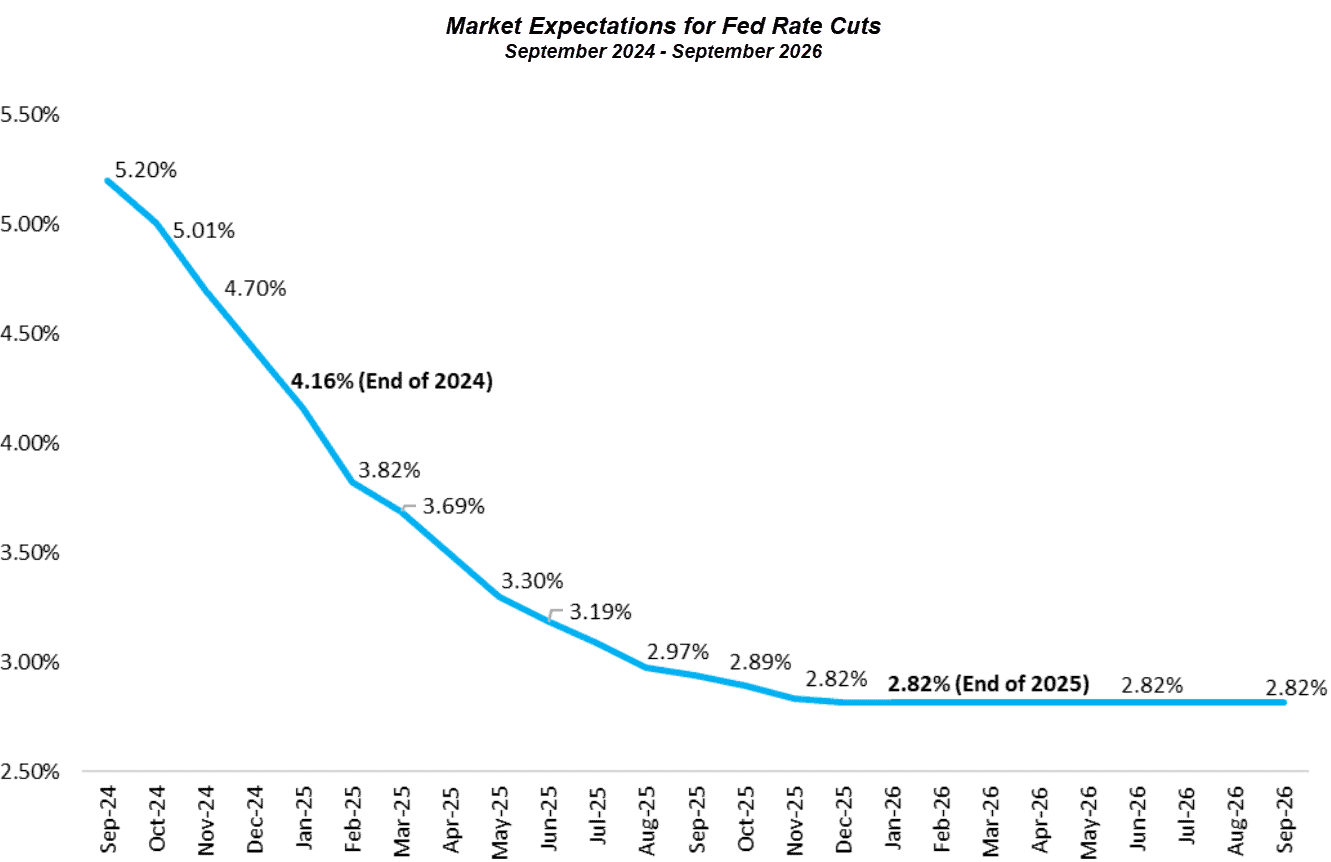
In last week’s interview on This Week in Money with Jim Goddard, we explored the likelihood of the Fed beginning to cut rates at their September 18/24 meeting and debated how aggressively they would cut. The current rate is 5.50% and according to Fed fund futures, by the end of 2024, the rate will be 4.16% or 24% lower than it is today. By the end of 2025, that data expects a rate of 2.82%, slightly more than half the current rate.
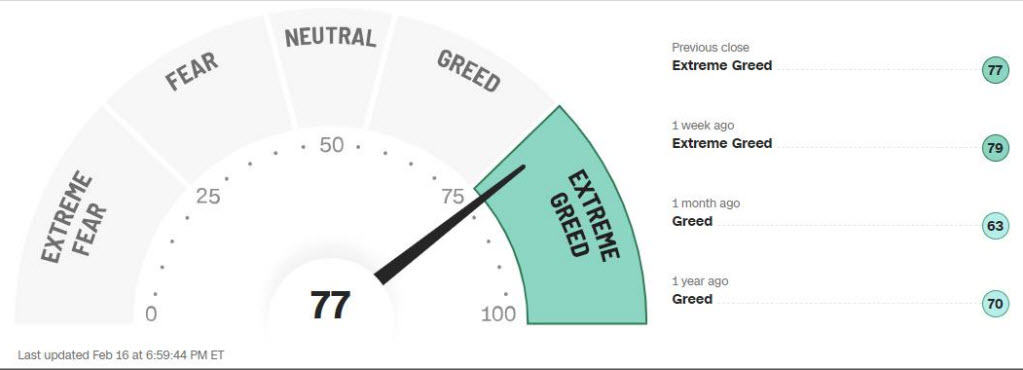
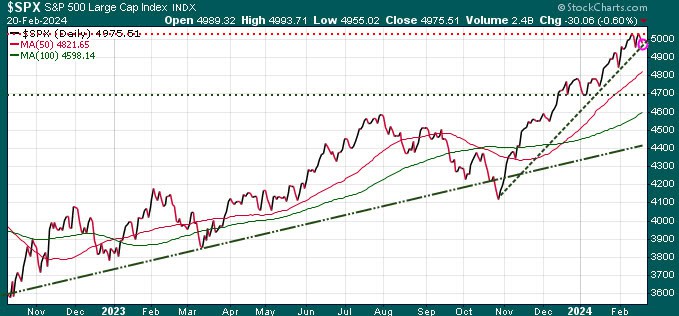
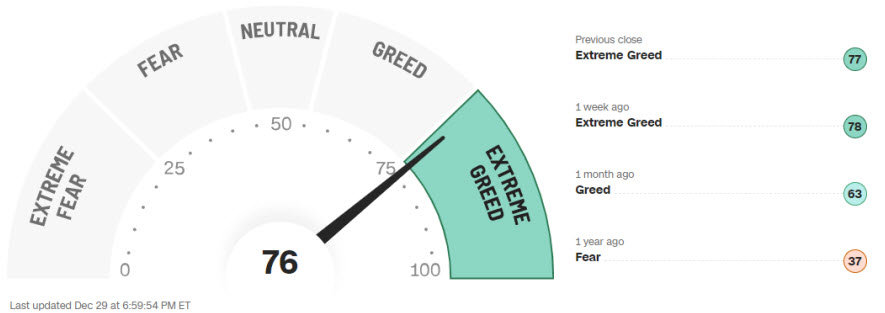
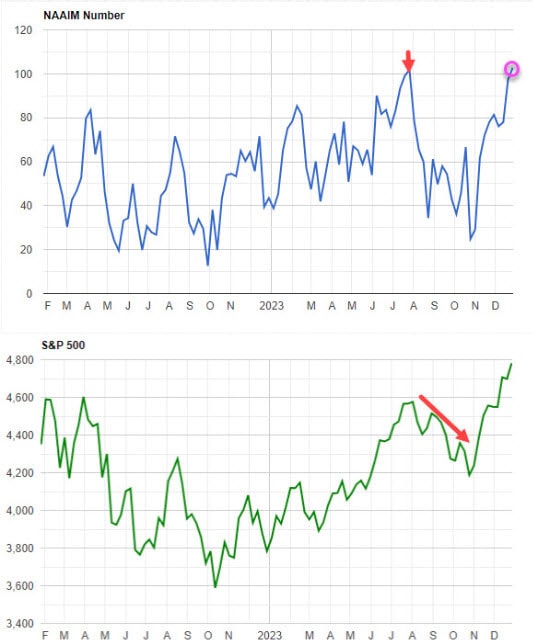
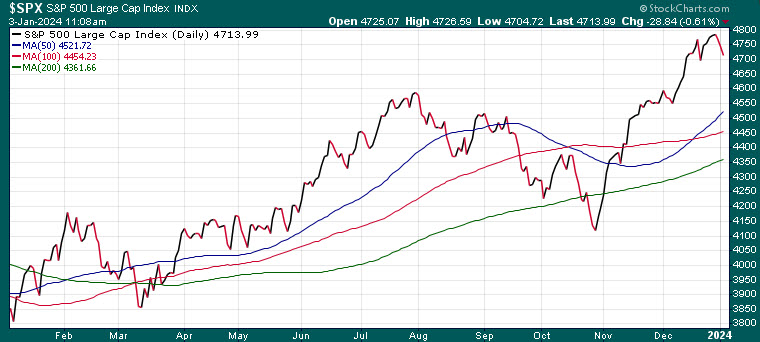
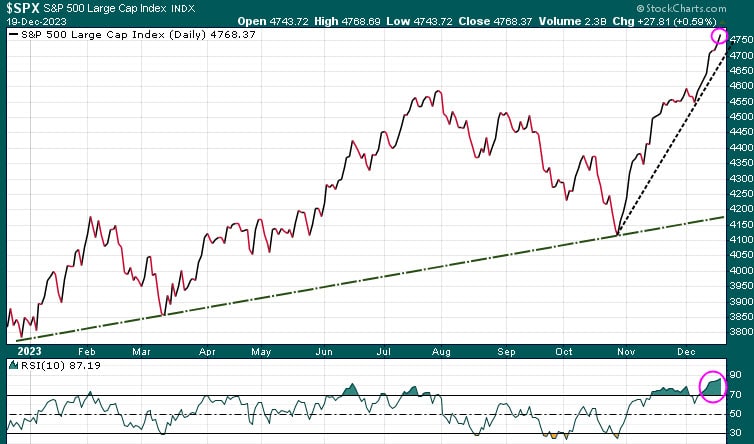
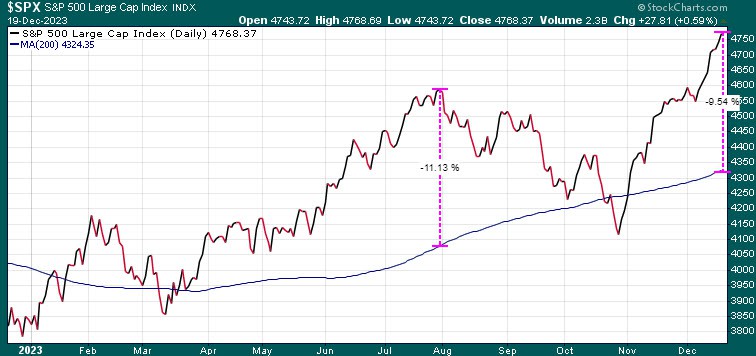
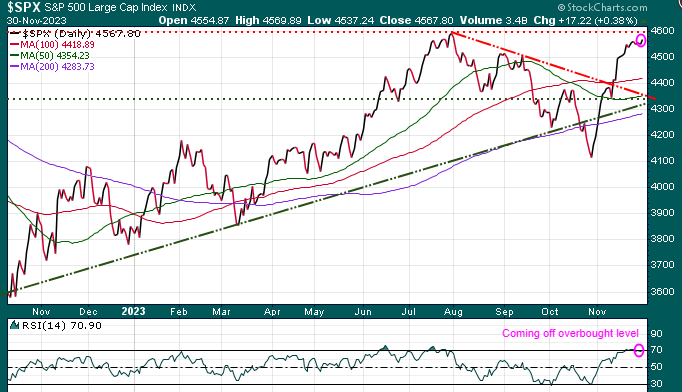
The stock market, which just came off of all-time highs two weeks ago, experienced a decline every trading day last week. This stock market is driven by momentum, rather than value.
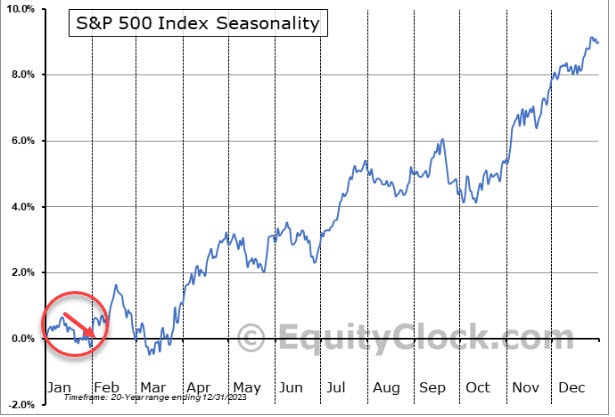
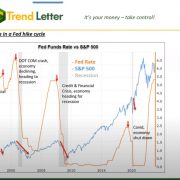
During my discussion with Jim, I referenced a short video (9:44) I created in December, demonstrating that typically, markets experience a brief uptick when the Fed pauses after raising rates, which we have seen. However, once the Fed starts aggressively cutting rates, stocks sell off.
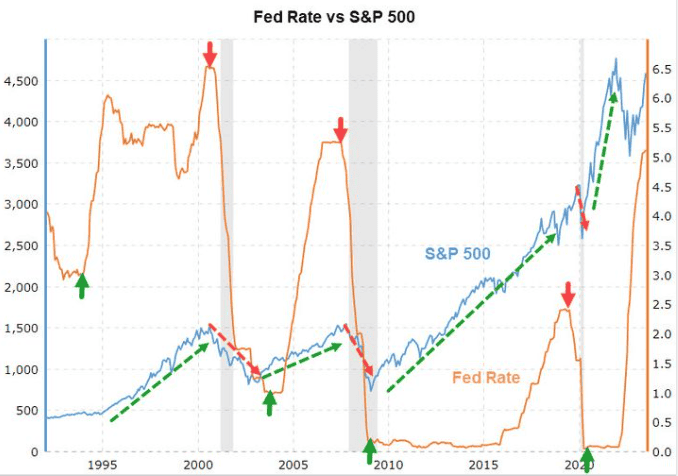
And this pattern is logical, as rate cuts are typically triggered by economic difficulties and impending recessions, prompting investors to sell stocks due to their vulnerability in such conditions. In the short video, you will see that markets decline, often dramatically, during aggressive rate-cutting periods. Stocks tend to recover and experience strong rallies, only after the Fed ceases cutting rates.
Consider this: if the Fed embarks on an aggressive rate cut cycle starting September 18, be cautious of mass media pushing for stock purchases. The video highlights a potential risky scenario, akin to a trap. So, keep your head on a swivel. View video