Posts by The Trend Letter

Market Notes

Market Notes – May 9/22

Global markets got hit hard today with investors refocusing on the Ukraine war, a global energy shock and the risk asthe Fed tries to fight the supply-driven inflation.  “I’ve been in the markets for 25 years and I’ve never seen anything like this,” said Danielle DiMartino Booth, CEO and chief strategist for Quill Intelligence, a Wall Street and Federal Reserve research firm. “It’s violent not just volatile.”

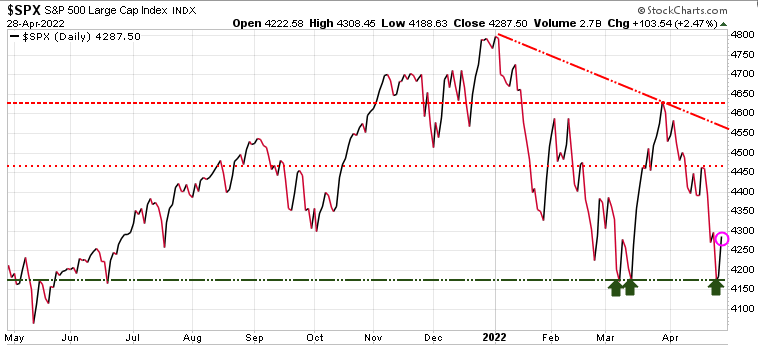
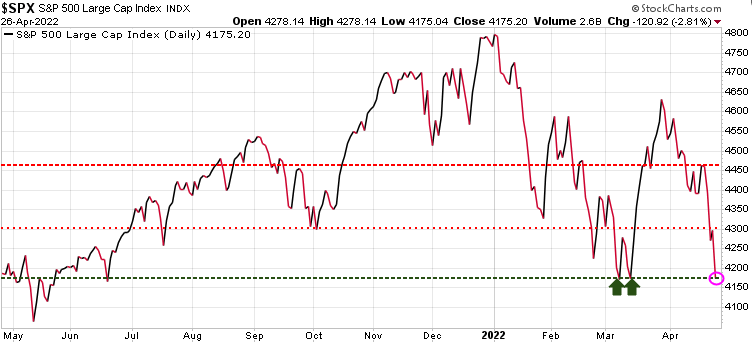
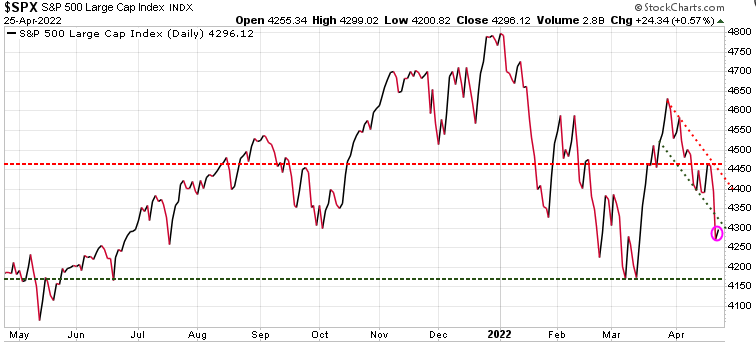
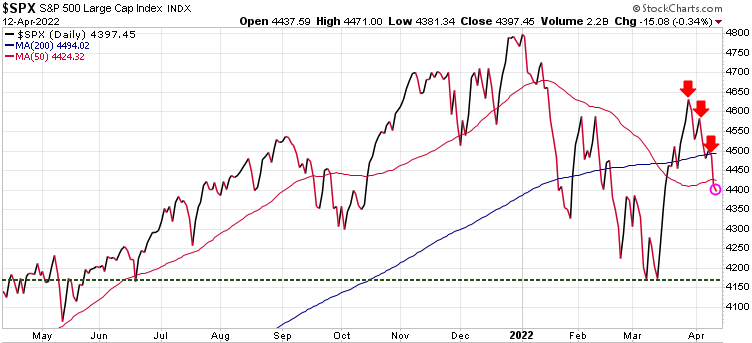
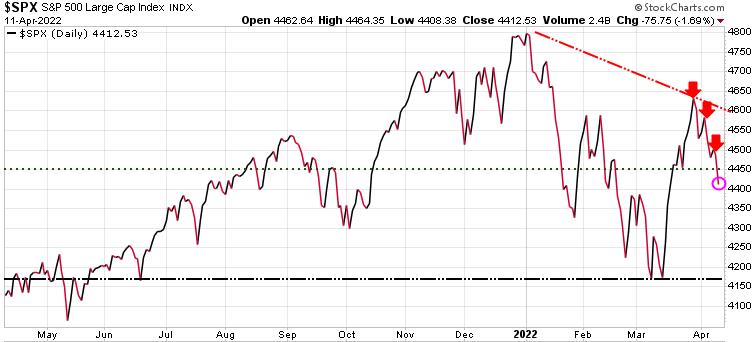
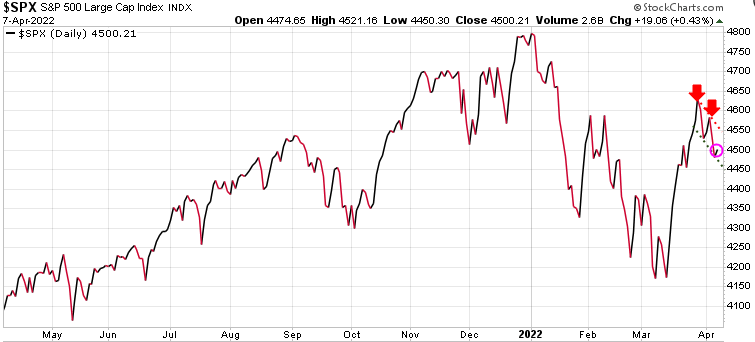
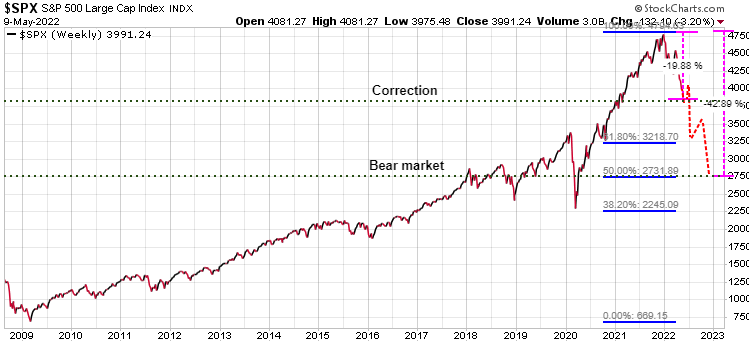
In the weekend edition of the Trend Letter we showed this updated chart, highlighting  what a correction vs a bear market would look like. A move down to the 3800 level would be a  decline of ~20% from the December high, signalling a correction. We would expect a relief rally from that level. If we then re-test that level, a bear market would likely take the S&P down to the 2730 level which would be a 50% retracement of the rally from 2009 to the recent high in December.

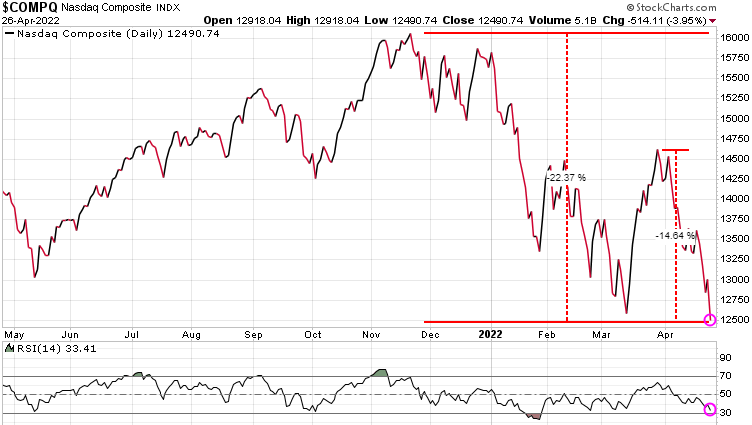
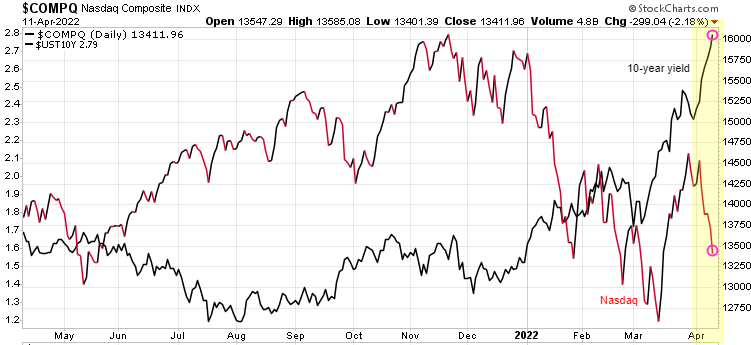
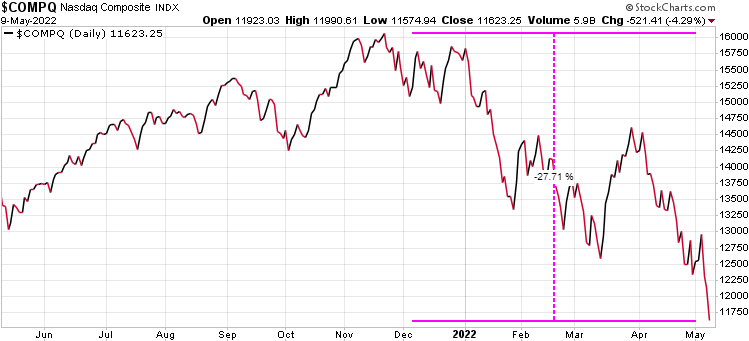
The tech heavy Nasdaq was down a whopping 4.29% on Monday. Now down ~28% so far this year!

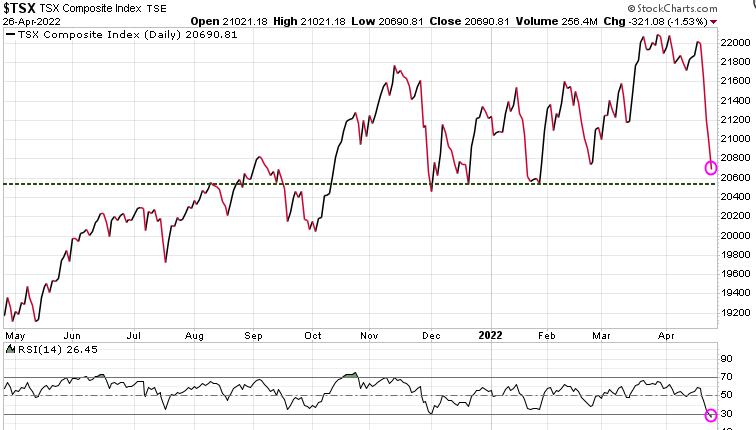
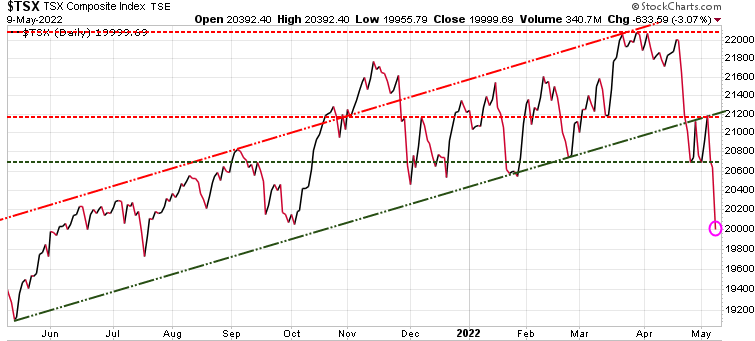
The Canadian TSX was down 3.07%

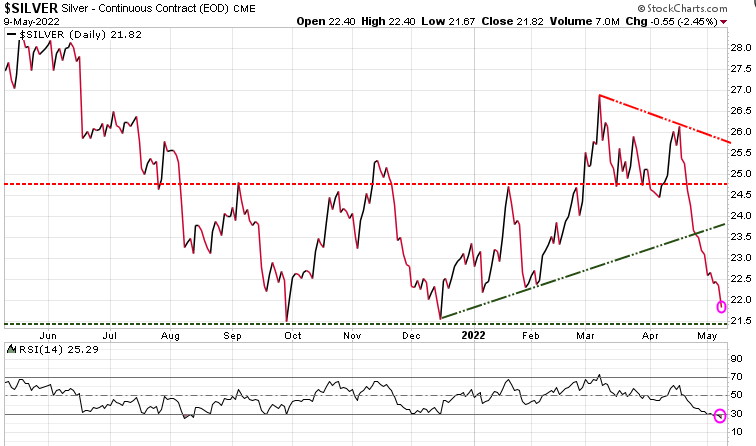
Silver has really struggled recently, and dropped another 2.46% today.  Based on RSI (bottom of chart), silver is now oversold.

Since the start of the year we have warned investors to have a hedging strategy for what we anticipated would be a very volatile year in 2022. The market action in these last 4 months is exactly the reason investors need a strategy to protect their wealth in volatile markets.  Our Trend Technical Trader (TTT) service was originally a hedging service and although it now recommends long positions as well, TTT is still a hedging service with many hedging strategies that are doing very well as the market crashes.

If you do not have a hedging strategy, seriously consider subscribing to TTT which offers numerous hedging options. Note also, TTT includes the Gold Technical Indicator (GTI).

To ensure all readers have access to this hedge service, we temporarily reduced the price by 50%. Click button below to subscribe. It’s your money – take control!


Stay tuned!

Market Notes

Market Notes – April 28/22

US stocks ended sharply higher Thursday, led by technology shares as markets continued a comeback from steep losses earlier this week. This gain was in spite of the news that the US economy   unexpectedly contracted at the start of 2022 for the first time in nearly two years as lingering supply chain imbalances, inflationary pressures, and war in Eastern Europe weighed on growth. First-quarter US gross domestic product (GDP) fell at a 1.4% annualized rate after a 6.9% pace of growth at the end of 2021.

The bad news is good news logic here is that the Fed will be less likely to aggressively raise rates if the economy is heading toward a recession.  The other spark for the markets was the anticipation for Apple’s earnings, which came in positive after the close.


As we highlighted in Tuesday’s Today’s Charts, investor sentiment had gotten very negative (bearish) and suggested that we would see a relief rally.  Right on schedule, starting Wednesday we saw the markets rally, and then today had a gonzo spike.

The key support for the S&P 500 was the 4173 level which held the previous two times it was tested (green arrows). It held again this week, which triggered this relief rally which should test near-term resistance at 4465 (light red dashed horizontal line). If it can push through that level, then the next resistance is 4630 (next red dashed horizontal line).

The S&P 500 has seen a series of lower highs and lower lows, so until it breaks out of that trend we need to be cautious here. The 4173 remains near-term support and if that level gets taken out, then we are in for a deeper correction, potentially much deeper.

The US dollar has been on a parabolic tear this year. With Exchange Traded Funds (ETFs) it is very easy to trade currencies, just as easy as trading any stock. Unfortunately, most investors miss these opportunities.  Trend Letter uses these ETFs and currently has a leveraged short Euro trade that is up over 32% right now.

The Japanese 10-year bond yield has been negative until just recently, and even today only pays 0.21%. The US yield is 2.82% (Canada is 2.78%), so Japanese investors are pouring into US bonds, meaning they are converting Yen for $US. As a result, the Yen is getting hammered, down over 20% this year.  A weak Yen drives up import costs, especially energy and food.

After hitting .83 in early June thanks to energy and commodities, the Loonie has not been able to maintain that strength due to the massive strength in the US.

Stay tuned!


Market Notes

Market Notes – April 26/22

Another rough day for stock markets globally.  Most markets opened lower and after making a few feeble efforts to rally, they could not gain any traction.  Lots of headwinds for the markets: inflation,  central banks aggressively raising rates, Covid lockdowns in China, and the fear of escalation in the Russian-Ukraine war.  Most of these markets are getting close to being oversold, so we should soon get a relief rally very soon.
The Nasdaq-100 Index tumbled 3.95%. It has fallen 22.37% since the November high and 14.64% in the last month. The Nasdaq is now officially in a bear market.  Note that the March low did not hold support. Looking at the bottom of the chart, we can see based on RSI, the Nasdaq is close to being oversold.
The S&P 500 is now testing key support, where it held twice in March (green arrows).

The Canadian TSX has been the strongest market globally, up until  the recent decline thanks to the spike in energy and commodity prices. But in the last few days, even those sectors sold off. Note at the bottom of the chart, that the TSX is oversold now based on RSI.

Sentiment is very weak. The CNN Fear & Greed Index looks at 7 indicators that affect investors’ sentiment and as we can see, it is very close to an ‘Extreme Fear’ reading.  These indicators tend to be quite contrarian, suggesting that at minimum, we should see a relief rally very soon. But such a rally could be a sucker rally.

Stay tuned!

Market Notes

Market Notes – April 25/22

(AP News)…Elon Musk reached an agreement to buy Twitter for roughly $44 billion on Monday, promising a more lenient touch to policing content on the social media platform where he — the world’s richest person — promotes his interests, attacks critics and opines on a wide range of issues to more than 83 million followers.

The outspoken Tesla CEO has said he wanted to own and privatize Twitter because he thinks it’s not living up to its potential as a platform for free speech.

Musk said in a joint statement with Twitter that he wants to make the service “better than ever” with new features, such as getting rid of automated “spam″ accounts and making its algorithms open to the public to increase trust.

“Free speech is the bedrock of a functioning democracy, and Twitter is the digital town square where matters vital to the future of humanity are debated,” the 50-year-old Musk said, adding hearts, stars and rocket emojis in a tweet that highlighted the statement.

Musk’s offer is $54.20 for each share.

Wild swings for the equity markets today, with the S&P 500 tumbling at the opening where it bottomed at 4200, and then fought its way to a high of 4299, before closing near that high at 4296. In yesterdays’ issue of the Trend Letter, we told subscribers… ‘sentiment is very bearish, which to us can be quite contrarian, suggesting a possible relief rally, short-term is likely.’ 

Watch the 4470 level for near-term resistance, and 4600 for key resistance. Understand that with the Fed tightening its balance sheet, raising rates, and  the yield curve inverting, a recession is extremely likely.  The first step is for the S&P 500 to break out of its downtrend channel.

Gold had another disappointing day, closing down 38.38 on Monday. Gold has now lost 108.00 since the intra-day high last Monday.

Based on seasonality, gold is in a strong period from late March through to early June. So far, that strong historic trend has not materialized this year.

Stay tuned!

Market Notes

Market Charts – April 13/22

Based on seasonality, most North American markets are in a strong period.  Here we see the  chart for the S&P 500, which is strong through to early May. The Toronto and Nasdaq charts look very similar.

Gold is also in a very strong seasonal period, from mid-March right through to early June.

The real returns for government bonds (bond yield – inflation) is negative in most countries, with only Mexico and Brazil being positive on the chart we publish each week in the Trend Letter. Canadian bond holders are losing 3.07% per year, US bond holders are losing 5.80% and Spanish bond holders are losing a whopping 8.10%.

Small businesses make up ~45% of GDP in both Canada and the US. Below are the results of the Nation Federation of Independent Business (NFIB) latest survey.  It shows that the general outlook for these business owners is ‘poor’. In particular, for ‘Expect the economy to improve’, the percentage dropped 14% to -49%, the lowest level recorded in the survey’s 48-year history.

The Index has declined every month this year. Thirty-one percent of owners reported that inflation was their single most important problem encountered in operating their business, an increase of 5 points from February. This is the highest reading since Q1 1981 and has replaced “labour quality” as the number one problem. The net percent of owners raising average selling prices increased 4 points to a net 72% seasonally adjusted, the highest reading in the 48-year-history of the survey. The highest reading in the mid-70s, the last time inflation was a serious problem, was 67% in Q4 1974.

Stay tuned!

Market Notes

Market Notes – April 12/22

The market opened strong,  but couldn’t hold the intraday gains. The S&P 500 continued to trade with lower highs and lower lows, and has now fallen through  both the 50-DMA (red wavy line) and the 200-DMA (blue wavy line).  The inflation numbers were the main problem for the markets, as US inflation came out at 8.5%, which will put more pressure on the Fed to raise rates.

With US rates rising faster than the other main economies (Europe and Japan) capital flows out of those regions and into the $US.

There is usually a strong correlation between energy stocks and crude oil, but recently we are seeing a price divergence. The recent weakness in crude oil may suggest a growing sentiment among investors that inflation may be topping and a recession is a more likely occurrence.  This correlation will return, we just now need to see if oil resumes its rally and joins the XLE, OR if XLE starts to decline along with oil.

Gold had been trading in a tight range and it has been disappointing that it hasn’t been able to rally with the war and inflation.  It has now broken through near-term resistance, which is encouraging.

Stay tuned!

Market Notes

Market Charts – April 11/22

Global stock markets fell on Monday, pulled lower by technology shares in Europe and on Wall Street, as US Treasury yields jumped ahead of inflation data that could prompt the Federal Reserve to tighten policy enough to slow a rebounding economy.

The S&P 500 was down again Monday, losing 1.59%. The key here is that it is in a pattern of lower highs and lower lows and until it breaks out to that pattern, we cannot get bullish.

US technology shares are getting hit by rising bond yields. Nasdaq  index dropped 2.18% as US 10y yields jump to 2.79%, the highest since 2019.

Oil dives 4.04% on worries that the COVID-19 pandemic will cut demand in China, and as International Energy Agency (IEA) countries plan to release record volumes of oil from strategic stocks. Oil is now down over 24% from its March high.  Oil also trading in a pattern of lower highs and lower lows.

A new recommendation was triggered today for Trend Letter subscribers.

Stay tuned!

Market Notes

Market Charts – April 8/22

Bond yields keep rising (bonds dropping), as the yield on the 10-year  Treasury spiked to 2.72% today. The 10-year yield is now up 130% since November.

When bond yields rise, so do mortgage rates.  The US 30-year mortgage is now just under 5%, the highest rate since later 2018.

One of the ‘events’ that is occurring is the French election, with the first round this weekend.  As investors, we want to keep an eye on this election because Marine Le Pen’s popularity has been steadily rising. The reason investors should be aware of this is that Le Pen is a far-right politician and one of the issues she favours is to leave the Eurozone, like the UK did.

According to BBC, a month ago Marine Le Pen was trailing President Macron by 10 points and fighting for a place in the second round against him. Now she’s seen as the clear favourite to challenge him for the presidency after Sunday’s first round. If she does make it through to the April 24 run-off, opinion polls suggest for the first time that a Le Pen victory is within the margin of error. As we can see, Le Pen has been rising, while Macron has been slipping.

What we find interesting for investors is, the markets don’t seem to have priced in the possibility that Le Pen could win. To us, even if she just makes it to the run off, the angst of France leaving the EU would be profound.  Last year,  Trend Letter recommended subscribers be short the Euro (via an ETF) and that trade has done well, up ~24% to date. But we suspect that should Le Pen make it to the run off, the Euro could be under even more pressure over the next couple of weeks; and should she actually win, well watch out!

Interesting chart showing how the lowest-earning workers (blue) have had the strongest wage gains on record. Wage growth also up for highest-paid workers (orange), but not nearly as strong. 

UN’s food price index sets record high. Global food prices rose a whopping 13% in March, and compared to a year ago food prices are up 34%.
Updates on all sectors in Sundays issue of the Trend Letter.  If you are not a subscriber, what are you waiting for?
Stay tuned!
Market Notes

Market Charts – April 7/22

Stocks ended higher for the first time in three days, shaking off volatility from earlier this week. Still, the S&P 500 was on track to post a weekly loss and end a three-week winning streak, if levels hold through Friday’s close.

Fresh commentary from Federal Reserve officials remained in focus on Thursday, as another set of speakers offered a mixed set of commentary on the policy path forward for the central bank. St. Louis Fed President James Bullard said Thursday that he wanted the Fed to get to between 3% and 3.25% on the Fed funds rate in the second half of this year, implying more aggressive, front-loaded interest rate hikes in the near-term. Bullard was the only dissenter in the Fed’s March meeting, calling for a larger 50 basis point interest rate hike versus the 25 basis point hike that ultimately occurred.

However, other Fed officials offered a more measured approach to raising rates. In remarks Thursday, Atlanta Fed President Raphael Bostic said it would be “appropriate” to move the benchmark interest rate “closer to a neutral position,” suggesting a somewhat less hasty series of interest rate hikes. Meanwhile, Chicago Fed President Charles Evans suggested the Fed would be able to “get to neutral, look around, and find that we’re not necessarily that far from where we need to go.”

Taken together, the confluence of commentary at least temporarily helped stocks pause their latest bout of volatility from earlier this week, and kept Treasury yields steadier after a steep march higher. The benchmark 10-year yield held around 2.6% for its highest level since 2019.


The S&P 500 made a solid turn around after dropping to 4450, as it rallied to finish the session at 4500.21, up 19.06 points.  The S&P 500 is still in a pattern of lower highs and lower lows, and that will need to change to get at all bullish..

A month ago crude oil was $130, now it’s $96 – are we seeing a peak in commodity prices? Well, not according to JPMorgan, as they say commodities could surge by as much 40%, far into record territory, if investors boost their allocation to raw materials at a time of rising inflation. 

Housing bubble? Certainly based on the surge in searches of the topic, many are thinking so.

Stay tuned!

Market Notes

Market Charts – April 6/22

(From Yahoo Finance)… Conversations detailed in the March 15-16 Fed meeting minutes released Wednesday suggested policymakers will soon begin to unwind the central bank’s $9 trillion balance sheet, including $4 trillion in asset purchases amassed to calm markets after the pandemic hit in early 2020. The minutes also indicated many participants in the Federal Open Market Committee (FOMC) “would have preferred a 50 basis point increase” in benchmark interest rates in March, when the Fed raised rates for the first time since 2018.

Other headwinds investors have to continue to navigate are developments in the Russia-Ukraine war. The United States imposed another round of sanctions on Wednesday that included a ban on American investments in Russia.

Meanwhile, testifying before the House Financial Services committee on Wednesday, US Treasury Secretary Janet Yellen warned that Russia’s war in Ukraine will stoke ‘enormous economic repercussions around the world,’ including disruptions to the flow of food and energy.

This news extended the stock market declines from Tuesday.


The Russian Ruble has erased all of its invasion losses, bucking default risks, and sanctions. International sanctions on Vladimir Putin’s regime sank it to a record low of 121.5 rubles per dollar, triggering memories of the battering it took during the 1998 Russian financial crisis. Biden even called the Ruble ‘Rubble’.  But now, the Ruble has surged, all the way back to where it was before Putin invaded Ukraine, closing at 79.7  in Moscow on Wednesday.

Despite a wide-ranging set of sanctions on the Russian government and its oligarchs, and an exodus of foreign businesses, the actions have been largely ineffective as foreigners keep guzzling Russian oil and natural gas.  Even as Russia remains mostly cut off otherwise from the global economy, Bloomberg forecasts the country will earn nearly $321 billion from energy exports this year, up more than a third from 2021.

Bond yields keep rising (bonds lower), with the US 10-year yield now up 121% since last August.

Mortgage rates also on a steep rise with the US 30-year up 18 bps to 5.02%.

Global sovereign debt is expected to climb by 9.5% to a record $71.6 trillion in 2022, according to a new report, while fresh borrowing is also broadly set to remain elevated. According to the Sovereign Debt Index, published Wednesday by British asset manager Janus Henderson, global government debt jumped 7.8% in 2021 to $65.4 trillion as every country assessed saw borrowing increase, while debt servicing costs dropped to a record low of $1.01 trillion, on record low interest rates.

However, debt servicing costs are set to rise significantly in 2022, climbing around 14.5% on a constant-currency basis to $1.16 trillion.

Image

Central Banks are the largest creditors of sovereigns., holding 23% of the debts issued by the world’s governments. Central Bank holdings of gov’t bonds grew by 9% or $1.3 trillion to $14.8 trillion in 2021. If these Central Banks are true to their word and start to apply Quantitative Tapering (QT), who will pick up the slack?

Image

Stay tuned!