Posts by The Trend Letter

Market Notes

Market Notes – January 27/23

The S&P 500 added 0.2%, while the Dow Jones Industrial Average ticked up 0.08%. The technology-heavy Nasdaq Composite was up roughly 1%, closing out its best week since November.

The biggest mover on Friday were shares of Intel  which fell as much as 10% on Friday after the company’s bleak outlook disappointed. Intel reported a quarterly earnings miss after the close Thursday, adjusted earnings per share coming in at $0.10 against the $0.19 expected by the Street. Revenue totaled $14.04 billion, below estimates for $14.5 billion.

Martin was on Mike Campbell’s Money Talks today (click here to hear that interview..starts at 39:00) and discussed a few charts that he shows his subscriber’s each week and that investors should be aware of.

One of them is that the S&P 500 has displayed a reverse head and shoulder pattern since January and on Friday was able to push through the ‘neckline’ of that pattern, which is a bullish indicator.

In the short-term, Martin talked about how when the VIX Volatility Index drops below 20.00, we typically see a temporary top in the market. Today it dropped to 18.51.

Another chart paints a much different picture than most investors hold.  While all the noise is that the Fed will pause, then pivot & cut…so its BUY BUY BUY, there is a compelling chart that suggests that may not be the case. We have been showing our subscribers the following chart that shows when Fed is in a rate hike cycle like they are now, the bottom in the market aligns with when the Fed STOPS CUTTING rates, not STOPS RAISING them.

With bonds Martin talked about how the 40 year downtrend in yields has been broken.

He also pointed out that both the Bank of Canada and the Fed say they want the REAL rate to be positive, meaning they want the Central Bank rate HIGHER than the inflation rate.

The Bank of Canada rate is 4.5%, the Canadian inflation rate is 6.3%, so the REAL rate in Canada is -1.80%.  Therefore,  if they are true to their word, then rates need to rise &/or inflation needs to drop to get a positive real rate.

Back in November we told subscribers that gold was forming what we hoped would be a strong base foundation , and that turned out to be exactly what happened. Since that November low, gold has nicely broken through a series of our resistance targets at 1730, 1775, 1875, & 1910. Gold is up up almost 19% from that November low. Looking at the RSI (bottom of chart), gold is technically overbought here, so, we could see a retreat soon, with near-term support at 1875, with 1780 being a strong support level. Next resistance would be 1980

In the interview there was an offer for discounts on the regular rates. See below.

 Trend Letter:
Since start-up in 2002 Trend Letter has provided investors with a great track record, giving exceptionally accurate information about where the markets are going, and it has explained in clear, concise language the reasons why. Using unique and comprehensive tools, Trend Letter gives investors a true edge in understanding current market conditions and shows investors how to generate and retain wealth in today’s climate of extreme market volatility.

A weekly publication covering global bonds, currencies, equities, commodities, & precious metals. Publishes every Sunday evening, covers equites, currencies, precious metals, commodities, and bonds. Each weekly issue is about 50 pages, mostly charts, with key bullet points to make easy to understand. A 10-15 min read

Timer Digest says“Trend Letter has been a Timer Digest top performer in our Bond and Gold categories, along with competitive performance for the intermediate-term Stock category.”


Technical Trader:
Trend Technical Trader (TTT) is a premier hedging service, designed to profit in both up and down markets.

Our hedging strategy empowered  TTT subscribers to not only protect wealth from serious losses during markets crashes, it allowed them to be positioned to make significant gains as markets crashed.

TTT isn’t just a hedging service.  Its timing strategies have returned fantastic gains on the long side. See examples here

Included is our proprietary Gold Technical Indicator (GTI).


Trend Disruptors:
Disruptive technology trends will propel our future and the reality is that no industry will go untouched by this digital transformation. At the root of this transformation is the blurring of boundaries between the physical and virtual worlds. As digital business integrates these worlds through emerging and strategic technologies, entirely new business models are created.

Trend Disruptors is a service for investors seeking to invest in advanced, often unproven technology stocks on the cheap, with the objective to sell them when masses finally catch on. Covering Artificial Intelligence (AI), Virtual Reality (VR), Augmented Reality (AR), 5G, Quantum Computing & many more.

Special Offers

ServiceRegular PriceSpecial PriceSavingSubscribe
Trend Letter$599.95$349.95$250Trend Letter $349.95
Technical Trader$649.95$349.95$300 Trend Technical Trader $349.95
Trend Disruptors$599.95$349.95$250 Trend Disruptors $349.95
Better Deals
Trend Letter + Technical Trader$1,249.90$549.95$699.95 Trend Letter & Technical Trader $549.95
Trend Letter + Trend Disruptors$1,199.90$549.95$649.95 Trend Letter & Trend Disruptors $549.95
Technical Trader + Trend Disruptors$1,249.90$549.95$699.95 Technical Trader & Trend Disruptors $549.95
Best Deal
Trend Suite: Trend Letter + Technical Trader + Trend Disruptors$1,849.85$649.95$1,199.90 Trend Suite: TL + TTT + TD $649.95
Market Notes

Market Notes – January 20/23

Stocks rallied on Friday to finish the week strong after briefly losing the momentum of the January rally.

The Dow Jones Industrial Average added 330.93 points, or 1%, to close at 33,375.49, while the S&P 500 advanced 1.89% to 3,972.61. Both indexes snapped a three-day losing streak. Meanwhile, the Nasdaq Composite rose 2.66%, with help from Netflix and Alphabet, to end the day at 11,140.43.

The Nasdaq was also the outperformer for the week, posting a 0.55% gain and its third positive week in a row. The Dow finished the week lower by 2.70%, and the S&P posted a 0.66% loss, both breaking two-week win streaks.

All of the major averages are still in positive territory for the year.

With the S&P 500, we can see it is forming a wedge pattern and is testing the upper rail, which coincides with the 200-DMA (blue wavy line). That 4000 level is near-term resistance, with 4100 being key resistance. Near-term support sits at 3850, with key support at 3570, which was the Sept & Oct double bottom.

One thing investors should know is that typically, the bottom in the market aligns with when the Fed STOPS CUTTING rates, not STOPS RAISING them. As is clearly evident on the chart below highlighted by the green arrows, in the last few Fed rate cut cycles (2003, 2009 & 2020)  it was when the Fed finished  cutting rates that the stock market started its next bullish move. Aso clearly evident by the red arrows, when the Fed started their rate cuts, the market started to decline.

Many have assumed that the root cause of the inflation problem that we are in today was  the Russian invasion of Ukraine.  But in reality, one of the prime root causes was the amount of government stimulus that was pumped into the economy.  Governments started handing out stimulus cheques like they were candy.  As a result, US personal saving went from $1.45 trillion in late 2019 to a whopping $4.85 trillion in mid 2020. That’s an increase of $3.40 trillion or 234% in just 6 months.

All of the money handed out created new demand…too much money, chasing too few goods. As a result, inflation started to rise dramatically. By the time Russia invaded Ukraine, inflation was already ~8%.

All that increase in personal savings created a whole new group of investors. The Reddit crowd started investing the meme stocks such GameStop and AMC. That infusion of over $3.4 trillion created a ‘wealth effect’ and resulted in the S&P 500 rising over 100% in 2021.

The bond  market continues to ‘fight the Fed’ buying bonds, pushing 10-year yields down, expecting the Fed to PAUSE or even PIVOT soon on their rate increase policy.

Both the Fed and Bank of Canada have stated that they want a ‘positive real rate’, meaning they want the central bank rate HIGHER than the inflation rate. As we can see on the chart below, both Canadian and US real rates are still negative.  The mantra for 12+ years has been ‘don’t fight the Fed.’ Will fighting the Fed work this time?

Stay tuned!

Howestreet Special Offer

In case you missed it, the Trend Letter’s Martin Straith was a guest Friday on Howestreet’s ‘This Week in Money’. The interview with Martin begins at 1:00:17. In the interview Martin disucced the following topics:

  • The AI ChatGPT app
  • How the root cause of the inflation problem started long before the Russian invasion of Ukraine
  • Why the market treat bad news as good news
  • What is happening in the bond markets
  • Currencies: $US, $CAD, Euro, Yen
  • Outlook for gold, silver & oil
  • Key technical triggers for when to buy stocks
  • What will Bank of Canada do this week?
  • What is the biggest obstacle for people being success investors

After the interview Martin offered listeners some Special Pricing for our three services.  We are keeping these offers open for this week. Find them at the bottom of this page.

 Trend Letter:
Since start-up in 2002 Trend Letter has provided investors with a great track record, giving exceptionally accurate information about where the markets are going, and it has explained in clear, concise language the reasons why. Using unique and comprehensive tools, Trend Letter gives investors a true edge in understanding current market conditions and shows investors how to generate and retain wealth in today’s climate of extreme market volatility.

A weekly publication covering global bonds, currencies, equities, commodities, & precious metals. Over the 20 years Trend Letter has been published, it has achieved an incredible average return of 65% on its closed trades.

Timer Digest says“Trend Letter has been a Timer Digest top performer in our Bond and Gold categories, along with competitive performance for the intermediate-term Stock category.”


Technical Trader:
Trend Technical Trader (TTT) is a premier trading & hedging service, designed to profit in both up and down markets. Included is our proprietary Gold Technical Indicator (GTI).

TTT had another excellent year in 2020 averaging +27.3% per closed trade with an average holding time of 9.5 weeks, or +149% annualized overall.

Over the past 5 years TTT’s closed trades have averaged +40% annualized.


Trend Disruptors:
Disruptive technology trends will propel our future and the reality is that no industry will go untouched by this digital transformation. At the root of this transformation is the blurring of boundaries between the physical and virtual worlds. As digital business integrates these worlds through emerging and strategic technologies, entirely new business models are created.

Trend Disruptors is a service for investors seeking to invest in advanced, often unproven technology stocks on the cheap, with the objective to sell them when masses finally catch on. Covering Artificial Intelligence (AI), Virtual Reality (VR), Augmented Reality (AR), 5G, Quantum Computing & many more.

Trend Disruptors has realized average annualized gains of 178% over its 5  years of service.

Special Offers

ServiceRegular PriceSpecial PriceSavingSubscribe
Trend Letter$599.95$349.95$250Trend Letter $349.95
Technical Trader$649.95$349.95$300 Trend Technical Trader $349.95
Trend Disruptors$599.95$349.95$250 Trend Disruptors $349.95
Better Deals
Trend Letter + Technical Trader$1,249.90$549.95$699.95 Trend Letter & Technical Trader $549.95
Trend Letter + Trend Disruptors$1,199.90$549.95$649.95 Trend Letter & Trend Disruptors $549.95
Technical Trader + Trend Disruptors$1,249.90$549.95$699.95 Technical Trader & Trend Disruptors $549.95
Best Deal
Trend Suite: Trend Letter + Technical Trader + Trend Disruptors$1,849.85$649.95$1,199.90 Trend Suite: TL + TTT + TD $649.95


Market Notes

Market Notes – December 28/22

Global stocks are on pace for their worst drop since the 2008 financial crisis. Pessimism around the outlook for financial markets and the economy amid a backdrop of rising interest rates and fears a recession is underway have thrown a wrench in prospects for the seasonal year-end Santa Claus rally markets stocks typically experience at the end of December.

The market was attempting a rally in the early going then word spread that nearly half of the passengers on two separate flights this week from China to Milan tested positive for COVID, and health officials in Italy have announced they will test all travelers coming from the East Asian country. The US has now stated that all passengers arriving from China will be required to test negative.

As a result, the S&P 500 was down 46 points or 1.20%. and has now broken near-term support (horizontal green dotted line).

 Another headwind for the markets was that interest rates have been rising again, which hasn’t helped the equity markets.

Gold has been trying to breakthrough near-term resistance at 1825, but so far, after four attempts has not been able to.  Near-term support is at 1775, and key support sits at 1630, a level that has held the last three times it has been tested (green horizontal dashed line).

Stay tuned!

Howestreet Special Offer

In case you missed it, the Trend Letter’s Martin Straith was a guest on Friday on Howestreet’s ‘This Week in Money’. The interview with Martin begins at 7:56.

After the interview Martin offered listeners some Special Pricing for our three services.  We are keeping these offers open for this week. Find them at the bottom of this page.

 Trend Letter:
Since start-up in 2002 Trend Letter has provided investors with a great track record, giving exceptionally accurate information about where the markets are going, and it has explained in clear, concise language the reasons why. Using unique and comprehensive tools, Trend Letter gives investors a true edge in understanding current market conditions and shows investors how to generate and retain wealth in today’s climate of extreme market volatility.

A weekly publication covering global bonds, currencies, equities, commodities, & precious metals. Over the 20 years Trend Letter has been published, it has achieved an incredible average return of 65% on its closed trades.

Timer Digest says“Trend Letter has been a Timer Digest top performer in our Bond and Gold categories, along with competitive performance for the intermediate-term Stock category.”


Technical Trader:
Trend Technical Trader (TTT) is a premier trading & hedging service, designed to profit in both up and down markets. Included is our proprietary Gold Technical Indicator (GTI).

TTT had another excellent year in 2020 averaging +27.3% per closed trade with an average holding time of 9.5 weeks, or +149% annualized overall.

Over the past 5 years TTT’s closed trades have averaged +40% annualized.


Trend Disruptors:
Disruptive technology trends will propel our future and the reality is that no industry will go untouched by this digital transformation. At the root of this transformation is the blurring of boundaries between the physical and virtual worlds. As digital business integrates these worlds through emerging and strategic technologies, entirely new business models are created.

Trend Disruptors is a service for investors seeking to invest in advanced, often unproven technology stocks on the cheap, with the objective to sell them when masses finally catch on. Covering Artificial Intelligence (AI), Virtual Reality (VR), Augmented Reality (AR), 5G, Quantum Computing & many more.

Trend Disruptors has realized average annualized gains of 178% over its 5  years of service.

Special Offers

ServiceRegular PriceSpecial PriceSavingSubscribe
Trend Letter$599.95$349.95$250Trend Letter $349.95
Technical Trader$649.95$349.95$300 Trend Technical Trader $349.95
Trend Disruptors$599.95$349.95$250 Trend Disruptors $349.95
Better Deals
Trend Letter + Technical Trader$1,249.90$549.95$699.95 Trend Letter & Technical Trader $549.95
Trend Letter + Trend Disruptors$1,199.90$549.95$649.95 Trend Letter & Trend Disruptors $549.95
Technical Trader + Trend Disruptors$1,249.90$549.95$699.95 Technical Trader & Trend Disruptors $549.95
Best Deal
Trend Suite: Trend Letter + Technical Trader + Trend Disruptors$1,849.85$649.95$1,199.90 Trend Suite: TL + TTT + TD $649.95

Market Notes

Market Note – December 23/22

Stock indices finished today’s trading session in the green. The Dow Jones Industrial Average, the S&P 500, and the Nasdaq 100 gained 0.53%, 0.59%, and 0.27%, respectively.

So far, a ‘Santa Claus rally has been missing as the year begins to close.  The failure at the 50-DMA (blue wavy line) has kept short-term downward pressure on the markets.

The technology sector was the session’s laggard, as it gained 0.07%. Conversely, the energy sector was the session’s leader, with a gain of 3.21%. In addition, WTI crude oil gained as it hovers around the mid-$79 per barrel range.

Furthermore, the U.S. 10-Year Treasury yield increased to 3.75%, an increase of more than six basis points. Similarly, the Two-Year Treasury yield also increased, as it hovers around 4.33%.

The only positive is the market didn’t violate Tuesday’s lows, keeping a slight level of support intact. As we have highlighted to subscribers of the Trend Letter,  even if the Fed changes course and stops raising rates, stocks still face more pain ahead. History shows it will not  be enough to simply stop raising rates; every bear market for many decades has ended only when the Fed actively lowered rates.

We continue to suggest using  any rally to reduce risk heading into year-end.

Stay tuned!


Howestreet Special Offer

The Trend Letter’s Martin straith was a guest on Howestreet’s ‘This Week in Money’. The interview with Martin begins at 7:56.

 Trend Letter:
Since start-up in 2002 Trend Letter has provided investors with a great track record, giving exceptionally accurate information about where the markets are going, and it has explained in clear, concise language the reasons why. Using unique and comprehensive tools, Trend Letter gives investors a true edge in understanding current market conditions and shows investors how to generate and retain wealth in today’s climate of extreme market volatility.

A weekly publication covering global bonds, currencies, equities, commodities, & precious metals. Over the 20 years Trend Letter has been published, it has achieved an incredible average return of 65% on its closed trades.

Timer Digest says“Trend Letter has been a Timer Digest top performer in our Bond and Gold categories, along with competitive performance for the intermediate-term Stock category.”


Technical Trader:
Trend Technical Trader (TTT) is a premier trading & hedging service, designed to profit in both up and down markets. Included is our proprietary Gold Technical Indicator (GTI).

TTT had another excellent year in 2020 averaging +27.3% per closed trade with an average holding time of 9.5 weeks, or +149% annualized overall.

Over the past 5 years TTT’s closed trades have averaged +40% annualized.


Trend Disruptors:
Disruptive technology trends will propel our future and the reality is that no industry will go untouched by this digital transformation. At the root of this transformation is the blurring of boundaries between the physical and virtual worlds. As digital business integrates these worlds through emerging and strategic technologies, entirely new business models are created.

Trend Disruptors is a service for investors seeking to invest in advanced, often unproven technology stocks on the cheap, with the objective to sell them when masses finally catch on. Covering Artificial Intelligence (AI), Virtual Reality (VR), Augmented Reality (AR), 5G, Quantum Computing & many more.

Trend Disruptors has realized average annualized gains of 178% over its 5  years of service.

Special Offers

ServiceRegular PriceSpecial PriceSavingSubscribe
Trend Letter$599.95$349.95$250Trend Letter $349.95
Technical Trader$649.95$349.95$300 Trend Technical Trader $349.95
Trend Disruptors$599.95$349.95$250 Trend Disruptors $349.95
Better Deals
Trend Letter + Technical Trader$1,249.90$549.95$699.95 Trend Letter & Technical Trader $549.95
Trend Letter + Trend Disruptors$1,199.90$549.95$649.95 Trend Letter & Trend Disruptors $549.95
Technical Trader + Trend Disruptors$1,249.90$549.95$699.95 Technical Trader & Trend Disruptors $549.95
Best Deal
Trend Suite: Trend Letter + Technical Trader + Trend Disruptors$1,849.85$649.95$1,199.90 Trend Suite: TL + TTT + TD $649.95

Market Notes – November 25/22

  See great Black Friday Specials at end of this post 

Stocks finished mixed during an uneventful, shortened day of trading on Black Friday. When the closing bell rang on Friday, the S&P 500 was down 0.03%, the Dow was up 0.45%, and the Nasdaq fell 0.52%. The US stock market closed at 1:00 p.m. ET on Friday; financial markets in the US were closed on Thursday for Thanksgiving.

In the September 25th issue of the Trend Letter we said to subscribers..’The S&P 500 is oversold here, so another bear market rally is likely.‘ Since then, we have seen most equity markets in a solid rally, with the Dow Industrials leading the way.

The Dow has outperformed the other indexes primarily because it is attracting foreign capital flowing into the US markets. These  are primarily large Institutional investors who prefer to invest in the Blue Chip stocks. Another reason for this rally is we are now in the strongest seasonal period, where there is often a Santa Claus RallyIs this the start of a new bull market? We doubt it.

Net bullishness has been rising as investors think the ‘bottom is in. As noted by the red arrows on the chart below, any reading of the VIX Volatility Index of 20 or below has provided a good signal to take profits and reduce risk. Friday, the VIX closed at 20.50, very close to that signal.

Also, we have shown our subscribers the following chart many times lately. It highlights how BEAR Markets have 4 stages or phases:

Stealth (Smart Money), Awareness (Large Speculators), Mania (retail or the masses) buy in. But after that Mania Phase we get into the Blow off Phase where the market starts to decline. A couple of key characteristics of the Blow-off phase are that we get CAPITULATION & finally DESPAIR. We have NOT seen that yet.

This would tell us that any rally here would be another short-term relief rally,

In early 2000 to late 2002 the Nasdaq had 8 significant rallies within its BEAR market, all over 16%…some over 40%, but still, over that period, the Nasdaq lost 75%of its value.

Friday, the Dow was up ~150 points, just broke through Key Resistance at the August high. We may get a Santa Claus rally, but technically the markets are getting overbought.

Are we headed for a recession?

The Fed, Bank of Canada and most other central banks have put themselves between a rock and a hard place. They are HOPING for a soft landing…to slow inflation, but not crash the economy and send it into a recession. But, while these central bankers hope for a soft landing, there are many indicators that are strongly suggesting a recession is coming.  And sased on the general definition—two consecutive quarters of negative GDP—the US entered a recession in the summer of 2022.

The US Conference Board has its Leading Economic Index, which has been very accurate predicting recession.

In their November report out last week, they stated…

The Leading Economic Index fell for an eighth consecutive month, suggesting the economy is possibly in a recession.’

So, they are suggesting the US is already in a recession.

Another very accurate forecaster of recessions is the yield curve. In the rare situation where the long-term bond yield (say 10 year) earns less than the shorter-term (say 6-month) the yield curve is invertedSince 1955 there has been only one time where the yield curve inverted without there being a recession.

Today, the yield curve is the most inverted it has been since August’81.

Being so inverted suggests that bond investors are convinced the Fed will continue to raise rates to fight inflation.  The Fed will likely need to raise rates at least another 100-bps to the 5%-5.25% range.

Stay tuned!

Special Offers

ServiceRegular PriceSpecial PriceSavingSubscribe
Trend Letter$599.95$349.95$250Trend Letter $349.95
Technical Trader$649.95$349.95$300 Trend Technical Trader $349.95
Trend Disruptors$599.95$349.95$250 Trend Disruptors $349.95
Better Deals
Trend Letter + Technical Trader$1,249.90$549.95$699.95 Trend Letter & Technical Trader $549.95
Trend Letter + Trend Disruptors$1,199.90$549.95$649.95 Trend Letter & Trend Disruptors $549.95
Technical Trader + Trend Disruptors$1,249.90$549.95$699.95 Technical Trader & Trend Disruptors $549.95
Best Deal
Trend Suite: Trend Letter + Technical Trader + Trend Disruptors$1,849.85$649.95$1,199.90 Trend Suite: TL + TTT + TD $649.95


Market Notes

Is this the start of a new bull market?

What a day in the markets.  This morning, the US published its latest official inflation reading, and it came in better than Wall Street expectations for the first time since this whole inflation trend began. The market’s reaction was immediate, sending the S&P 500 up ~4% and the tech heavy Nasdaq up over 6%. And that buying frenzy continued throughout the day, with the S&P 500 closing the day up over 5.5% and the Nasdaq up 7.35%.

The logic behind this massive rally, the biggest one since coming out of the Covid crash in 2020, was that with inflation seemingly having peaked, then the Fed would start to ‘pause’ on their rate raises. Markets are always forward looking, so with today’s inflation data, the markets jumped on that lower rate theme.

So, the big question now is, have we seen the bottom of this bear market? Could be, but we doubt it. Here is a chart that we have shown our subscribers a few times over the last couple of months.  It shows the 4 phases of a bear market:

  1. Stealth –  where the Smart Money enters the market
  2. Awareness  – sees Large Speculators enter the market
  3. Mania – this is where the retail or what we like to call the Masses buy in
  4. Blow-off – Where the market starts to turn down

At the top of the mania phase, everyone wants in, even those who haven’t ever followed the stock market…FOMO – Fear Of Missing Out. The 2021 REDDIT crowd pushing up ‘meme’ stocks like GameStop and AMC was a classic example of a Mania Phase top.

The Blow-off phase is where we get investors fall into denial, hoping the market rallies back to the highs, but it just keeps going lower. Then capitulation kicks in and ultimately, we get despair at ‘the bottom.’

When we look at those phases and overlay the current S&P 500 chart, it suggests we are the Blow-Off phase.

This would tell us that any rally here would be another short-term relief rally, maybe a few weeks, even a month.

We still need to see ‘capitulation’ and ultimately ‘despair’ kick in to finally hit the bottom

So based on all that, we would suggest we are still in a bear market. Now that doesn’t mean we can’t have a solid rally through year-end, but until we hit that capitulation and despair, we are not likely to hit bottom just yet.

Here is another chart we keep showing subscribers to remind them how volatile bear markets can be. It shows how from early 2000 to late 2002 the Nasdaq had 8 significant rallies, all over 16%, but still, over that period, the Nasdaq lost 75% of its value.

So, while we could certainly see a strong rally here, be aware of how bear markets usually end in capitulation and despair.

Stay tuned!

Market Notes

Market Notes – October 28/22

US equities rallied Friday, as an earnings beat from Apple helped stocks push their way past a week of Wall Street misses for Big Tech.

The S&P 500 gained 2.5%. The Dow Jones Industrial Average bounced more than 800 points, or 2.6%, to a two-month high, as it also notched a fourth-straight week of gains and its best week of the year. The tech-heavy Nasdaq Composite rose 2.9%. The moves came even as Treasury yields climbed back above 4%. The  Dow closed October  as the best month for in 46 years and the best October ever.

For the S&P 500, we see this as a near-term relief rally. Next week we get the Fed rate hike announcement and it will be interesting to see if they raise by the expected 75-bps, or if they follow the Bank of Canada lead and only raise by 50-bps. If they only raise 50-bps we should see a boost to the markets.

The US has its mid-term election on November 8, so the result of that could also have a big impact on the markets, especially if the Republicans gain control. Our initial target for this rally was at the 100-DMA at 3903. Today’s close at 3901.06 is very close to that initial target.

We are still in a bear market, although we are now in the strongest seasonal period, from mid October to almost May. Bear markets typically have 4 stages or phases:

  1. Stealth –  where the Smart Money enters the market
  2. Awareness  – sees Large Speculators enter the market
  3. Mania – this is where the retail or what we like to call the Masses buy in
  4. Blow-off – Where the market starts to turn down

At the top of the mania phase, everyone wants in, even those who haven’t ever followed the stock market…FOMO – Fear Of Missing Out.  The 2021 REDDIT crowd pushing up ‘meme’ stocks like GameStop and AMC was a classic example of a Mania Phase top.

When we look at those phases and overlay the current S&P 500 chart, it suggests we are the Blow-Off phase.  This would tell us that any rally here would be another short-term relief rally, maybe a few weeks, taking us the US election on Nov 8th. We still need to see ‘capitulation’ and ultimately ‘despair’ kick in to finally hit the bottom. Once we see that, we will be firing out BUY Alerts to subscribers

Stay tuned!


We  publish 3 investment services:

  • Trend Letter – Started that back in 2002, so over 20-years ago publishes every Sunday, covers equites, currencies, precious metals, commodities,& bonds.
  • Each weekly issue is about 50 pages, mostly charts, with key bullet points to make easy to understand
    – Focus is for longer term investors who want to get a better understanding of what drives these markets
  • Trend Technical Trader – Online service that started as a hedging service, which has been a very timely service this year helping subscribers protect their wealth during this nasty bear market. It also now covers many sectors including commodities, equities & precious metals
  • – Focus here is for more active investors but long-term investors can also benefit, especially with these hedging strategies
  • Trend Disruptors – a monthly publication with new disruptive ideas in Artificial Intelligence, Virtual Reality, Augmented Reality, 5G, Cloud, Internet of Things etc.  Very speculative sector and we have not added any new recommendations in this bear market, but are building our Watch List which is at about 25-30 companies right now
    – Focus on those wishing to speculate, with risk capital they can afford to lose.

Special Offers

ServiceRegular PriceSpecial PriceSavingSubscribe
Trend Letter$599.95$349.95$250Trend Letter $349.95
Technical Trader$649.95$349.95$300 Trend Technical Trader $349.95
Trend Disruptors$599.95$349.95$250 Trend Disruptors $349.95
Better Deals
Trend Letter + Technical Trader$1,249.90$549.95$699.95 Trend Letter & Technical Trader $549.95
Trend Letter + Trend Disruptors$1,199.90$549.95$649.95 Trend Letter & Trend Disruptors $549.95
Technical Trader + Trend Disruptors$1,249.90$549.95$699.95 Technical Trader & Trend Disruptors $549.95
Best Deal
Trend Suite: Trend Letter + Technical Trader + Trend Disruptors$1,849.85$649.95$1,199.90 Trend Suite: TL + TTT + TD $649.95
Market Notes

Market update – October 7/22

Markets tanked again today after US employment data showed 263,000 new jobs, leaving the US labour market conditions very tight as the unemployment rate dropped to just 3.5%.  This crushed any hopes the Federal Reserve will pivot anytime soon on its aggressive rate hiking path.

As a result, the S&P 500 dropped 104.86 points or 2.80%.

With this quick turnaround, the September 30th low becomes key support. The bearish (negative) sentiment remains extreme so that 3585 level should hold, allowing for another relief rally. The target high for any rally here would be the 100-DMA level, around 3950.  Trend Letter subscribers will get a complete update on Sunday covering stock, precious metals, commodities, currencies and bonds – it  is all connected.

There are a lot of reasons for the markets to continue lower before we ultimately see the bottom. If you do not have a hedging strategy in place, seriously consider subscribing to Trend Technical Trader (TTT). Although TTT now covers many sectors, it was originally designed as a hedging service, giving subscribers several strategies to protect their portfolios in down markets like we are experiencing now.  We will keep our Special Offer open this weekend for those who want to understand what is happening in the markets and how to apply effective hedging strategies.


We are offering some special rates to our subscriptions.

 Trend Letter:
Since start-up in 2002 Trend Letter has provided investors with a great track record, giving exceptionally accurate information about where the markets are going, and it has explained in clear, concise language the reasons why. Using unique and comprehensive tools, Trend Letter gives investors a true edge in understanding current market conditions and shows investors how to generate and retain wealth in today’s climate of extreme market volatility.

A weekly publication covering global bonds, currencies, equities, commodities, & precious metals. Over the 20 years Trend Letter has been published, it has achieved an incredible average return of 65% on its closed trades.

Timer Digest says“Trend Letter has been a Timer Digest top performer in our Bond and Gold categories, along with competitive performance for the intermediate-term Stock category.”


Technical Trader:
Trend Technical Trader (TTT) is a premier trading and hedging service, designed to profit in both up and down markets. Included is our proprietary Gold Technical Indicator (GTI).

TTT had another excellent year in 2020 averaging +27.3% per closed trade with an average holding time of 9.5 weeks, or +149% annualized overall.

Over the past 5 years TTT’s closed trades have averaged +40% annualized.


Trend Disruptors:
Disruptive technology trends will propel our future and the reality is that no industry will go untouched by this digital transformation. At the root of this transformation is the blurring of boundaries between the physical and virtual worlds. As digital business integrates these worlds through emerging and strategic technologies, entirely new business models are created.

Trend Disruptors is a service for investors seeking to invest in advanced, often unproven technology stocks on the cheap, with the objective to sell them when masses finally catch on. Covering Artificial Intelligence (AI), Virtual Reality (VR), Augmented Reality (AR), 5G, Quantum Computing & many more.

Trend Disruptors has realized average annualized gains of 178% over its 3 years years of service.

Special Offers

ServiceRegular PriceSpecial PriceSavingSubscribe
Trend Letter$599.95$349.95$250Trend Letter $349.95
Technical Trader$649.95$349.95$300 Trend Technical Trader $349.95
Trend Disruptors$599.95$349.95$250 Trend Disruptors $349.95
Better Deals
Trend Letter + Technical Trader$1,249.90$549.95$699.95 Trend Letter & Technical Trader $549.95
Trend Letter + Trend Disruptors$1,199.90$549.95$649.95 Trend Letter & Trend Disruptors $549.95
Technical Trader + Trend Disruptors$1,249.90$549.95$699.95 Technical Trader & Trend Disruptors $549.95
Best Deal
Trend Suite: Trend Letter + Technical Trader + Trend Disruptors$1,849.85$649.95$1,199.90 Trend Suite: TL + TTT + TD $649.95

This Week in Money Notes

Martin was the guest on This Week in Money with Jim Goddard and they covered a wide range of topics. Below are notes from that interview. To listen to the interview, click here.  The interview starts at 13:30.

Q. What is the market sentiment?

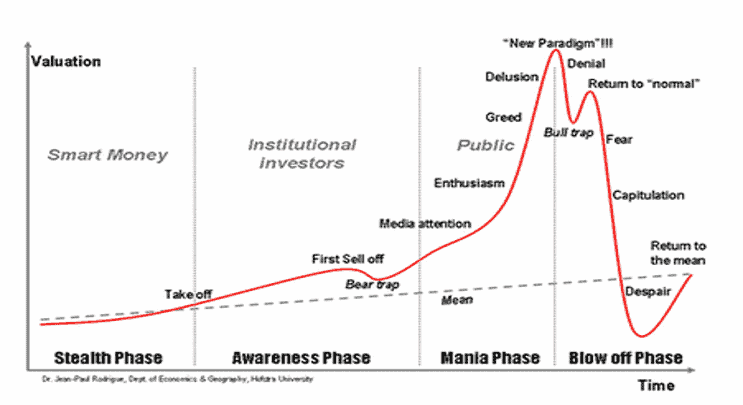
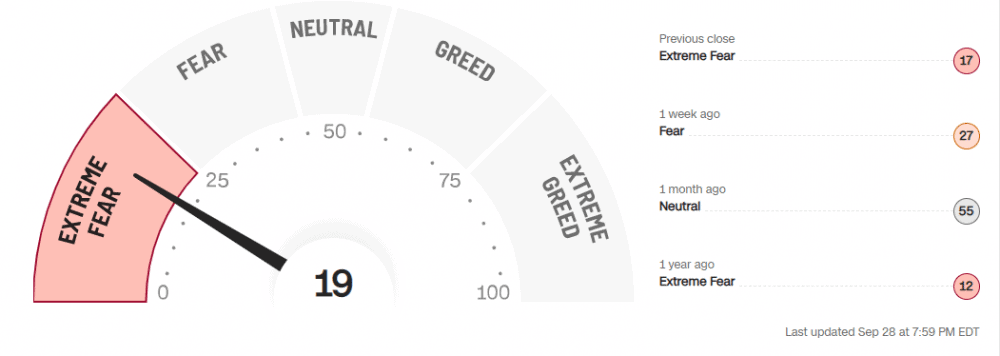
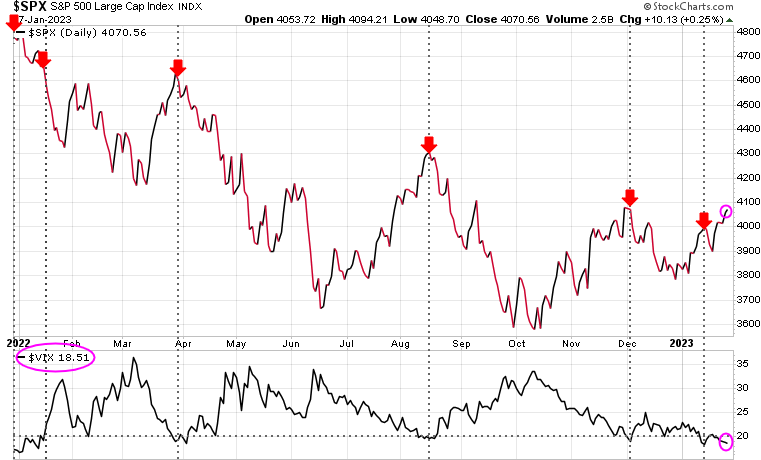
Wow…how about frightful, panicked? We had the Fear/Greed index at Extreme Fear

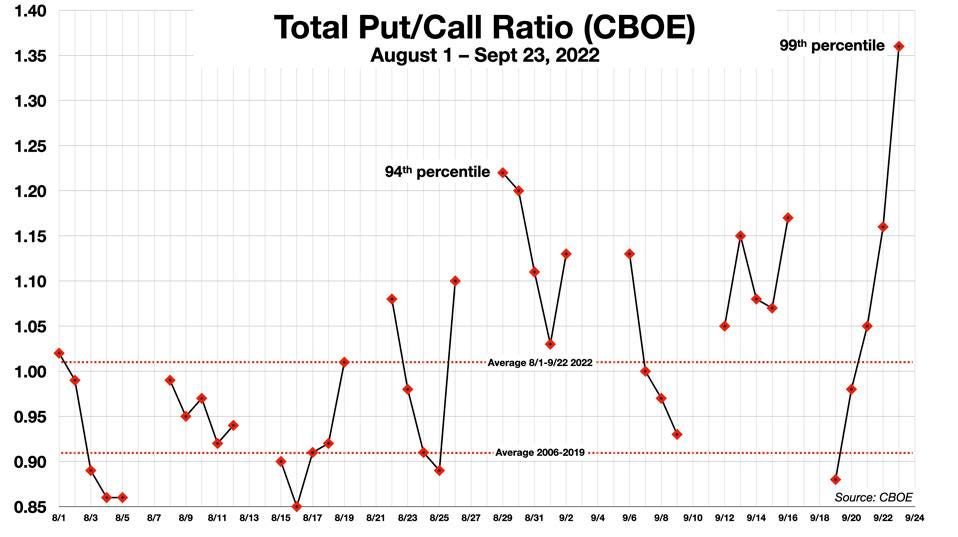
Put/Call ratio also at extreme high

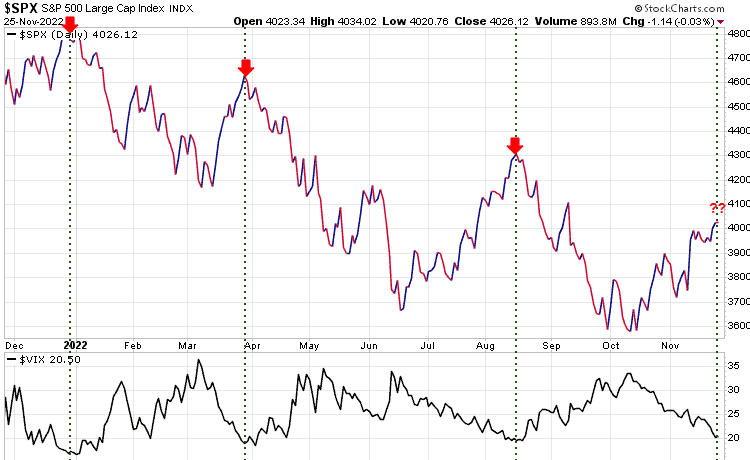
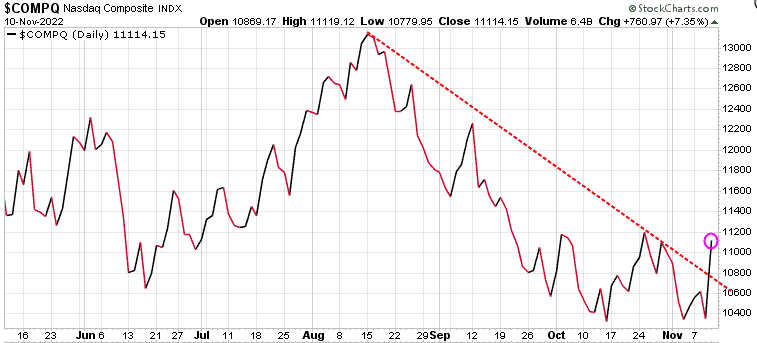
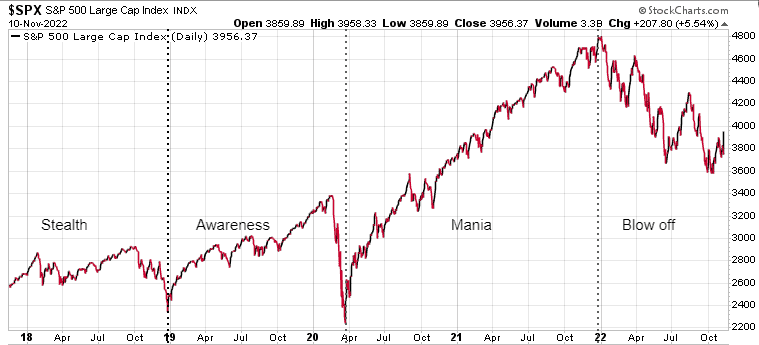
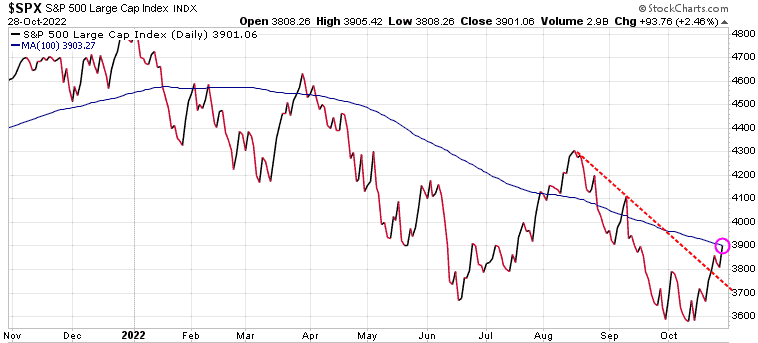
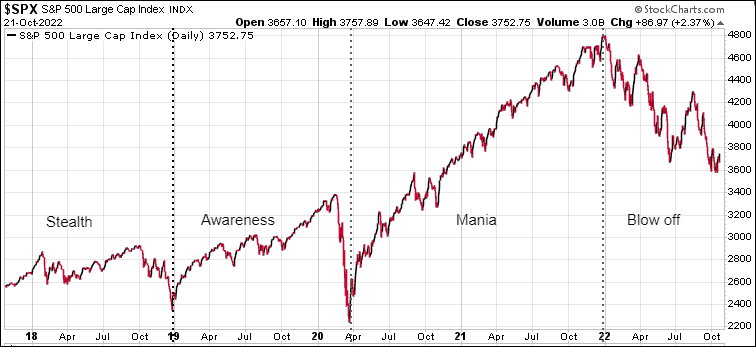
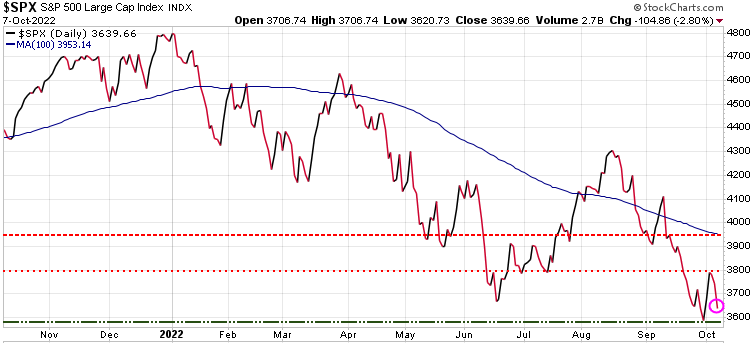
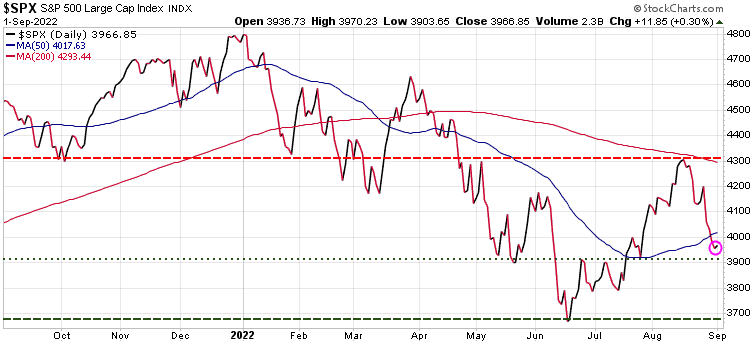
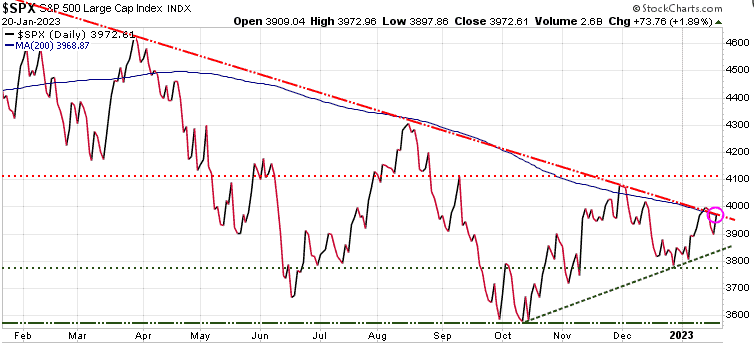
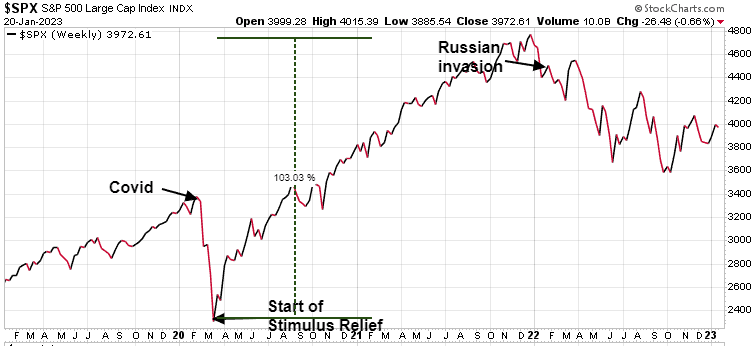
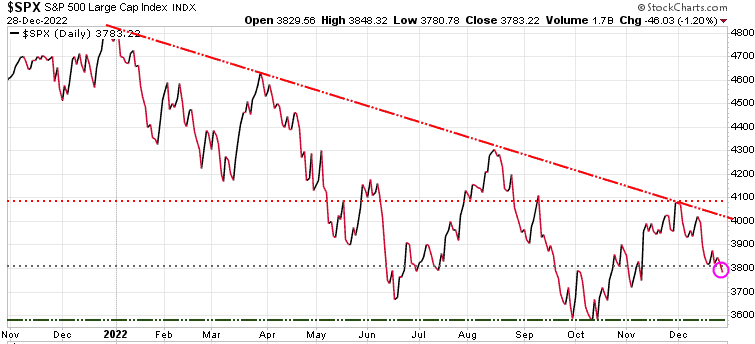
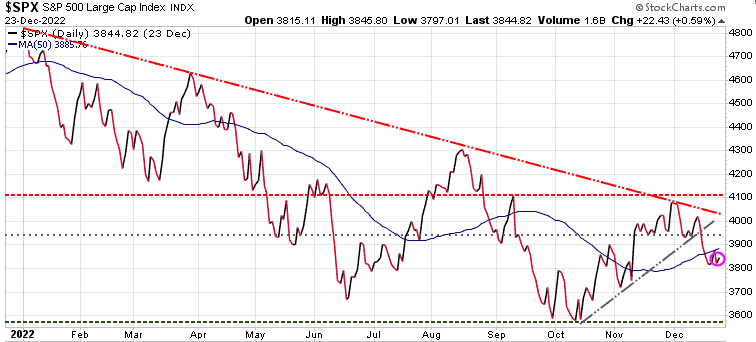
S&P 500 down ~25% since January, tested June low this week, at the 3640 level & pushed lower. Short-term…relief rally likely as market is oversold (RSI on bottom of chart).

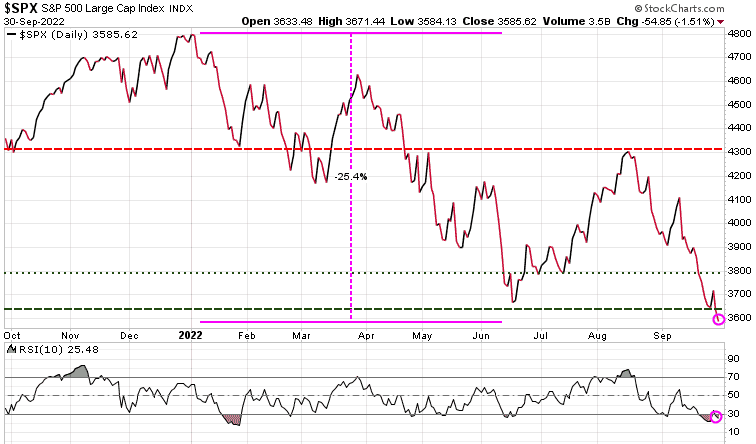
Watch for a rally to the 100-dma at 3965 range

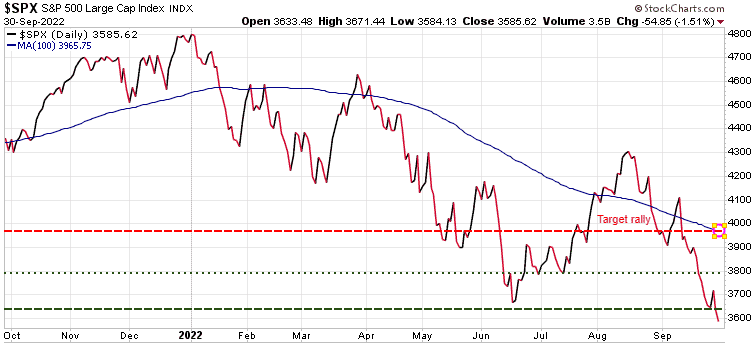
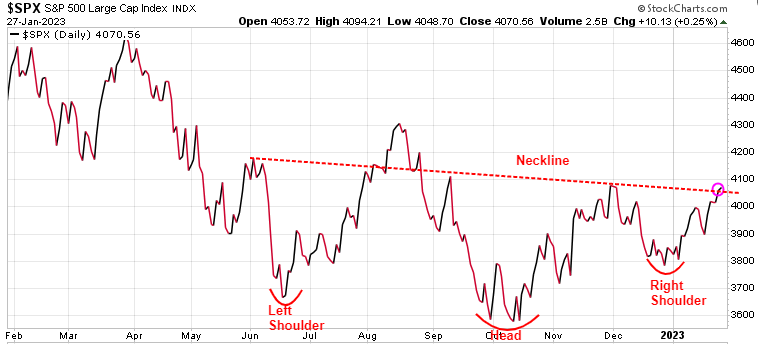
Q. Does it look like stock markets have put in a double bottom ?

Possible…NOT Likely. More likely is that Short-term rally I just mentioned…relief rally to 3970. Then we expect another leg down, where hedge positions would be prudent.

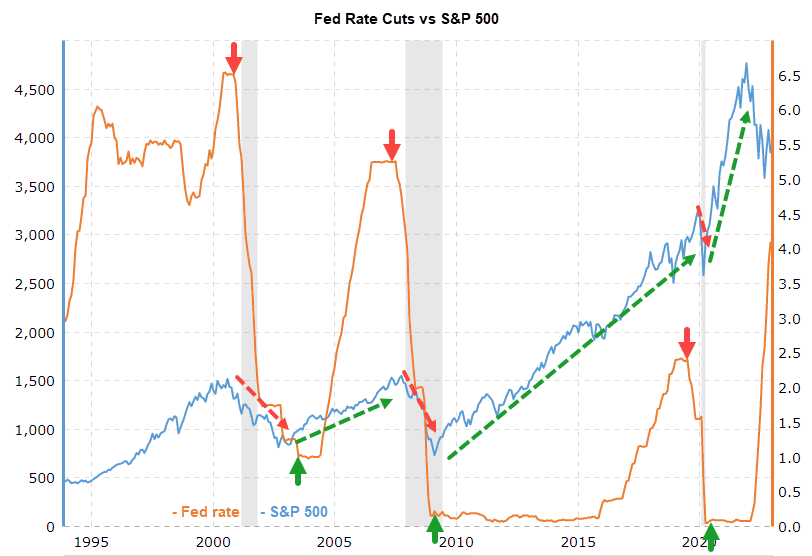
The problem is that over the past 15 years, most investors have been conditioned to the Fed coming to the rescue on the slightest economic weakness, we have a US election which creates pressure for Fed to continue to fight inflation vs save stocks. Democrats say they are there for lower & middle class…not many lower class heavy into stock market.

Central banks will continue to raise rates & reduce balance sheets – opposite the conditions that fueled bull market.

Many are waiting for the Fed to ‘pivot’& become ‘dovish’ – not happening anytime soon.

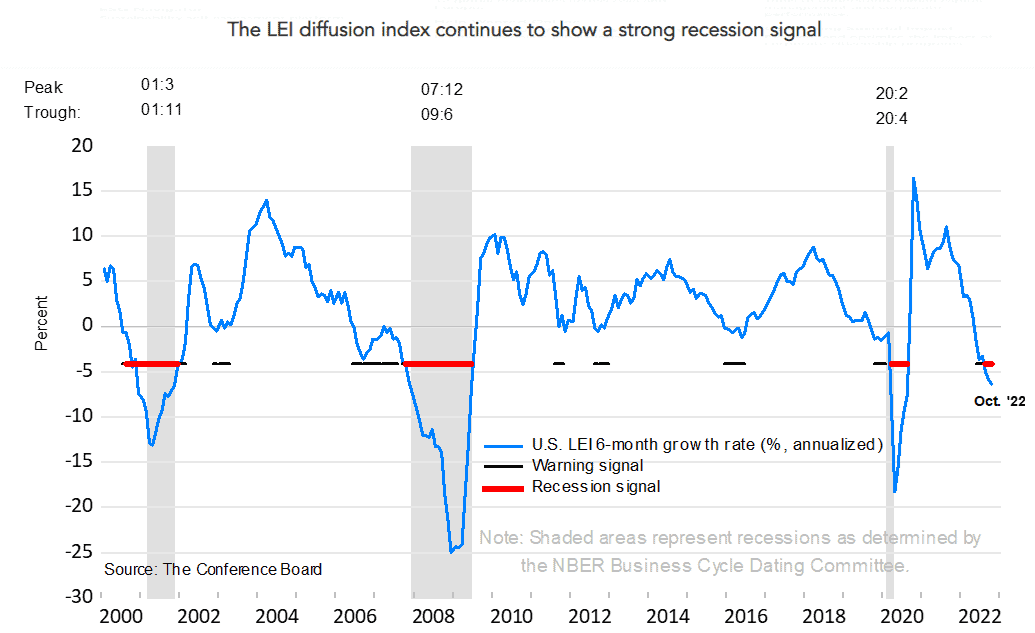
Market drivers: inflation, rising rates, slowing global economy, likely recession.

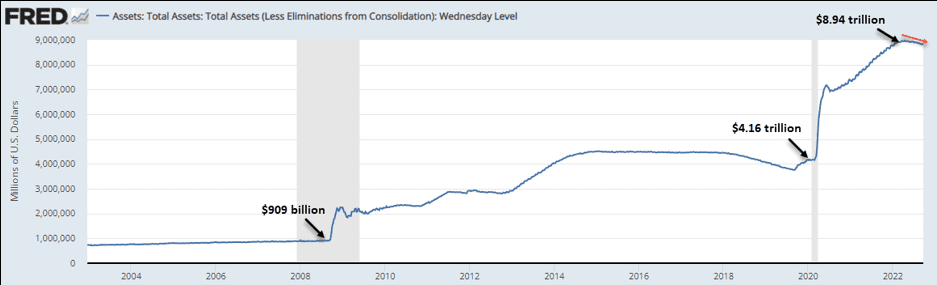
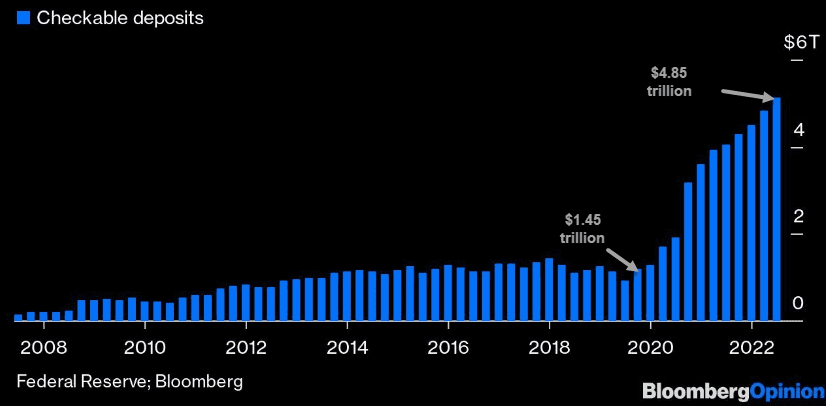
During 10-year bull market, Fed was keeping rates near 0% for over a decade. They also added $Trillions to balance sheet…from $900 billion in 2009 to ~$9 trillion this year

TODAY…they rising rates, currently 3.25% in US & Canada, plus QT, where the Fed is now SELLING $95 billion of bonds each month

Economy slowing…US just had 2 consecutive negative growth quarters. Last time that happened & there was NO recession was 1947

Recession is coming, & will escalate the bear market.

Look to use this next relief rally to reduce risk, add hedge strategies. Don’t fight the Fed!

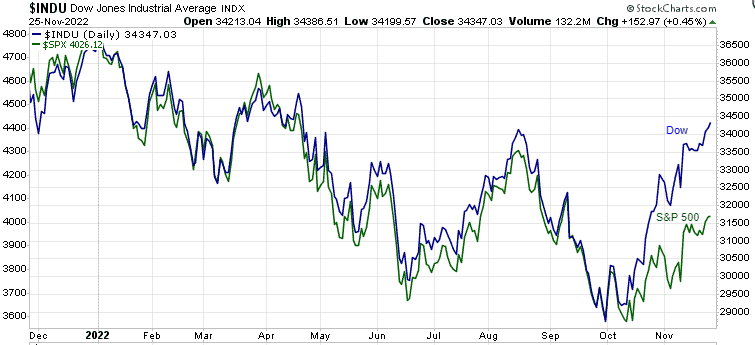
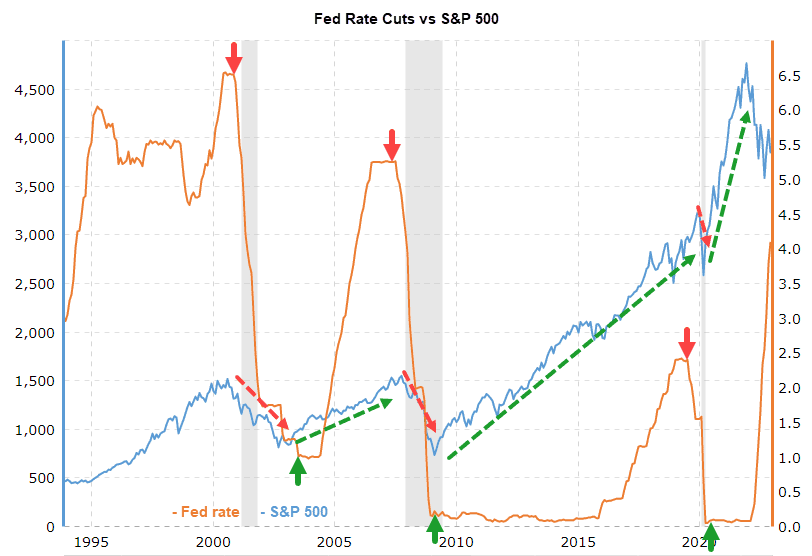
Q. Do stock markets tend to rise alongside interest rates?

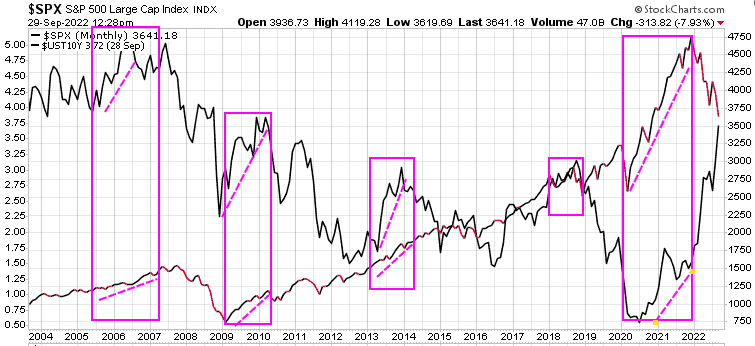
To many people’s surprise – they can rise together.

Low, steady predictable inflation is a a good sign for an economy, it means that the economy is growing. Employment is rising, wages are rising as well.

So,  many times we have seen interest rates & stocks rise together…2005-07, 2009-10, 2013-14, 2018, 2020 -2022

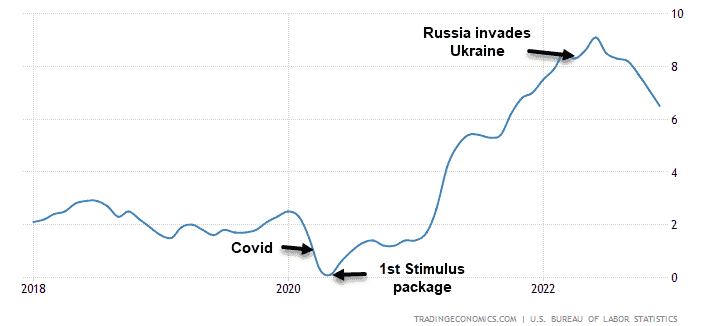
The problem today is inflation jumped too high, way too fast. The Fed had been trying to juice the economy for over a decade trying to get inflation up to 2%. Central banks flooded the markets with $trillions of QE programsAdd the supply chain issues due to global COVID lockdowns…then add the Russian invasion of Ukraine. Perfect storm!

Inflation rising too fast

Central banks scrambling to catch up

Rates rising so fast

Investors are spooked

Result…Markets crashing as rate soar

Q. What do you see ahead for stock markets heading into 2023?

Well, if we get a recession,  then that will hurt the equity markets. In recessions, people hold back, prices are falling, why buy now, wait for cheaper prices. That hurts companies, lower sales, less profit etc.

It will really depend on the central banks, particularly the Fed

Today the Fed is signalling there are all-in on crushing inflation

Key point … what do they do when they see that they are also crushing the economy? They are really between a rock & a hard place

Debt levels held by governments, & homeowners is extremely high. High rates are hurting everyone.

After the US election, we will see the Fed come under increasing pressure to ease off the rate increases

We see inflation as being ‘sticky’ lingering longer than most expect

But as soon as the market senses the Fed might ‘pivot’, ease off the rate increases, we will see the markets jump. The markets are forward looking.

The is a saying on Wall Street.. ; “Central Banks decide when to raise rates, markets decide when to lower them.”

We suspect that around March/April we will see the Fed ease up

We do expect to see lower lows in the stock markets, but we have our lists of stocks that we will be looking to jump into when our models give the BUY signal

Understand, this bear market could last well into 2023 if not longer

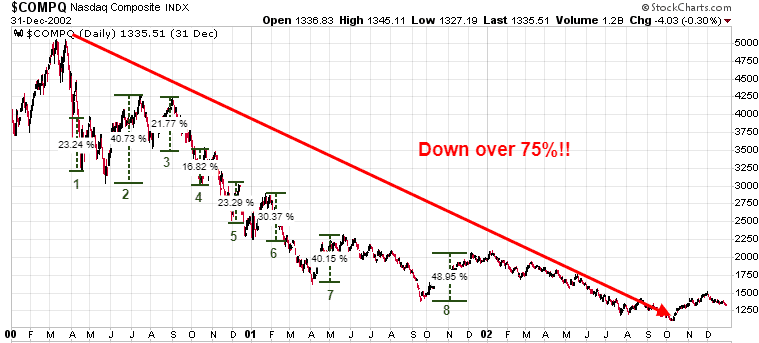
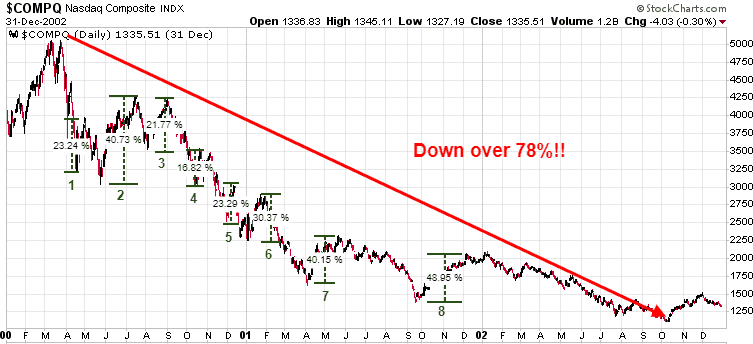
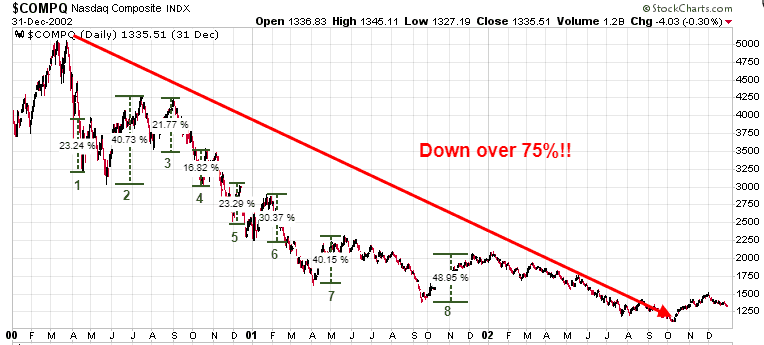
From early 2000 to mid 2002, the NASDAQ had 8 strong relief rallies over 15%, but lost over 75% during that bear market.

For be careful, watch the technical charts – that’s what we do!

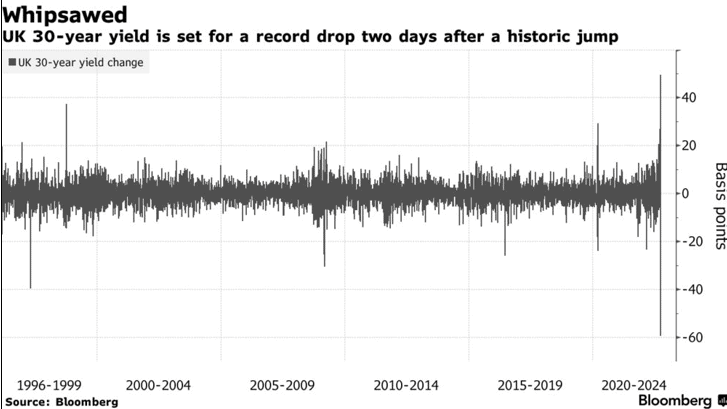
Q. Is Britain’s central bank in trouble ?

Like all central banks, the Bank of England is fighting inflation. But when the new UK government lowered taxes, the market reacted negatively, seeing the move as inflationary (which all government stimulus is).

That created a ‘panic’ that BoE would have to raise rates higher & faster. Investors then started dumping the British long bonds. That created potential real problems for UK Pension Funds, as these UK funds were buying bonds on leverage. As bond prices fell, Pension Funds had to liquidate to meet margin calls, driving bonds even lower.

BoE had to step in to ‘stabilize’ the British bond market. When bonds sell off, it threatens a country’s ability to borrow. This is a BIG global concern.

We have been warning of a coming global sovereign debt crisis for years & this event in the UK tells us we are getting closer to that reality.

When the public loses confidence in government’s ability to manage the economy, they will question if they want to own government bonds.

Once we see the first sovereign debt default, we will see contagion..investors will then look around and ask ‘who’s next’??

We have warned our subscribers to stay out of long-term government bonds, short-term is ok, but not long-term.

What just happened in Britain is just a glimpse of what we are going to see on a big scale soon. Europe is primed for this disaster.

By keeping their rates negative for so long, the ECB has destroyed the European bond market

Q. How high do you think The Fed could take interest rates ?

Predicting what central banks will do is a real challenge because they are almost always wrong is their forecasts

The US federal Reserve has over 400 PhDs & a budget of over $6 billion, yet, with all those resources, they said inflation was ‘transitory’. If you look at all of their forecasts, they are almost ALWAYS wrong.

One of the real challenges for central banks fighting inflation is that their governments keep piling on more stimulus, which itself is inflationaryThe Biden administration passed their 796 page Inflation Reduction Act… but it is full of stimulus spending..inflationary. The Trudeau government is doing the same thing, they keep increasing government spending, while the Bank of Canada is trying to fight inflation.

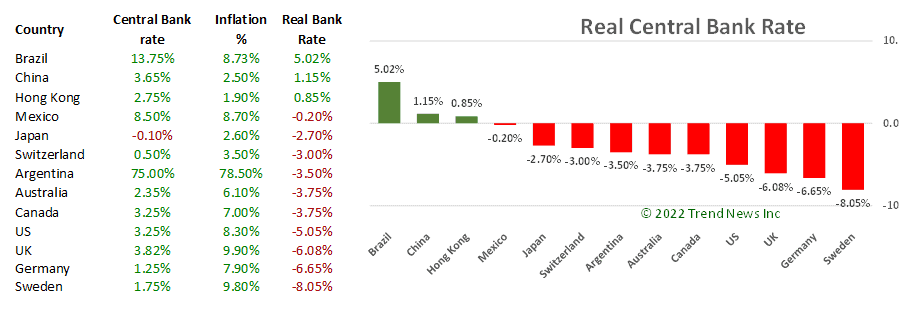
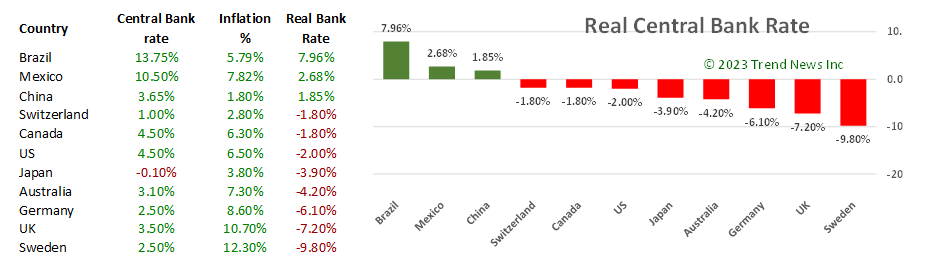
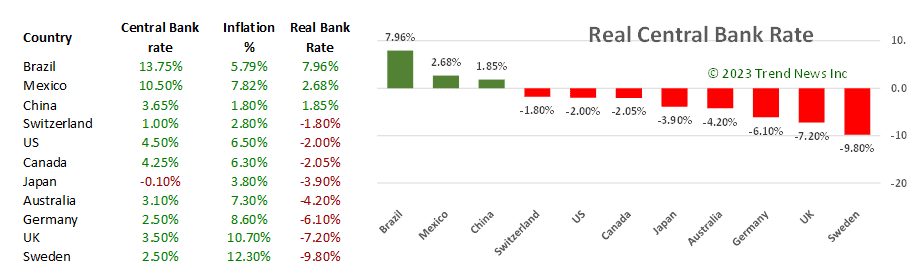
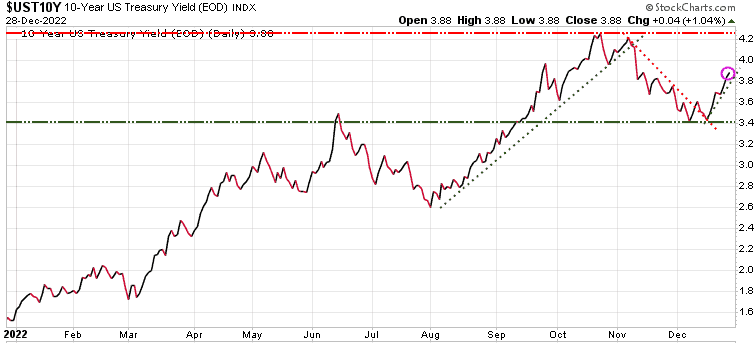
Jerome Powell recently stated that they expect to raise rates to 4.6%, from the current rate of 3.25%. Powell says benchmark lending rate must be higher than the inflation rate, or until “real” rates are positive.

The Fed rate is now 3.25% & depending what inflation figure used CPI (Consumer Price Index) at 8.3% or PCE (Personal Consumption Expenditures which doesn’t include food or energy) at 6.3%, the REAL fund rate is ~-3.0% – -5.0%

So, if he sticks to his guns, he will need to keep raising till they get to 0% REAL rate. A combination of lower inflation & higher rates will need ot happen.

Employment rate is another key factor but so far, US unemployment at historic low levels.

While there is lots of noise that the Fed has to back off to save the stock markets, I think they will continue to raise rate until they are at lease close to 0%  REAL Fed rate.

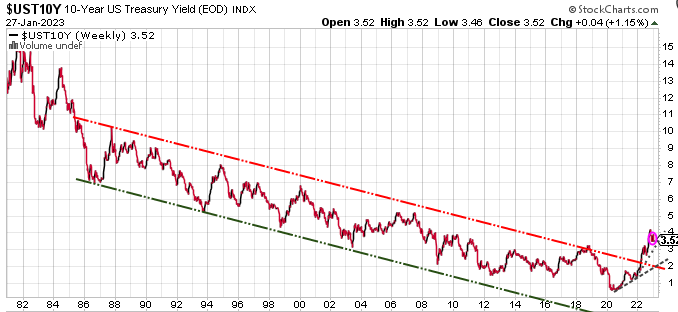
Q. Could the Bond Market Bubble be bursting ?

  • It’s a great question
  • Governments need to sell bond to finance their massive deficits & debts
  • The problem for bonds is as rates rise, the bond prices fall & no one wants to buy a falling asset
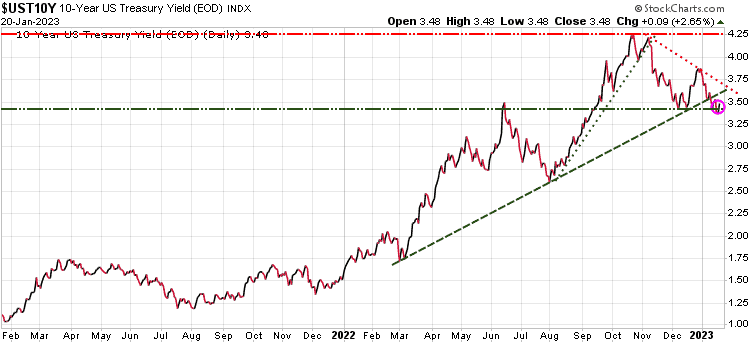
  • In Canada, a 10-year bought a year ago pays 1.2% yield vs the 7% inflation…losing 5.8% each year

for another 9 years

Today Canadian 10-year is paying ~3.0%, with 7.0% inflation, still a negative return of ~4.0%

So, why own these bonds when you are losing purchasing power every year for 10 years??

Central banks have been the major purchasers of their own bonds for over a decade…to keep rates low

The Fed was buying $120 billion bond per month ($80 bln in Treasuries, $40 bln in MBS)

BUT, now they have committed to shrinking those holdings by $95 billion per month

The big question is.. ‘Who is going to step in and fill that massive void’???

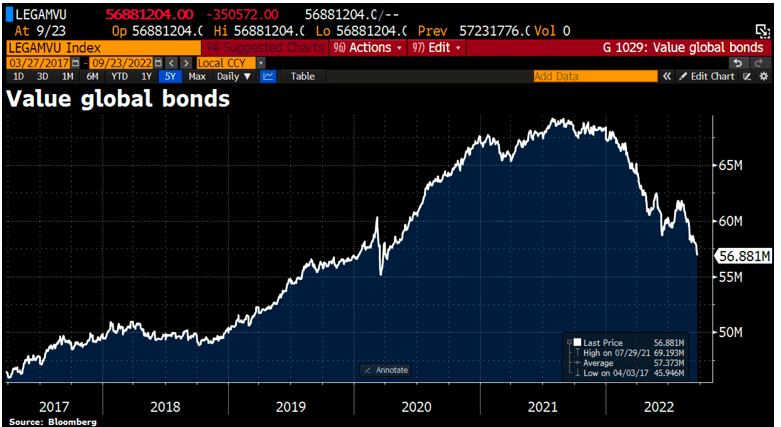
The value of global bonds has plunged by another $1.2 trillion last week

The total loss from the all-time high is now $12.2 trillion

We have been warning of a global sovereign debt crisis for years & we are certainly getting closer to that reality.

When the public loses confidence in government’s ability to manage the economy, they will question if they want to own government bonds. Once we see the first sovereign debt default, we will see contagion.

Investors will then look around and ask ‘who’s next’??

We have warned our subscribers to stay out of long-term government bonds.

Short-term is ok, but not long-term.

So, what just happened in Britain is just a glimpse of what we are going to see on a big scale soon

And Europe is prime for this disaster

By keeping their rates negative for so long, the ECB has destroyed the European bond market.

Q. Is the Bank of Canada likely to continue raising rates ?

The Bank of Canada has been very aggressive in raising rates. It was the first of the top 10 countries to hit 3.25%

Very focused on bringing down inflation

The REAL Bank Rate in Canada I -3.75% (3.25% rate – 7% rate of inflation)

Much like the Fed, BoC needs to see inflation drop & rates rise until they get close to a 0% gap

We suspect the Bank of Canada will pretty much keep in step with the US Fed.

Q. Does it look like the US Dollar put in a top this week ?

The $US has been driving all markets. A strong $US means weaker other currencies, assets, & commodities.

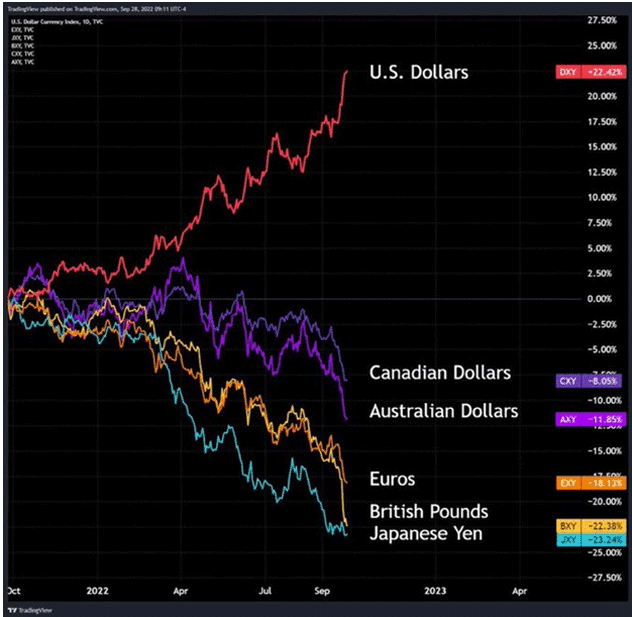
$US higher = lower $CAD, copper, oil, gold etc.

$US …hit a 20-year high.

$Can down ~12% since Jun’21 high from .83 to .73

Pound down to 37-year low

Yen at 24-year low

18 months ago we predicted the Euro would be at par in 2 years…it only took 18 month

Last week we told subscribers that Near-term, the $US was overbought & overdue for a pullback.

Central banks such as BoJ, ECB are looking to slow the rise of $US by selling US debt & $US. That boosts other currencies & asset classes,

Expect a pullback in the $US to last a few weeks

Longer-term we see the $US trading up to the 120 level

For $CAD we have .72 as near-term support & if that fails, .68 is next target

Note that currency moves tend to run longer than seems logical.

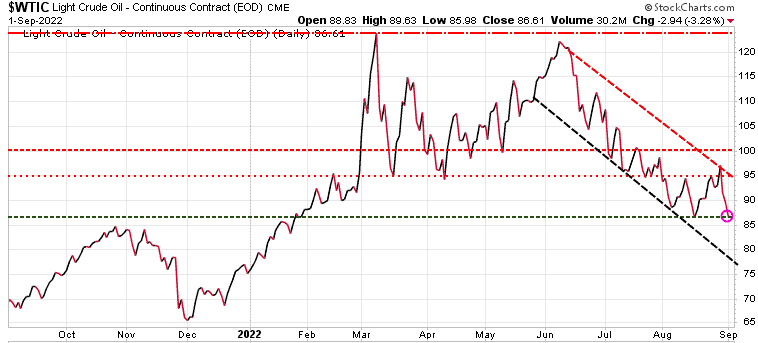
Q.at do you see ahead for Crude Oil and Gasoline ?

For oil we see much higher prices in 2023.

Governments all over are pumping ‘anti-inflation’ packages which are inflationary & ultimately will keep demand high.

There is a saying ‘the solution to high oil prices is high oil prices’.

On the supply side the US Strategic Reserve is being depleted, was supposed to end in October, but they have pushed that back to after the election.

Windfall taxes, severe regulations are major disincentives for produces to invest

So long term we see oil up in the $150-$200 level in the next year

Very short-term oil could rise if we see a pullback in the $US

Then recession & China shutdowns to push demand down

That could push oil below $70

When we get a BUY signal from our models, we will be sending out ALERTS to subscribers.

Q. Automakers are making more and more electric vehicles. Is this bullish for the battery metals ?

Eventually!!

What I mean by that is that in a recession, combined with a strong $US, commodities are getting hit. But once we get through all that, yes battery metals & all commodities related to building EVs plus all the infrastructure will do well.

Just for reference. A single industrial-size wind turbine can require as much as three metric tons of copper and permanent magnets composed of rare earths.

Complicated formula as the pro-green activists that want to push for green only vehicles, also don’t want any mining – they haven’t quite figured out the connection just yet.

Plus, we need to create a whole new power gird that can handle intermittent power

When the sun don’t shine & the wind don’t blow…there is no power.

You can’t just wish  for a green economy. That can be the objective, but you need a detailed, sustainable PLAN to actually achieve it..

My background is in systems & project management.

It is mind boggling to me there doesn’t seem to be a coordinated, sustainable transition PLAN to go total green.

All we hear are these dreams of total green in 8 – 12 years

We can’t just shut down fossil fuels & put everyone in an EV & expect to have the power to charge these vehicles

California is already having severe power issues & told EV owners to refrain from charging their vehicle

What happens when there are another 10 million EVS on the streets in California?

Did no one in these meetings on green energy put up their hands and ask how are we getting there??

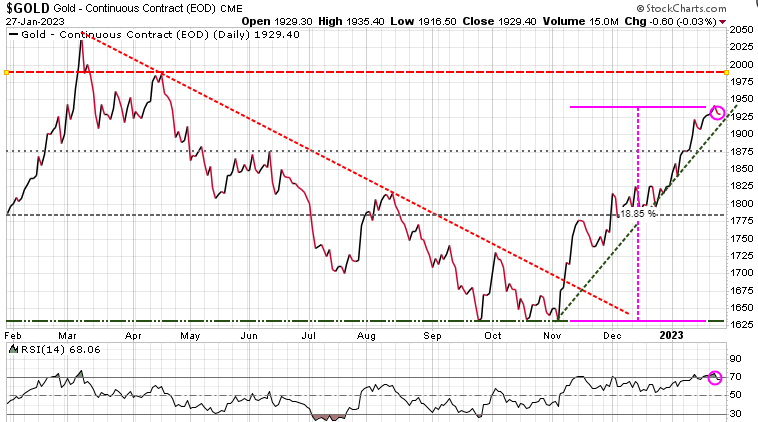
Q. What are your thoughts on Gold ?

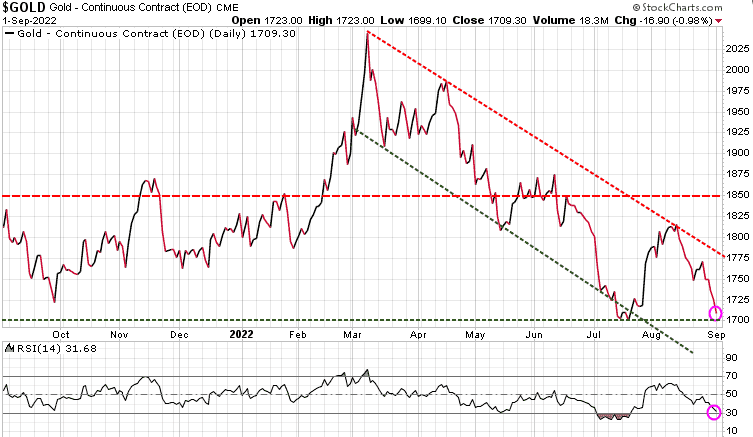
Precious metals have been very frustrating since March, not being an inflation hedge at all

The $US strength has been the massive headwind for gold, as are new higher yields on bonds.

Gold broke below key support at 1675& as now recovered back to that level. Coming off an oversold technical levels so a rally here is likely

Our models have signalled gold is due for a sustained rally in the fall, so this could be the start

Needs to break above 1700, 1740, 1815

Compared to the commodity index gold has been crushed

But since June, gold is trying to turn that ratio around

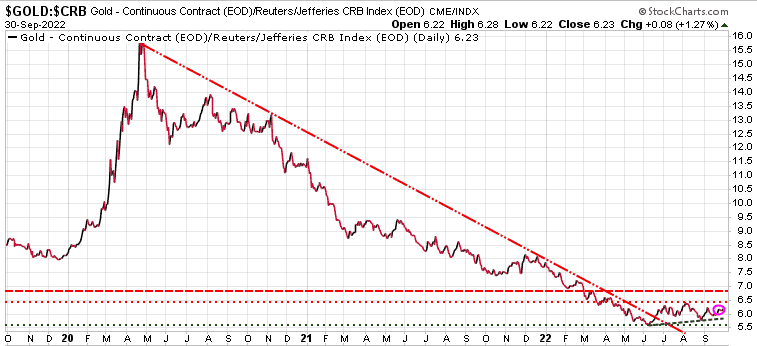
If it can form a bottom here, then it could lead to a solid rally

We like gold & silver at these levels…we have given subscribers about 5 plays for gold & silver

GDXJ would be a consideration

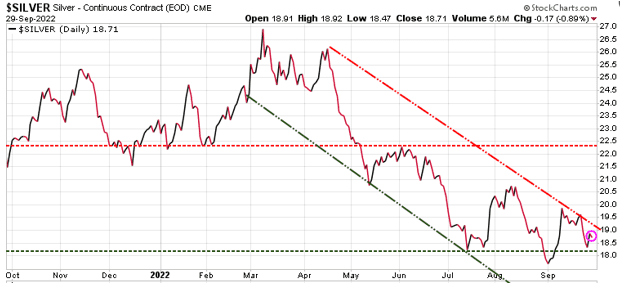
Q. Is Silver in sync with Gold

Silver generally follows gold,

Tends to rise more in bullish markets

Declines more in bearish markets

Silver also really struggled since the high in March, but also looking good here

Initial resistance at 19.85, then 20.70, & 22.25

We  publish 3 investment services:

  • Trend Letter publishes every Sunday, covers equites, currencies, precious metal, commodities,& bonds. Mostly charts, with key bullet points to make easy to understand
    – Focus is for longer term investors who want to get a better understanding of what drives these markets
  • Trend Technical Trader – Online service that started as a hedging service, which has been a very timely service these days for subscribers during this nasty bear market. TTT also now covers many sectors including commodities, equities & precious metals, EVEN Psychedelic Therapies, a very exciting new sector which we recently booked a nice 45% gain in just 3 months.   – Focus here is for more traders but investors can also benefit, especially with these hedging strategies
  • Trend Disruptors – a monthly publication with new disruptive ideas in Artificial Intelligence, Virtual Reality, Augmented Reality, 5G, Cloud, Internet of Things etc.  Very speculative sector and we have not added any new recommendations in this bear market, but are building our Watch List which is at about 25-30 companies right now
    – Focus on those wishing to speculate, with risk capital they can afford to lose.

Special Offers

ServiceRegular PriceSpecial PriceSavingSubscribe
Trend Letter$599.95$349.95$250Trend Letter $349.95
Technical Trader$649.95$349.95$300 Trend Technical Trader $349.95
Trend Disruptors$599.95$349.95$250 Trend Disruptors $349.95
Better Deals
Trend Letter + Technical Trader$1,249.90$549.95$699.95 Trend Letter & Technical Trader $549.95
Trend Letter + Trend Disruptors$1,199.90$549.95$649.95 Trend Letter & Trend Disruptors $549.95
Technical Trader + Trend Disruptors$1,249.90$549.95$699.95 Technical Trader & Trend Disruptors $549.95
Best Deal
Trend Suite: Trend Letter + Technical Trader + Trend Disruptors$1,849.85$649.95$1,199.90 Trend Suite: TL + TTT + TD $649.95

Market Notes

Market Charts – September 1/22

As noted to subscribers in Sunday’s issue of the Trend Letter, the the 50-DMA (blue wavy line) would be initial support for the S&P 500.  We also noted that if that level did not hold it would open the door to retest the July lows (bottom green dashed horizontal line). After falling through the 50-DMA on Wednesday, the S&P 500 became oversold, so a brief rally was expected, which we saw today.

Looking ahead,  if the market does not get back above the 50-DMA quickly, we can expect lower prices in the near-term.  Initial support sits at the 3900 level,  with that June low at 3665 being a critical support.  We continue to suggest using any relief rallies rallies to take profits and reduce risk. Using hedging strategies is a great way to protect your long positions.

Below is a chart that we have repeatedly shown to our subscribers to warn them to be very careful with bear market rallies.  In a bear market there will be multiple relief rallies, but these typically fail to make new highs, and instead retest the lows, often making even lower lows.  Below we see the Nasdaq from the high in March’00 to the low in Oct ’02. In that over 2.5 year period there were 8 rallies of over 16%, with some over 40%, yet the Nasdaq remained in a long-term bear market and ultimately lost over 78%!

Our Trend Technical Trader (TTT) service highlights many hedging strategies for subscribers to consider to protect themselves in a bear market.  These are very simple strategies to use, as simple as trading any stock online. Click here for more information.

Gold continued its disappointing movement, continuing to trade in the downtrend channel it has been in since the March high.  Gold is now testing its previous low near the 1700 level and could fall to the 1675 key support level before we see a turnaround.   We have been alerting our subscribers that gold could be setting up for a strong run here very soon. Note at the bottom of the chart that based on RSI, gold is close to being oversold.  We will send out BUY Alerts to subscribers if/when our model triggers the potential bottom.

Oil has continued to trade in a downtrend channel since the high in early June. Back then, we warned that oil prices, along with most commodities, could get hit as we head toward a global recession. When oil recently dropped to the 87.00 range we told subscribers that a rally to 95.00 was likely and even a run to 100 was possible. Oil did indeed rally to 95.00 but could not reach 100, stopping out at 97.00 last week. Ultimately, we are very bullish on oil and commodities in general for the long-term, but as we get closer to a recession, expect weakness in oil and most commodities as we head into the fall.

Stay tuned!