Posts by The Trend Letter

Market Notes

Market update – September 23/20

Equities:

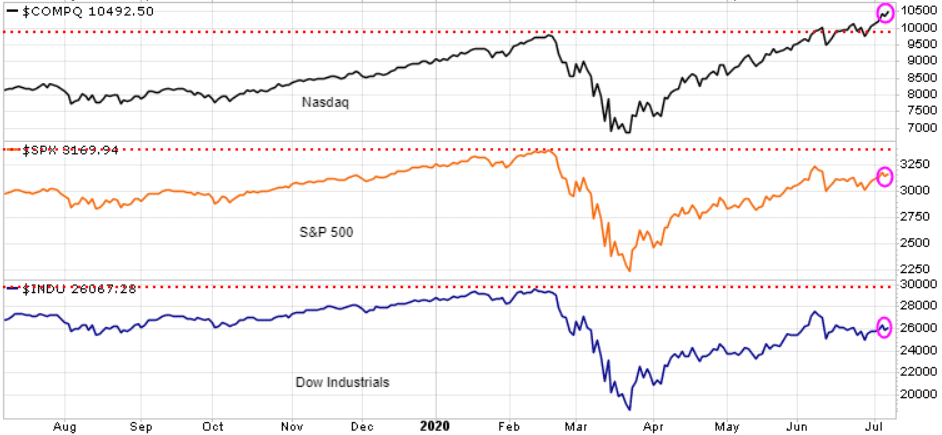
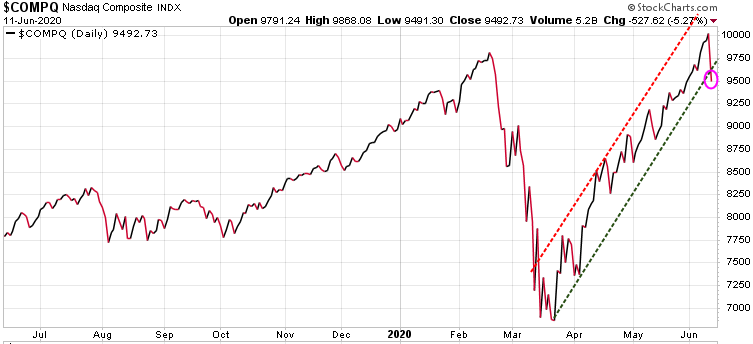
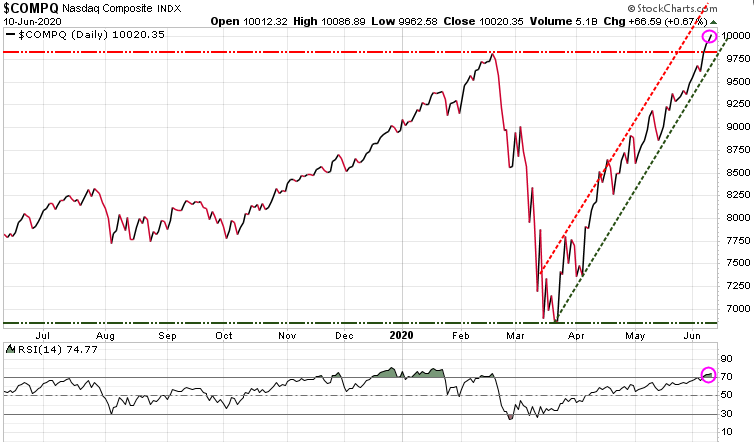
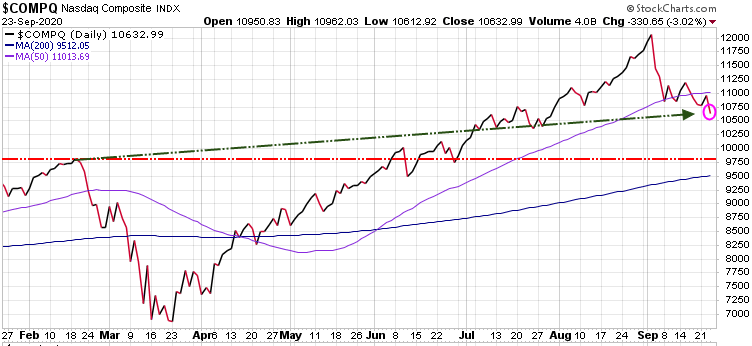
Nasdaq – down 330.65 points or 3.02%

The Nasdaq Index represents the tech sector and includes the world’s foremost technology and biotech giants such as Apple, Google, Microsoft, Oracle, Amazon, and Intel. No surprise to subscribers, this index has blown the doors off all other indexes as these stocks have been the market leaders all the way up. But now that we are seeing the markets turn, it is these same high powered stocks that are being hit the hardest. The Nasdaq has now dropped below its 50-Day Moving Average (purple line on chart).  Note: In early September entered a short position on the Nasdaq with an easy to trade Exchange Traded Fund (ETF)

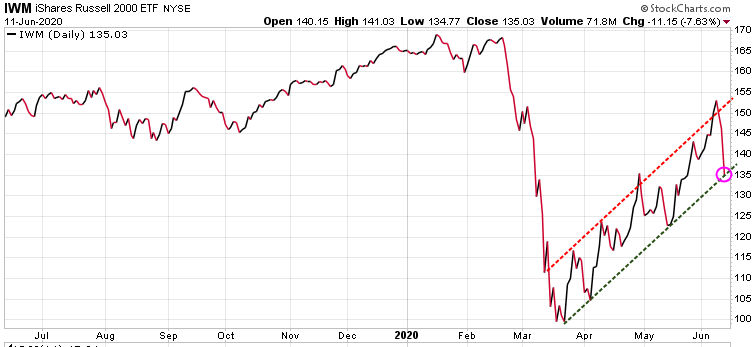
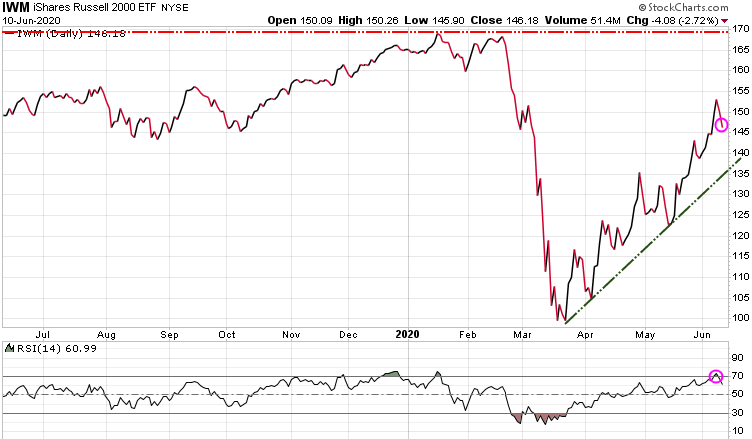
Russell 2000 – down 2.98%

The Russell 2000 represents American small cap stocks and the broader stock market and economy. We note that the small cap stocks did not come close to exceeding its February all-time high and has been struggling since early August to make any gains. Note that the Russell 2000 has dropped below its 50-DMA (purple line) and is now right on its 200-DMA (blue line), and a break and close below that level suggests a deeper correction.


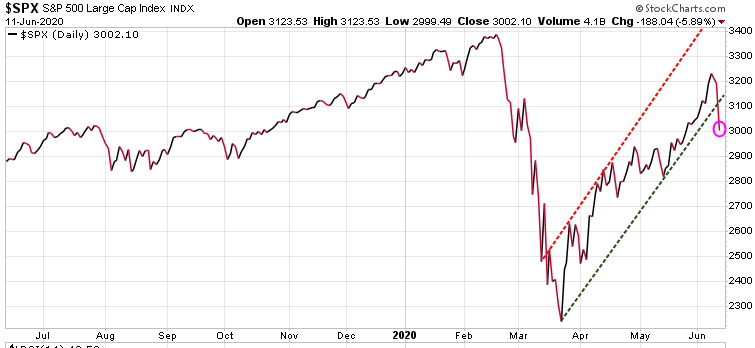
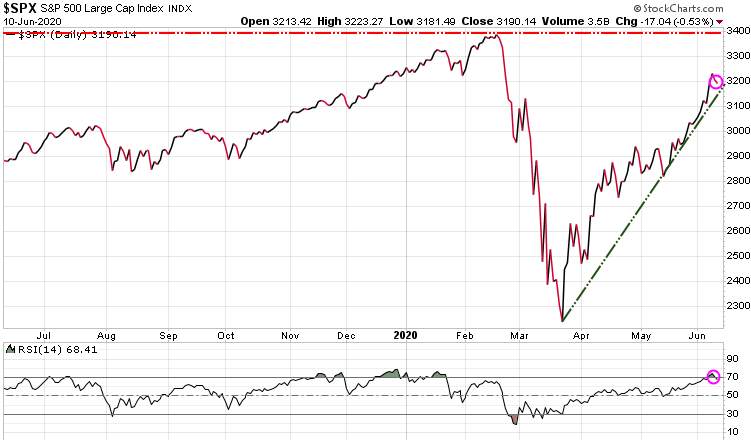
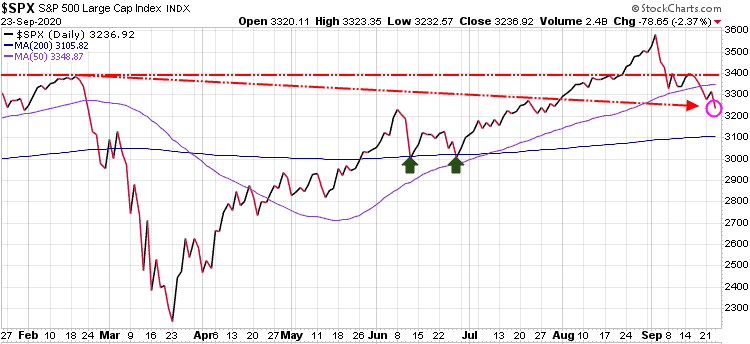
S&P 500 – down 78.55 point or 2.37%

The S&P 500 represents  more retail  domestic investors, which drove up the S&P 500 to new highs in early September, but is now back below its February high. The S&P 500 is also now below its 50-DMA. Note: In early September  entered a short position on the S&P 500  with an easy to trade Exchange Traded Fund (ETF)

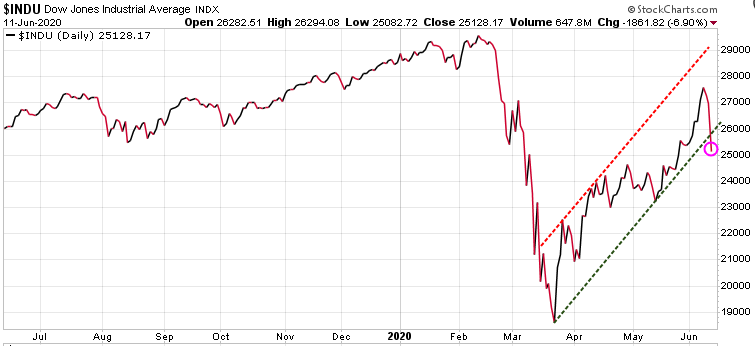
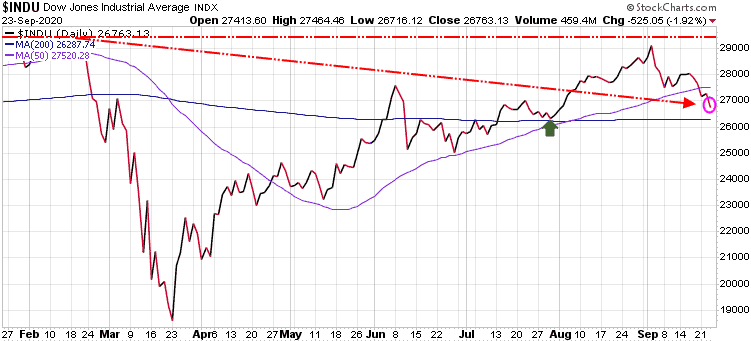
Dow Industrials – down 525.05 point or 1.92%

The Dow Jones Industrials reflects big institutional and international capital, and it did not make a new high after the March crash.  Given that it did not rally as strong as the other indexes we expect it will not decline as deeply as the Nasdaq, Russell 2000 or S&P 500.  The Dow has now dropped below its 50-DMA and is approaching key support at the 200-DMA which is 26,287.

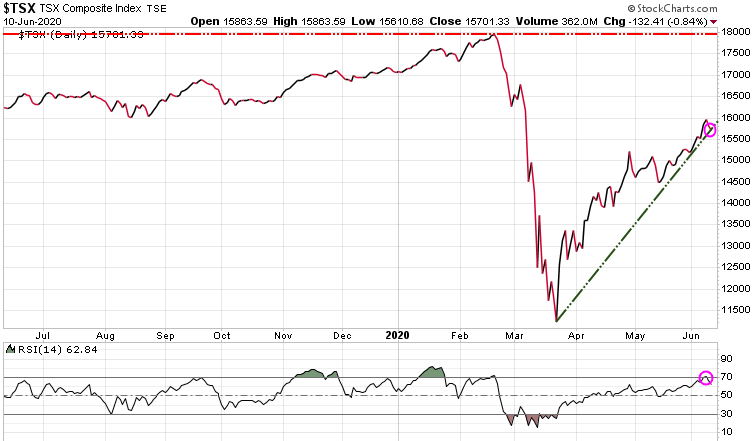
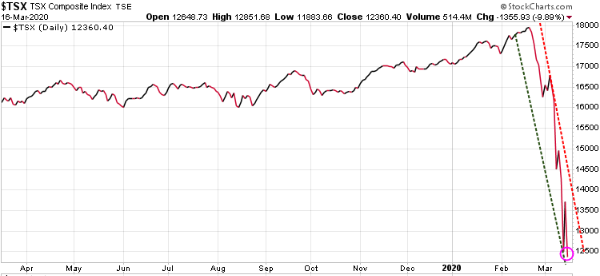
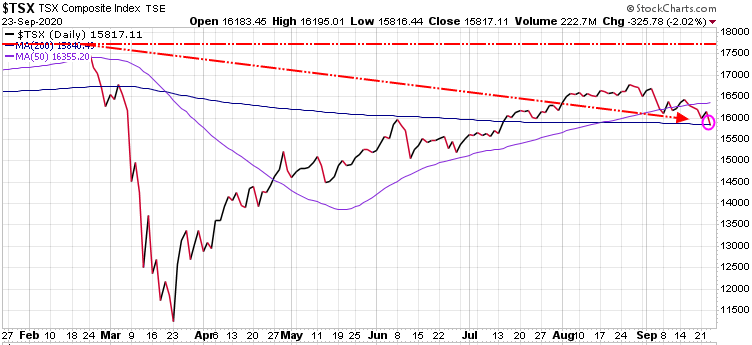
Canadian TSX – down 325.78 or 2.02%

The TSX represents most of Canada’s largest companies including many in the mining and banking sectors. The TSX was also not able not make a new high since the February high. The TSX has also dropped below its 50-DMA and is now testing support its 200-DMA (blue line).


Precious Metals:

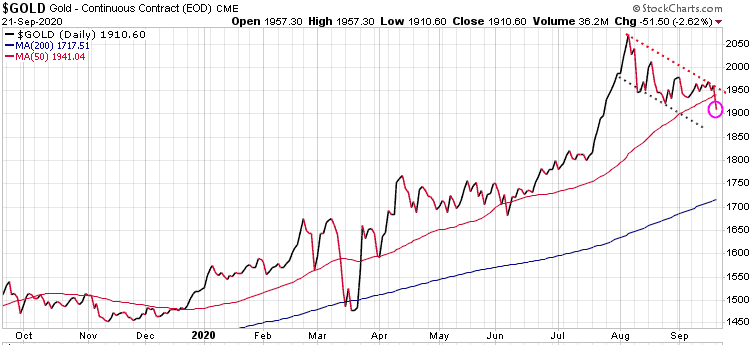
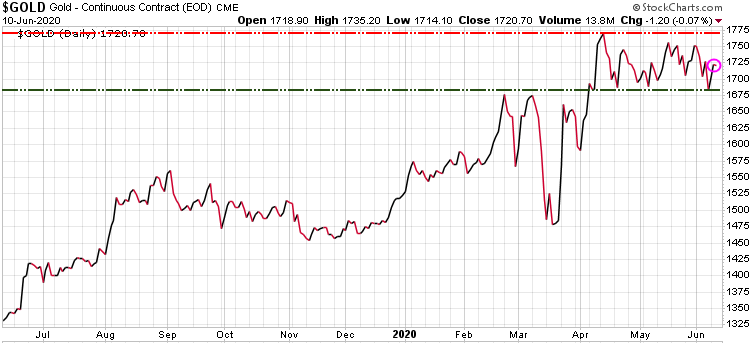
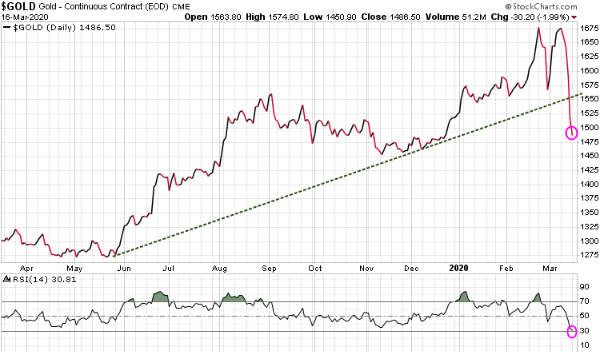
Gold – down 39.20 or 2.05%

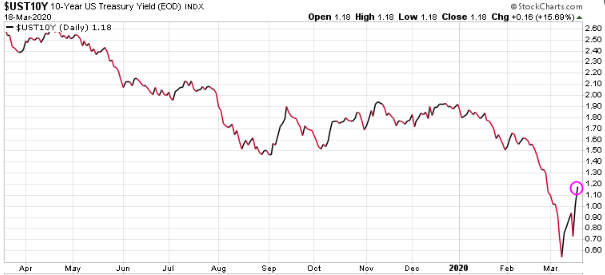
Gold closed today at 1868, just slightly above the August 12/20 intra-day low at 1865.  If we see gold break below and close below 1865 we could see a re-test of 1800.

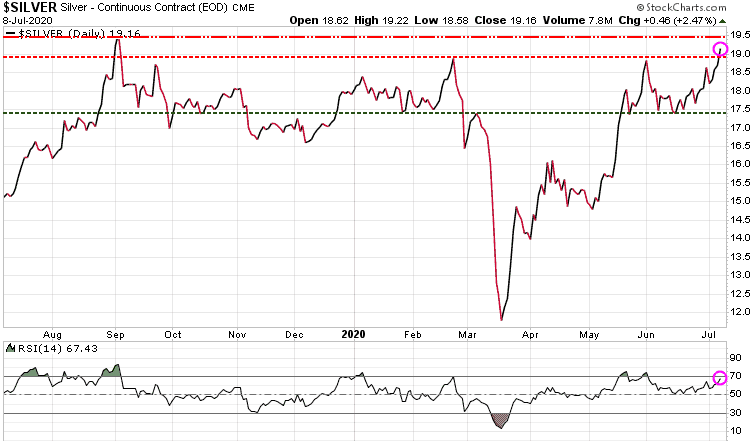
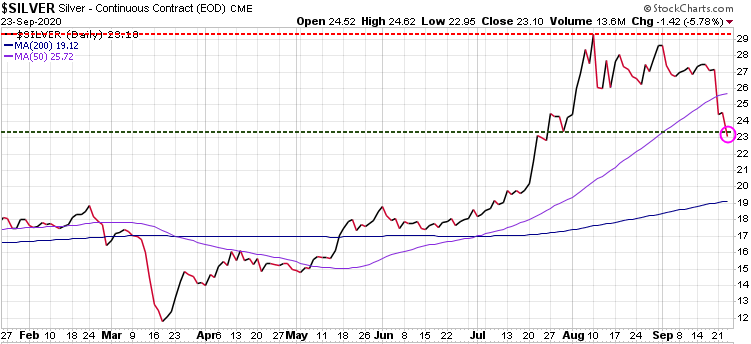
Silver – down 1.42 or 5.78%

Silver is the more volatile of the precious metals, generally moving higher than gold in bull markets, but also moving lower than gold in bear markets or market corrections. That is what is happening right now; while gold declined 2.05% today, silver dropped over double that rate at 5.78%.
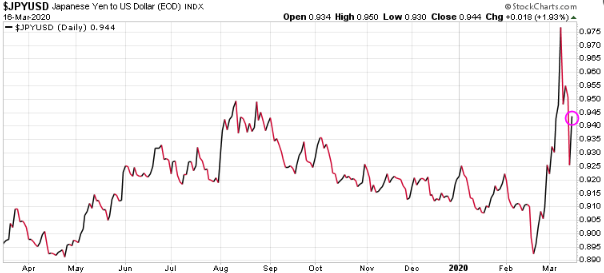
Currencies:

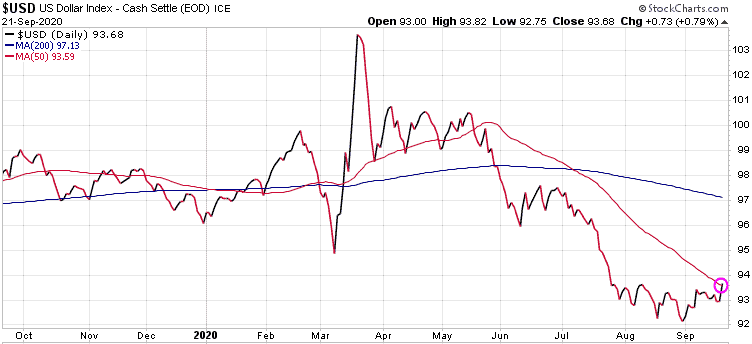
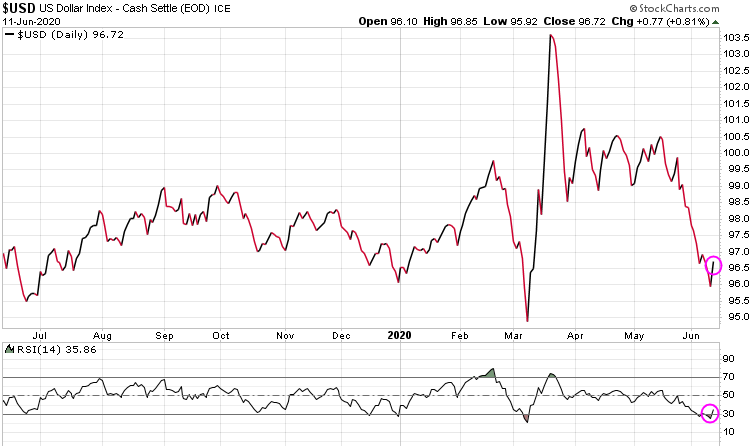
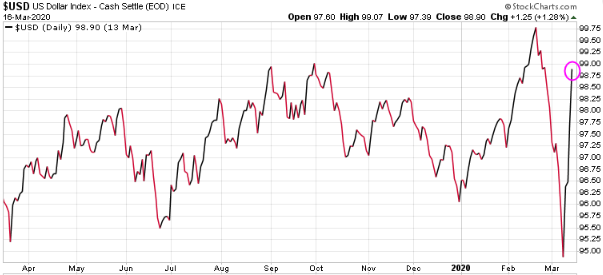
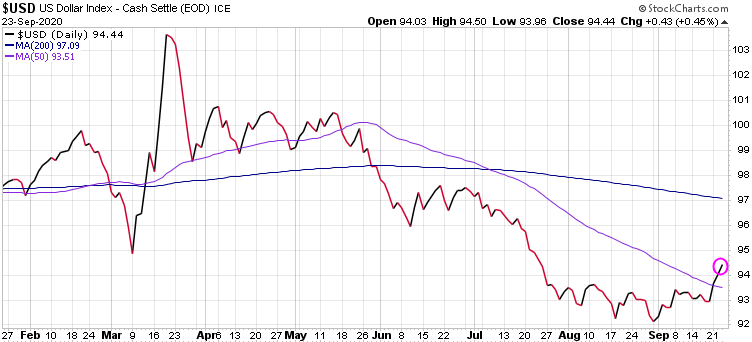
US dollar – up .43 or .45%

Despite all the doom and gloom projections for the $US, when investors get nervous and want some safety for their capital, the $US is still the ‘safe-haven’ currency.

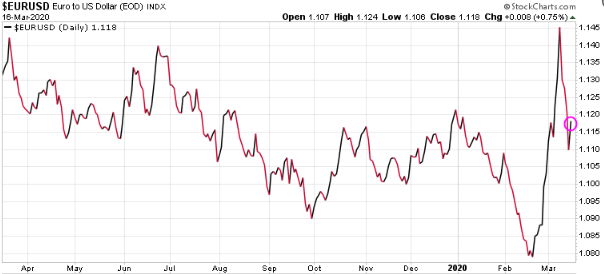
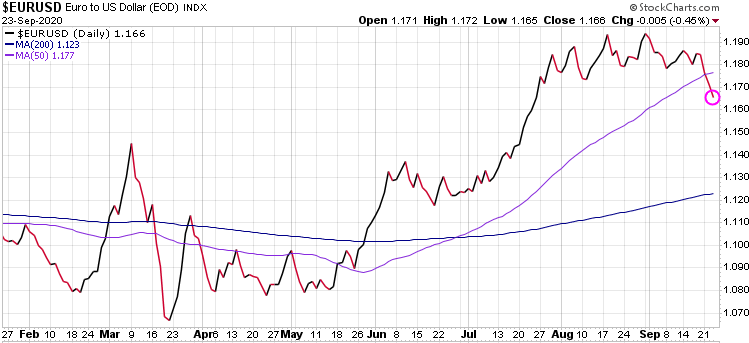
Euro – down .005 or .45%

Note: In late August we entered a short position on the Euro with an easy to trade Exchange Traded Fund (ETF)

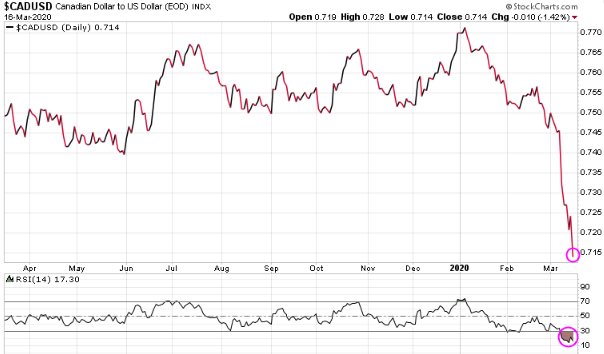
Canadian dollar -.005 or .61%

If you are not a subscriber but would like to be, we are offering some great discounted rates for our three services.

Trend Letter:

Since start-up in 2002 Trend Letter has provided investors with a great track record, giving exceptionally accurate information about where the markets are going, and it has explained in clear, concise language the reasons why. Using unique and comprehensive tools, Trend Letter gives investors a true edge in understanding current market conditions, and shows investors how to generate and retain wealth in today’s climate of extreme market volatility.

A weekly publication covering global bonds, currencies, equities, commodities, & precious metals.

Timer Digest says: “Trend Letter has been a Timer Digest top performer in our Bond and Gold categories, along with competitive performance for the intermediate-term Stock category.”

Technical Trader:

Originally developed to be a premier hedging service designed to profit in declining markets, Trend Technical Trader (TTT) was evolved into an excellent all round trading service that prospers in both up and down markets. After delivering excellent gains during the March melt-down, TTT steered subscribers into gold trades and a number of long equity positions for phenomenal gains in very short holding periods.

TTT is an online service, updated every Monday, Wednesday and Friday, after the market close.

Trend Disruptors:

Disruptive technology trends will propel our future and the reality is that no industry will go untouched by this digital transformation. At the root of this transformation is the blurring of boundaries between the physical and virtual worlds. As digital business integrates these worlds through emerging and strategic technologies, entirely new business models are created.

Trend Disruptors is a service for investors seeking to invest in advanced, often unproven technology stocks on the cheap, with the objective to sell them when masses finally catch on. Covering Artificial Intelligence (AI), Virtual Reality (VR), Augmented Reality (AR), 5G, Quantum Computing & many more.

Special Offers

ServiceRegular PriceSpecial PriceSavingSubscribe
Trend Letter$599.95299.95$300Trend Letter $299.95
Technical Trader$649.95$324.95$325Trend Technical Trader $324.95
Trend Disruptors$599.95$299.95$300Trend Disruptors $299.95
Better Deals
Trend Letter + Technical Trader$1,249.90$524.95$724.95Trend Letter + Technical Trader $524.95
Trend Letter + Trend Disruptors$1,199.90$503.95$695.95Trend Letter + Technical Trader $503.95
Technical Trader + Trend Disruptors$1,249.90$524.955$724.95Trend Disruptors + Technical Trader $524.95
Best Deal
Trend Suite: Trend Letter + Technical Trader + Trend Disruptors$1,849.85$610.45$1,239.40Trend Suite TL =TTT + TD $610.45
Market Notes

Market update – September 21/20

The markets opened down on fears of COVID-19 spreading again, the gridlock in Washington, and of course fears that the results of the US election won’t be known for weeks, or even months after the election. In addition, word was out that a number of major financial institutions, including JPMorgan Chase, HSBC, and Deutsche Bank, were allegedly involved in a multi-trillion dollar money laundering scheme between 1999-2017. Over 2,100 counts of “suspicious activity” were reported to the Department of Treasury’s Financial Crimes Enforcement Network and a further investigation will be underway.

As the day progressed stocks pared losses as a rebound in some tech giants tempered concern over cloudy prospects for economic stimulus and a report about suspicious transactions at global banks. Bonds and the US dollar rose, while gold fell with the equities on a strong US dollar.

S&P 500 – down 38.41 or 1.16%

The S&P broke through its 50-DMA (red line) on Friday and continued its decline today. In yesterday’s issue of the Trend Letter we highlighted how a break below 3285would warn of a potential deeper correction‘.  We need to watch 3260, then 3205 as key support levels. If the 3205 support does not hold, a serious correction could be in the cards. Ultimately, the 200-DMA (blue line) has been a solid support level for the S&P 500 (green arrows. So will need to keep our eye on that level (3104).

US Dollar – up .73 or .79%

Despite all the doom and gloom projections for the $US, when investors get nervous and want some safety for their capital, the $US is still the ‘safe-haven’ currency.

Canadian Dollar – dropped .006 or .75%

With $US strength most currencies retreated, including the $CAD. The $CAD has dropped below its 50-DMA (red line)

Gold – down 51.50 or  2.62%

With the equity market sell-off, capital flowed into the $US and US bonds.  With the $US strength, gold and silver were knocked lower.  Gold has now dropped below its 50-DMA (red line), and a break of the August intra-day low of 1865 would open the door for a test of 1800.

Subscribers to the Trend Letter & Trend Technical Trader have been given recent ‘insurance ‘ plays to protect their portfolios in case we do see a steeper correction here. Both of our models are warning of a market decline into October.

Trend Letter:

Since start-up in 2002 Trend Letter has provided investors with a great track record, giving exceptionally accurate information about where the markets are going, and it has explained in clear, concise language the reasons why. Using unique and comprehensive tools, Trend Letter gives investors a true edge in understanding current market conditions, and shows investors how to generate and retain wealth in today’s climate of extreme market volatility.

A weekly publication covering global bonds, currencies, equities, commodities, & precious metals.

Timer Digest says: “Trend Letter has been a Timer Digest top performer in our Bond and Gold categories, along with competitive performance for the intermediate-term Stock category.”

Technical Trader:

Originally developed to be a premier hedging service designed to profit in declining markets, Trend Technical Trader (TTT) was evolved into an excellent all round trading service that prospers in both up and down markets. After delivering excellent gains during the March melt-down, TTT steered subscribers into gold trades and a number of long equity positions for phenomenal gains in very short holding periods.

TTT is an online service, updated every Monday, Wednesday and Friday, after the market close.

Trend Disruptors:

Disruptive technology trends will propel our future and the reality is that no industry will go untouched by this digital transformation. At the root of this transformation is the blurring of boundaries between the physical and virtual worlds. As digital business integrates these worlds through emerging and strategic technologies, entirely new business models are created.

Trend Disruptors is a service for investors seeking to invest in advanced, often unproven technology stocks on the cheap, with the objective to sell them when masses finally catch on. Covering Artificial Intelligence (AI), Virtual Reality (VR), Augmented Reality (AR), 5G, Quantum Computing & many more.

Special Offers

ServiceRegular PriceSpecial PriceSavingSubscribe
Trend Letter$599.95299.95$300Trend Letter $299.95
Technical Trader$649.95$324.95$325Trend Technical Trader $324.95
Trend Disruptors$599.95$299.95$300Trend Disruptors $299.95
Better Deals
Trend Letter + Technical Trader$1,249.90$524.95$724.95Trend Letter + Technical Trader $524.95
Trend Letter + Trend Disruptors$1,199.90$503.95$695.95Trend Letter + Technical Trader $503.95
Technical Trader + Trend Disruptors$1,249.90$524.955$724.95Trend Disruptors + Technical Trader $524.95
Best Deal
Trend Suite: Trend Letter + Technical Trader + Trend Disruptors$1,849.85$610.45$1,239.40Trend Suite TL =TTT + TD $610.45

Canadian Health Experts Speak Up About The Decision to Lockdown

Dealing with COVID-19: An open letter to Canada’s prime minister and provincial and territorial premiers


Market Notes

Market Update – July 8/20

The Canadian government just released its updated deficit projections and they were mind boggling. The government now projects the federal deficit for this fiscal year to be $345 billion.  That is approximately 18 times larger than the 2019 deficit. PM Justin Trudeau then made this statement.

“As a Federal Gov’t we decided to take on that debt, so Canadians wouldn’t have to”

Really? Is it possible that the PM of the country doesn’t understand that when the country takes on debt, it is the Canadian citizens who will have to pay off that debt? There are a little over 37 million people in Canada. A $345 deficit is the equivalent to every man, woman and child taking on $9,300 of debt.

Stocks:

The Nasdaq continued to lead markets higher, setting another new all-time high today. As investors we need to watch this as the Nasdaq leads markets higher while the Dow is lagging suggesting it will lead the next downturn.

Gold & Silver:

Gold was another big story today as it continues to run higher. We are seeing gold and equities moving together, which is a scenario we forecast when we see the coming liquidity crash where confidence in government comes into question. We do believe that this current move in gold is a bit early, but we never argue with the markets. Note at the bottom of chart how based on the Relative Strength Index (RSI) gold is getting close to being overbought, so at least a temp high could be in place soon.

Silver has been lagging behind gold and just now broke through the February high, while gold broke through that level back in April.  Note that silver is also getting close to being overbought based on RSI.

While gold is within 6% of its all-time high, silver would need to rise over 130% to reach its 2011 high.

Both the Trend Letter (TL) and Trend Technical Trader (TTT) have plays on to gain from this current rally in precious metals with TTT experiencing some significant gains such as 85%, and 100% to highlight a couple recently.

If you are not a subscriber but would like to be, we are opening up a previous special price window valid till Friday. CLICK HERE for special offers.

Stay tuned!

Market Notes

Market update – 06/11/2020

In yesterday’s update we discussed how the US Federal Reserve pledged to maintain at least the current pace of asset purchases and projected interest rates will remain near zero through 2022.  We also showed how most indexes were overbought based on the RSI. Overnight the market had a chance to digest that commitment from the Fed and decided that if the Fed is not even considering raising rates for another two years, then they must be seeing plenty of trouble in the next year or two.

One of the things we have been warning subscribers about is the incredible debt crisis that is looming, not just in governments, but also companies. Low interest rates have created zombie companies.   One side effect of central banks keeping rates low for a long time is that it interferes with the normal process of poorly run companies failing and disappearing, it is a natural attrition. With central banks like the Fed actually buying up debt of these companies it is keeping many unproductive companies alive, which ultimately lowers long-run growth rate of the economy.

This chart shows the percent of US firms that have debt servicing costs that are HIGHER than their profits.

The markets sold off today in a dramatic fashion.

The small cap stocks were the big losers today again as identified by the Russell 2000 Index. It dropped a whopping 7.63%, the worst day since March 16.

The Dow Industrials continued to lead the way down for the big three US indexes, down  6.90%. The Dow has now fallen out of its uptrend channel, and by closing below 26,000 warns that the Dow may be leading the markets back into a correction, so caution is required here.

The S&P 500 also falls out of uptrend channel, as it was down 5.89%

The Nasdaq which has been the market leader, also hit, down 5.27%

The Canadian market was down, but at 4.14%, less than the US markets

Yesterday we noted the $US was oversold, at least in the short-term, and it got a bounce today as the safe-haven currency.

Gold caught a bit, as low interest rates makes gold more attractive.

If you do not have a plan to protect yourself in the case of another destructive market decline, then you should seriously consider subscribing to Trend Technical Trader which has a series of defensive plays for you to implement. These plays can not just protect you from losses in a deep decline, but they can help your make significant gains. To subscribe at a very special rate of $399.95, a savings of $250 CLICK HERE

Stay tuned!

Market Notes

Market Update

US Fed sees 0% rates through 2022

The US Federal Reserve pledged to maintain at least the current pace of asset purchases and projected interest rates will remain near zero through 2022, as Chairman Jerome Powell committed the central bank to using all its tools to help the economy recover from the coronavirus.

“We’re not even thinking about thinking about raising rates,” he told a video press conference Wednesday. “We are strongly committed to using our tools to do whatever we can for as long as it takes.”

Interesting to compare the S&P 500 recovery now versus that during the Great Depression. It is all about the Fed.

The NASDAQ Index is the clear winner here as tech stocks continue to lead the way. The NASDAQ closed today above 10,000 for the first time ever. The question now is, does the NASDAQ continue to lead equities higher? Note at the bottom chart, Relative Strength Index (RSI) is now technically in overbought territory.

The Dow Industrials did not follow the NASDAQ’s lead today and as we highlighted to subscribers on Sunday, the Dow is lagging, posing the question: is the NASDAQ going to lead equities higher, or will the Dow lead the markets lower and potentially re-test the March lows? By closing below 27,000, we must now watch to see if the Key Support at 25,230 holds.

The S&P 500 also struggled today, giving up 17 points.

The Small Caps represented by the Russell 2000 Index was the big loser for US equities today, down 2.72%.

The Canadian market was also down today.

With the Fed vowing to keep rates low, the yield on the 10-year bond dropped 10 points to .75% 

With the Fed promising low rates, the US dollar continued lower. Canadian and European investors might want to look to convert some local currency to $US during this weakness.

Gold has been trading in a tight range lately.

Stay tuned!


Is this the bottom?

In a recent blog we discussed the importance of having a hedging strategy.  It’s a way to protect your portfolio, and protection is often just as important as appreciation.

Since February 21st, we have seen a significant stock market crash, with the S&P 500  dropping 35% from the high, blindsiding most investors.

Fortunately for subscribers to our Trend Technical Trader (TTT) service, they were presented with several effective hedging strategies that were simple to follow and easy to implement.  The results allowed subscribers to not only protect their capital in this bear market, but to actually make some significant gains.

Some examples:

An Exchange Traded Fund (ETF) that trades on volatility: +29.5% in 3 days

A 2nd position in that same ETF: +48.5% in 1 month

A leveraged Bear Small Cap ETF: +47.2% in 1 month

A leveraged Short DJIA ETF: + 61.5% in 2.5 weeks

A leveraged Bear Jr Miner Gold ETF:  +86.5% in less than a week

The question now is, ‘what next?’ As we can see from this chart, after the significant decline, the S&P 500 is in a near-term uptrend channel. Is this the start of a new bull market, or a dead-cat bounce?

The headlines are full of talking heads predicting everything from ‘back up the truck’, to ‘it’s a bear trap.’  If we look at other major bear markets one thing is clear, they all end eventually. But typically they only end after it is no longer the lead story in the mainstream media.

Typically markets only bottom out once people have moved on, not when investors are buying every dip.  If you followed a hedging strategy during the big crash, and are now in a strong cash position, you need to have a strategy for when to get back in, just like you needed to have a strategy for the decline.

After the big crash we saw a lot of ‘bottom picking,’ buying, which suggests that there is still too much optimism in the markets.  There is a real FOMO (Fear of Missing Out) sentiment in the markets, which suggests that a re-test of the low, or even lower lows, could be in the cards.

These are crazy times.  We have a global pandemic, with fear and panic running rampant.  We have central banks and governments turning on the fire hoses, pumping out $trillions into monetary and fiscal stimulus programs.

While we can’t know exactly how things will play out, we will follow our models to get a better idea of when to get back in.  Our TTT service has been actively making very short-term, and even a few long-term trades already, positioning for when we get the full green light to buy back in.

Here is Monday’s commentary from TTT:

DJIA started the week with a gain of 690 points.

While earlier this year that would’ve made for a truly remarkable day, instead it was the calmest trading day in many weeks.

It’s likely this current rally is very near its end, and we expect many more stellar entry levels during the next major leg downward.

When stocks drop significantly again, we’ll suggest lowball bids for additional positions, focusing on the resource sector and specifically oil.

The overwhelming bearish sentiment and predictions on oil at present has us ready and eager to buy.  We made absolute killings in oil-related stocks the last time prices crashed and the world turned ultra-bearish.  We expect this time won’t be different, and once again we’ll be focusing on a variety of companies and related funds, some paying considerable yields.

In contrast beware of the extreme hype currently with respect to gold and silver.  Such extreme sentiment along with stories of shortage and conspiracies about price suppression tend to attend a top.  We’ll load up on quality mining stocks and speculations related to precious metals if there’s another major liquidation soon.

If interested in subscribing to TTT at a special rate of $399.95, click here.

Stay tuned!

Market Notes

Bond crisis near!

Our BUY Stop was triggered today for a new trade in the bond market. We suggested this trade because our models have been detecting some abnormalities in the markets. For a few years we have warned of a coming global credit and liquidity crisis. We are now moving deeper into this crisis.

Europe and Japan have destroyed their bond markets by introducing negative rates.  For quite a while we have said that capital from Europe would escape the Euro and European bonds and move into the $US and US bonds. To play that trend we used an Exchange Traded Fund (ETF) to short the Euro, and another leverage ETF to be long the US bonds. Both trades have done extremely well.

What we are seeing now is a huge capital flow into the $US, here is the chart.

But as we can see during today’s’ drop in the equity markets, the bond market was also down, pushing yields higher. This is a nightmare for the central banks.

We have stated all along that there was going to come a point where the curtain is pulled back and the masses start to realize that those in government have lost control of the economy and have no idea how to solve this current financial crisis.

This is a problem that has been growing for the last decade when central banks started to interfere in the markets with their enormous stimulus programs, all the way to where we are now, with zero, and even negative rates. They have used up all their ammunition and the recession is not even here yet. Yes, the coronavirus certainly accelerated the problem, but this liquidity crisis has been looming for some time.

In Europe they have banned shorting of government bonds. When they make those kind of moves it tells the markets there is something very seriously wrong with Euro bonds, so investors move out of them. But today, they did not move into US bonds during this sell-off. This could be the start of serious trouble in the bond markets.

We are hearing of plans to force a ‘banking holiday’ in Europe as they are now worried there will be runs on the banks. This is getting ugly.

Our new trade is a long-term play on our theme that central banks have been artificially keeping interest rates down with all of their stimulus programs and bond purchases. It is like they have been trying to push a beach ball further and further under water. At some point they will lose control of the beach ball and it will shoot up. It looks like this is now starting to happen in the bond market.

It really is starting to look like the markets are losing confidence in government and if they abandon government bonds, watch out!  We believe this new trade will eventually be a monster gain.

If you wish to see the details of this trade and other strategies from the Trend Letter, you can subscribe at a $200 discount.  Click here to subscribe for only $399.95

Stay tuned!

Market Notes

Market update – March 16/20

Wall Street suffered its biggest drop since 1987 on Monday, with the S&P 500 closing at its lowest level since December 2018, as investors fear the coronavirus pandemic is proving a tougher opponent than central banks, lawmakers or the White House are currently capable of battling.

US – S&P 500

The S&P 500 dropped another 324.89 points, the biggest single day drop since 1987.

Canada – TSX

The Canadina market dropped ~10% today, and is now done 31% from the February high.

Germany – DAX

The German DAX Index is now down over 38% since February. Note a the bottom of the chart, the Relative Strength Index is at 10.47, an incredibly low reading. telling us this market is extremely oversold.

US Dollar

Global capital has been flowing into the $US, seeking a safe-haven.

Canadian Dollar

Canadian dollar drops to its lowest level in over 4 years. Being a commodity based currency, the fears of a global recession have hit commodity prices hard.

Euro

The Euro caught a bit of a bid today after falling off its recent high.

Japanese Yen

Very similar story for the Yen.

Gold

Gold has not played the role of a safe-haven because when hedge funds started to lose money in the equities they have been forced to sell EVERYTHING to cover losses and margin calls. Gold is starting to get oversold here.

Oil

The price of oil continues to fall as the coronavirus lockdown continues, pushing the global economy ever closer to a recession.

Stay tuned!

Social distancing: What it is and why it’s the best tool we have to fight the coronavirus

By Thomas Perls, Professor of Medicine, Boston University

As the coronavirus spreads into more and more communities, public health officials are placing responsibility on individuals to help slow the pandemic. Social distancing is the way to do it. 

What is social distancing?

Social distancing is a tool public health officials recommend to slow the spread of a disease that is being passed from person to person. Simply put, it means that people stay far enough away from each other so that the coronavirus – or any pathogen – cannot spread from one person to another.

The Centers for Disease Control and Prevention describes social distancing as staying away from mass gatherings and keeping a distance of 6 feet or 2 meters – about one body length – away from other people. In New York City, for example, theaters have closed temporarily, many conventions around the world are being canceled and schools are closing all across the U.S. I’ve stopped taking the train during rush hour. Now I either work from home or drive in with my wife, or I take the train during off-hours so I can maintain the 6-foot distance.

Social distancing also means not touching other people, and that includes handshakes. Physical touch is the most likely way a person will catch the coronavirus and the easiest way to spread it. Remember, keep that 6-foot distance and don’t touch.

Social distancing can never prevent 100% of transmissions, but by following these simple rules, individuals can play a critical role in slowing the spread of the coronavirus. If the number of cases isn’t kept below what the health care system can handle at any one time – called flattening the curve – hospitals could become overwhelmed, leading to unnecessary deaths and suffering.

Flattening the curve is another way of saying slowing the spread.

There are a few other terms besides social distancing that you are likely to hear. One is “self-quarantine.” This means staying put, isolating yourself from others because there is a reasonable possibility you have been exposed to someone with the virus.

Another is “mandatory quarantine.” A mandatory quarantine occurs when government authorities indicate that a person must stay in one place, for instance their home or a facility, for 14 days. Mandatory quarantines can be ordered for people who test negative for the virus, but have likely been exposed. Officials have imposed mandatory quarantines in the U.S. for people on cruise ships and those traveling from Hubei province, China.

Why does social distancing work?

If done correctly and on a large scale, social distancing breaks or slows the chain of transmission from person to person. People can spread the coronavirus for at least five days before they show symptoms. Social distancing limits the number of people an infected person comes into contact with – and potentially spreads the virus to – before they even realize they have the coronavirus.

It’s very important to take a possibility of exposure seriously and quarantine yourself. According to recently published research, self-quarantine should last 14 days to cover the period of time during which a person could reasonably present with symptoms of COVID-19, the disease caused by the coronavirus. If after two weeks they still don’t have symptoms, then it’s reasonable to end the quarantine. Shorter quarantine periods could happen for asymptomatic people as tests to rule out the virus become widely available.

Empty stadiums, canceled conferences and deserted city streets are a sign social distancing is happening. AP Photo/Michael Conroy

Why is social distancing so crucial?

At the moment, it’s the only tool available to fight the spread of the coronavirus.

Experts estimate that a vaccine is 12 to 18 months away. For now, there are no drugs available that can slow down a coronavirus infection.

Without a way to make people better once they fall sick or make them less contiguous, the only effective tactic is making sure hospital-level care is available to those who need it. The way to do that is to slow or stop the spread of the virus and decrease the number of cases at any one time.

Who should do it?

Everyone must practice social distancing in order to prevent a tidal wave of cases. I am a geriatrician who cares for the most vulnerable people: frail older adults. Certainly, such individuals should be doing all they can to protect themselves, diligently practicing social distancing and significantly changing their public ways until this pandemic blows over. People who are not frail need to do all they can to protect those who are, by helping to minimize their exposure to COVID-19.

If the public as a whole takes social distancing seriously, overwhelming the medical system could be avoided. Much of how the coronavirus pandemic unfolds in the U.S. will come down to individuals’ choices.