Posts by The Trend Letter

October 15/18

We follow the trends and capital flows. Remember, this is a global market, it is all connected.

Stocks

The S&P 500 had just surpassed Friday’s high with about an hour to go in today’s trading, then gave it all up and closed down 16.34 points or .59% on the day.

Looking at the lower chart we see that the Relative Strength Index (RSI) at 27.71 is still below 30, indicating that the S&P 500 is still oversold here. Continue to watch the 200-day MA (link line), as it has in the past acted as a very solid support level for the S&P 500. If the S&P cannot climb back and close solidly above this support, it means we are not out of the woods and that more moves to the downside are certainly possible.

Long-term trend remains bullish

Immediate trend is bearish

Our current position is NEUTRAL

spx1015

Gold

Gold had another up day, closing today up 8.30 or .68%. Gold has broken out of its near-term downtrend channel and now needs to close above 1246, then push through and close above 1260, 1307, and 1377 to have a chance of having a solid bull run.

Long-term trend is bearish

Immediate trend is bullish

Our current position is a BUY

Gold1015


Stay tuned!

October 12/18

We follow the trends and capital flows. Remember, this is a global market, it is all connected.

Stocks

A wild ride today for all core indices. The S&P 500 hit an early high at 2775.77, only to give it all up and drop to 2730.23 by noon, and then recover and close at 2767.13, ending up 38.76 points or 1.42% for the day. While the bounce today was good, as we showed in yesterday’s update, the S&P 500 was technically very oversold, so today’s rally was no surprise to our readers. We said…

the Relative Strength Index (RSI) is now at 17.66 and whenever it is below 30 it is considered oversold, suggesting that the S&P 500 could soon rally back above its 200-day MA.

Looking at today’s chart we see that the S&P 500 did indeed rally and is within a whisper of testing that 200-day MA (blue line on chart). Even though the S&P 500 rallied today it is still down 4.39% for the week, suggesting that we are not out of the woods yet, and that more volatility should be expected next week.

SPX1012

This weekend’s issue of The Trend Letter will have full coverage of how this week’s action affected all markets, including the equity, bond, currency, precious metals, and commodity markets. If you are not a subscriber but would like to be, we are offering a special discount of $200 off the regular price of $599.95, so you only pay $399.95.  To take advantage of this offer, click here. 

Also, how was your sleep factor this week? If this week’s market volatility kept you up at night, it means that you are overexposed or most likely do not have a strategy to protect your wealth in such volatile times.

If you have a substantial portion of your portfolio in stocks, consider ‘hedging’ that long exposure. This week was a wake up call for those who are not prepared for a significant correction.

We do not know of a better hedging service than Trend Technical Trader (TTT) which is designed to make money in a down market. TTT uses a combination of conservative and aggressive strategies to position subscribers to profit in a declining market. These TTT trades are simple to action, the same as any trade recommended in Trend Letter. We are offering a subscription to TTT for only $399.95 (regular price is $649.95). Click Here to take advantage of this offer. It’s your money – take control.

Stay tuned!

October 11/18

We follow the trends and capital flows. Remember, this is a global market, it is all connected.

Stocks

In yesterday’s update we showed how the S&P 500 dropped a whopping 94.66 points or 3.29% and in doing so blasted through its 2825 support level.  We also noted the NASDAQ fell a massive 4.1%, the largest decline of the year. We further highlighted how the 200-day MA for the S&P 500 was a key support level and that we needed to watch to see if it would  hold.

Well today the S&P 500 lost another 57 points or 2.06%. Interesting that the NASDAQ, the big loser yesterday, lost “just” 1.3%. What we want to keep an eye on is that 200-day MA (blue line).  As we can see on the 2-year chart, the S&P 500 had tested this level three times (red arrows) but today is the first time that the S&P 500 has closed below its 200-day MA. Typically during bull markets, stocks trade above the 200-day MA, while in bear markets they trade below it.

We now need to see if this is the start of a deep correction, even a crash, or if it is simply an overshoot of support. If we look at the bottom portion of the chart we can see that the Relative Strength Index (RSI) is now at 17.66 and whenever it is below 30 it is considered oversold, suggesting that the S&P 500 could soon rally back above its 200-day MA.

There is no end to the opinions as to why the markets are being hit so hard here. Be it the recent jump in interest rates, trade concerns, computer algorithmic trading, issues in Italy, and let’s not forget politics, as the US election is fast approaching.  Whatever the opinions, we just watch the numbers.

Key levels we need to watch here for the S&P 500:

  • Near-term Support at 2717
  • Next Support level at 2700
  • Near-term Resistance at 2775

The S&P 500 needs to close tomorrow above 2717 to signal we could be near the bottom of this correction. If 2717, then 2700 are breached, then a deeper correction is in the cards.

Bonds

Yesterday we noted that “Typically, when we see a big sell-off in the stock markets, capital flows into bonds, driving up bond prices and pushing yields lower. That did not happen today!

Today, we did see capital move into bonds, which pushed yields lower. The US 10-year is now pushing up against its near-term downtrend line. IF equities continue lower, we would expect to see bonds continue to push higher, meaning yields lower.

bonds1011

Gold

Yesterday we also highlighted how gold is typically a go-to ‘safe haven’ play when we see deep market declines, but that was not the case yesterday. Well today gold finally got some love and jumped 34.20 or 2.87% for the day.

gold1011

Cryptos

While gold was a big ‘safe haven’ play, there was virtually no reaction from the crypto currencies as Bitcoin actually moved lower today.

There are tons of opinions out there, but we will continue to let the markets tell us which of these sectors will rise, and which will fall.

Quick Note: We have had a lot of inquiries asking how can investors protect themselves from significant market corrections or crashes. While The Trend Letter uses basic insurance for a correction, note that our hedging service Trend Technical Trader (TTT) is designed to make money in a down market. Its 4 recent hedge positions are up 37% (opened Oct 4/18), 33.5% (opened Oct 4/18), 33% (opened Sept 12/18), and 16.4% (opened Sept 5/18). These TTT trades are simple to action, just the same as any trade recommended in  Trend Letter. We are offering a subscription to TTT for only $399.95 (regular price is $649.95). Click Here to get that price. It’s your money – take control.

Stay tuned!

October 10/18

We follow the trends and capital flows. Remember, this is a global market, it is all connected.

In our Sunday issue of The Trend Letter we posted the following chart highlighting how the S&P 500 had broken below immediate support (yellow highlighted area) and warned that a break below 2825 (green line) would open the door for a deeper correction.

Well, today the S&P 500 dropped a whopping 94.66 points or 3.29% and in doing so blasted through that 2825 support level.  Note, the NASDAQ fell a massive 4.1%, the largest decline of the year. The 200-day MA for the S&P 500 (lower green line) is a key support level, so we will watch to see if it holds. It is currently at 2765.51.

SPX1010

A key reason for this sell-off is the rising interest rates. After a decade of global central banks artificially keeping interest rates low (even negative), rates are starting to rise. Typically, when we see a big sell-off in the stock markets, capital flows into bonds, driving up bond prices and pushing yields lower. That did not happen today!

As we can see, for the last couple of weeks, both the S&P 500 and the US 10-year bonds have been falling.

BondsVsSPX

What about gold, that other ‘safe haven’ play? Similar story, gold has been absolutely hated by investors, and cannot seem to get any momentum, even with a massive equity market sell-off. Should we see this correction in the equities accelerate, watch for gold to rally.

Gold1010

Not even crypto currencies could catch a bid with the equity market sell-off. Bitcoin was flat today and even showed some selling in the last hour.

Bitcoin1010

There are tons of opinions out there, but we will continue to let the markets tell us which of these sectors will rise, and which will fall.

Trend Letter subscribers, be sure to check your inbox for a new position today.

Stay tuned!

MoneyTalks radio interview with Trend Letter founder Martin Straith

No matter what your opinion of Donald Trump the person, that administration’s policy of reduced business taxes and regulations are very good for US businesses. Compare that to what we have in Canada and the EU.”

The Trend Letter founder and editor Martin Straith joins Michael to discuss what this divergence in policy means for investors – and more importantly, the specific markets that will benefit.

The interview with Martin starts at 17:30. Click Here to listen in.

In the interview Martin offered MoneyTalks listeners a Special Offer, and will donate $50 each to Kids Help Phone & Special Olympics for every new subscription. Here is the Special Offer:

All 3 services for only $999.95 per year Subscribe

The Trend Letter = $599.95 $399.95 per year  Subscribe

Great track record dating back to 2002, a weekly publication covering global bonds, currencies, equities, commodities, & precious metals

Trend Technical Trader = $649.95 $399.95 per year Subscribe

A premier hedging service designed to profit in a declining market. Includes our proprietary Gold Technical Indicator (GTI)

Trend Disruptors = $699.95 $399.95 per year Subscribe

A service for investors seeking to invest in advanced, unproven technology stocks on the cheap, with the objective to sell them when masses finally catch on. Covering Artificial Intelligence (AI), Virtual Reality (VR), Augmented Reality (AR), 5G & many more

If you have any questions, send us a note at info@thetrendletter.com.

Trend News Team

Stock Market ‘Red Flag’ close to being triggered

This bull market in stocks is still very much alive, and we are even anticipating a powerful run or ‘melt-up’ before it is all over. But after this big ‘melt up’ we expect that we will have a ‘melt down’.

Whether our prediction of a melt-up is true or not, the next question is when does this nearly 10-year bull market end? One of the key indicators that we trust to tell us when this powerful stock market bull run will end is if we see an ‘inverted yield curve.’

Typically, long-term interest rates are higher than short-term rates, which makes sense the longer someone owes you money, the greater risk  that you won’t be paid back in full increases the further out in time you agree to lend.  Meaning that all things being equal, your risk is much lower when lending for 3-months versus 10 years.

But on occasion when the Federal Reserve wants to slow the economy down, they push short-term rates higher than long-term rates. When that happens, we have what’s called an inverted yield curve. History shows that every stock market top over the past 40 years has been preceded by an inverted yield curve, so when it happens, we must pay attention.

An inverted yield curve is a leading indicator, meaning that the stock market top does not happen right after the yield curve inverts. Typically, the market crash starts 12-18 months after the yield curve becomes inverted. The two most recent time we saw an inverted yield curve in was in 1999 before the DOT COM crash in 2000 top and 2006 before the global financial crisis in 2008.

Today, the spread between US 2-year & 10-year yields is just .27% and is threatening to invert very soon.

yield_curve0922

If we see the yield curve invert in the next few months, we could then expect to see a serious market crash or correction 12-18 months later.

Given that the yield curve has not yet inverted we could have at least another year before the ultimate end of this bull market. If the yield curve inverts in the next few months, we should see the  end of the bull market sometime in 2020/2021. When the melt-down starts, it could be the nastiest of our lifetime, worse that 2008.

All investors need to start planning so they have an exit strategy for when the market has a significant decline…we can discuss how to do that later. The coming bear market crash may not be imminent, but it is coming.

Do you have a strategy to protect your wealth when the melt-down comes? Seriously consider subscribing to Trend Technical Trader, which is a hedge service designed to not just protect you in a melt-down, but to allow you to profit from a melt-down.

Stay tuned!

Global Market Update – September 5/18

To be a successful investor today you must understand what is happening in the markets globally, one cannot simply look at what is happening domestically. Capital flows out of perceived risky areas, and into perceived safer areas.  The current perceived risky area is the emerging market debt, and in particular, emerging market debt denominated in $US.  This is a theme that subscribers to The Trend Letter are well aware of, and one that could well be the start of the global debt crisis that we have have warned about for a couple of years now. We recently posted a blog on this issue which you can read here.

When viewing the following charts, note how it is only US equities, and the US dollar that are in uptrends.

Global Equity Markets
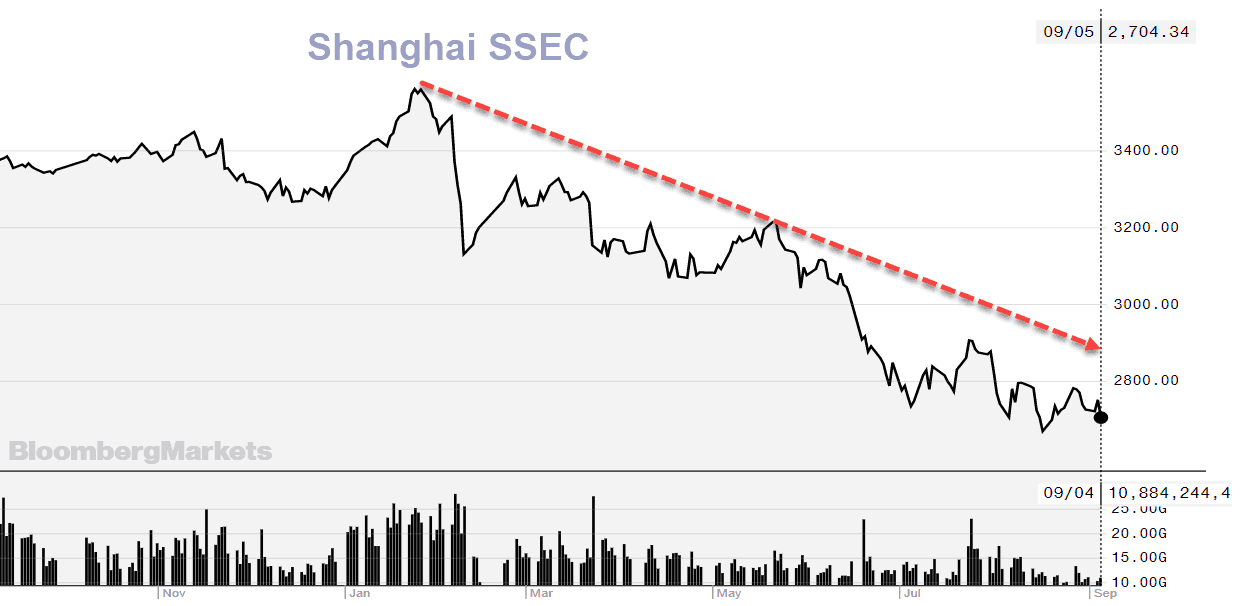
Asia

The Asian markets opened first and sold off on light volume, as concerns continue to grow over US dollar denominated debt in emerging market countries.

Shanghai was down 1.68% on light volume. Down 24% since January

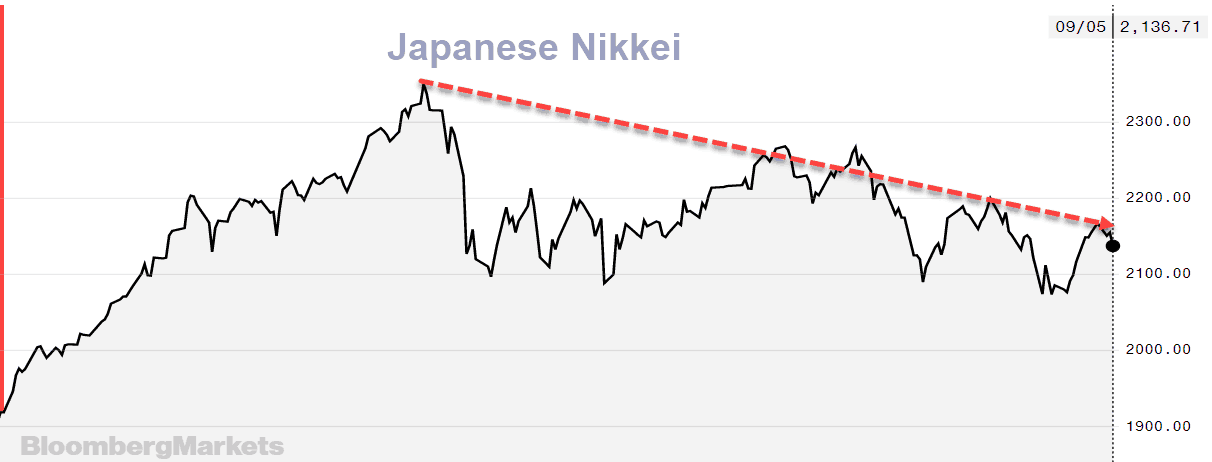
The Japanese Nikkei was also down, but only .82%. Down 9% since January.
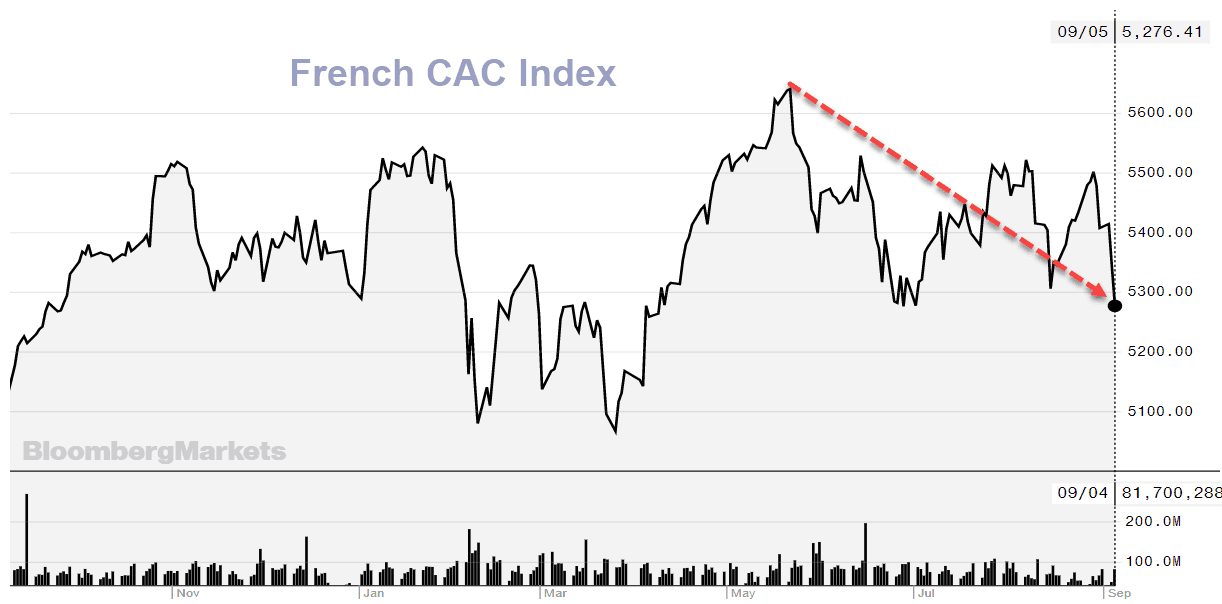
Nikk0905

Europe

European markets were the next to open and they too felt the tension over emerging market debt, as well as trade concerns. The UK FTSE, German DAX, Italian MIB, Spanish IBEX, were all down about 1%, but the French CAC lead the decline at -1.57%. CAC down 6.7% this year.

CAC0905

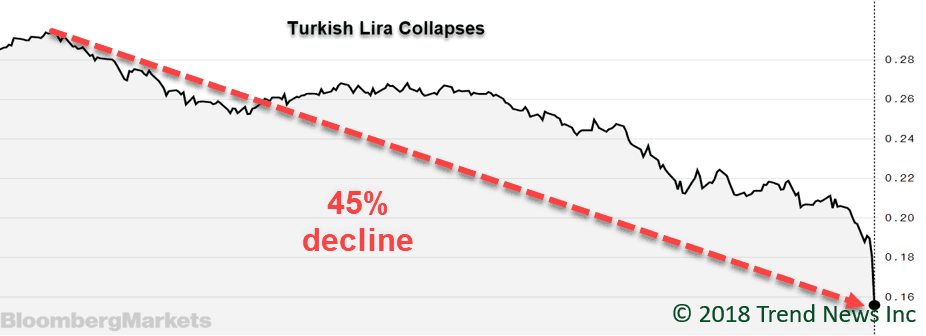
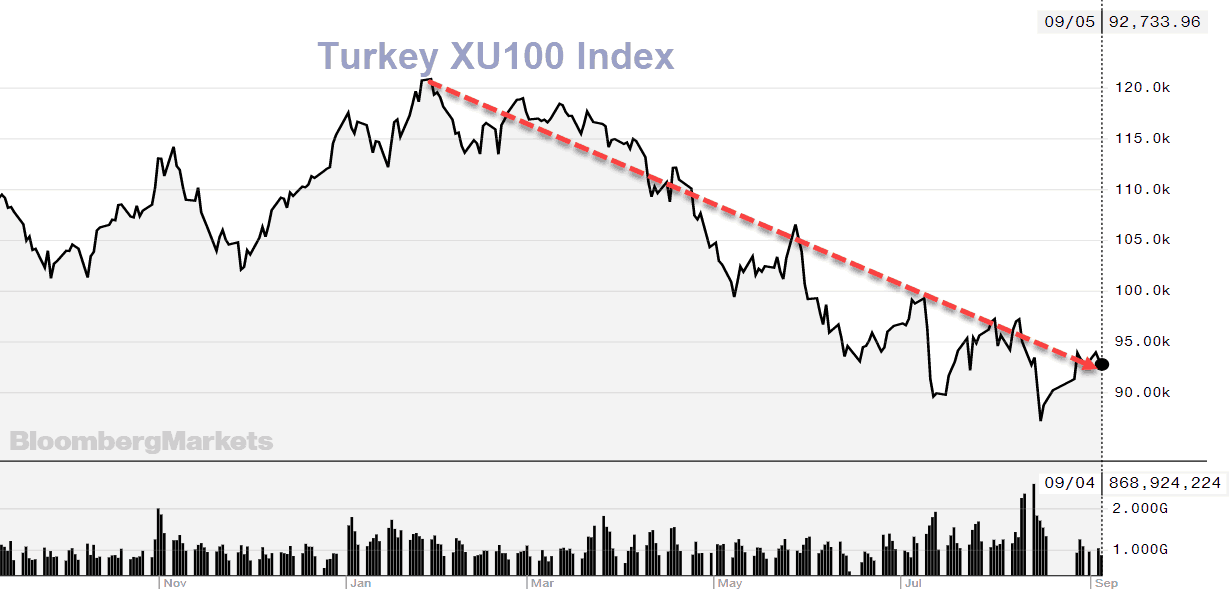
Turkey saw its stock market drop .43% today, and is down about 24% this year.

Turkey XU-100

North America

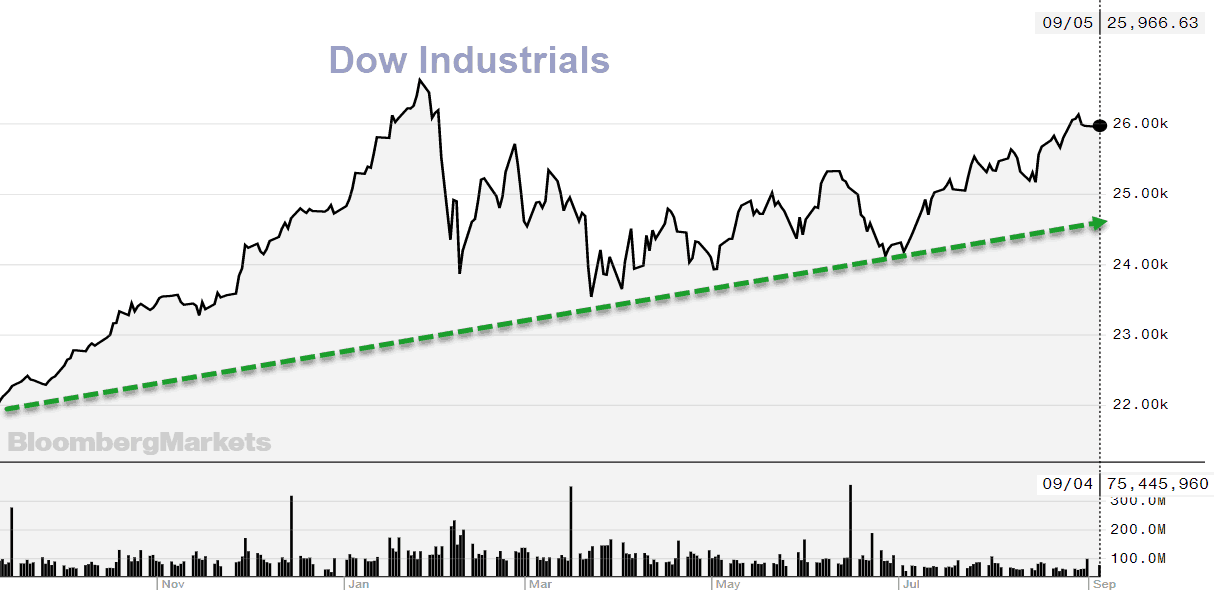
North American stocks were mixed today, with the Dow Industrials up slightly by .09%, but remains in a solid uptrend, up 19.4% year over year.

Dow0905

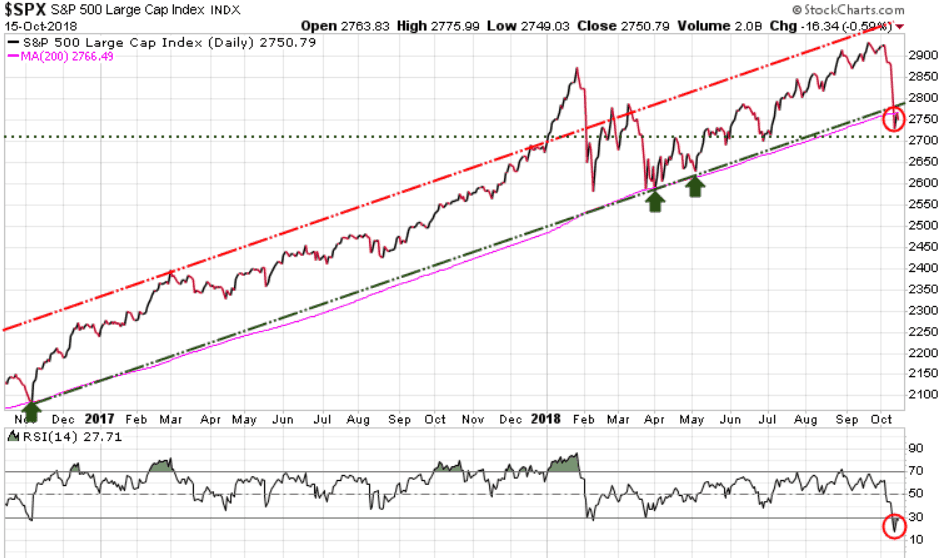
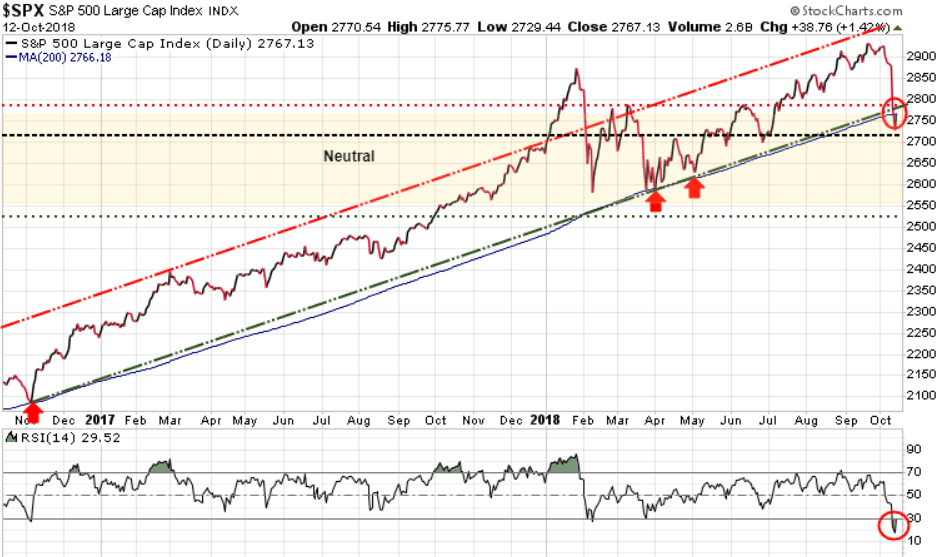
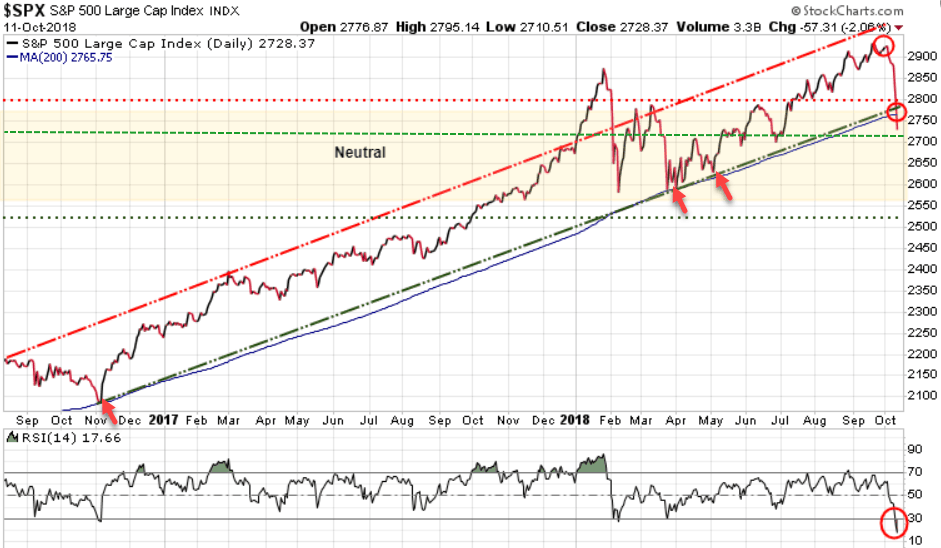
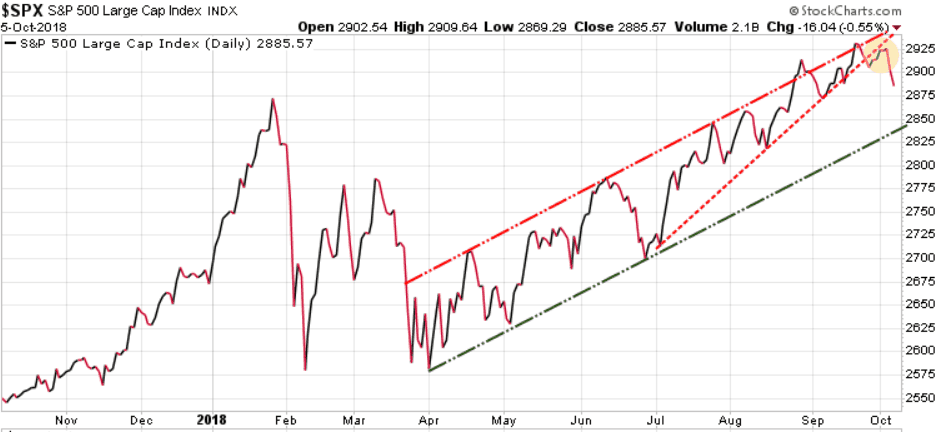
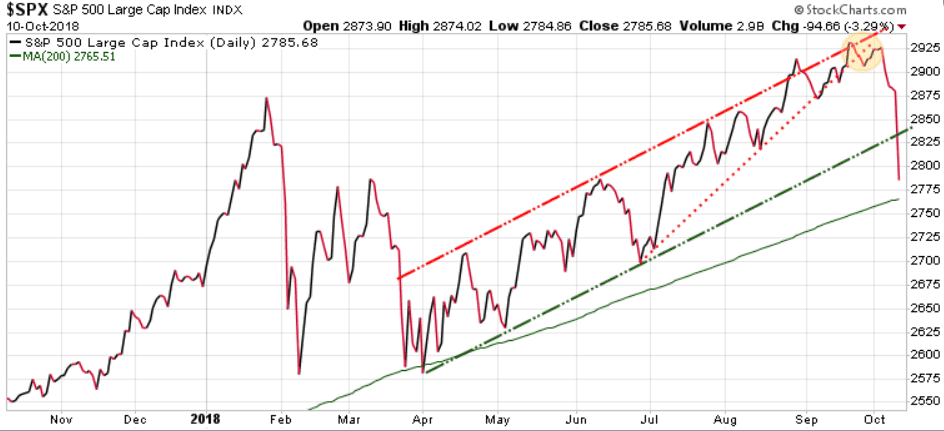
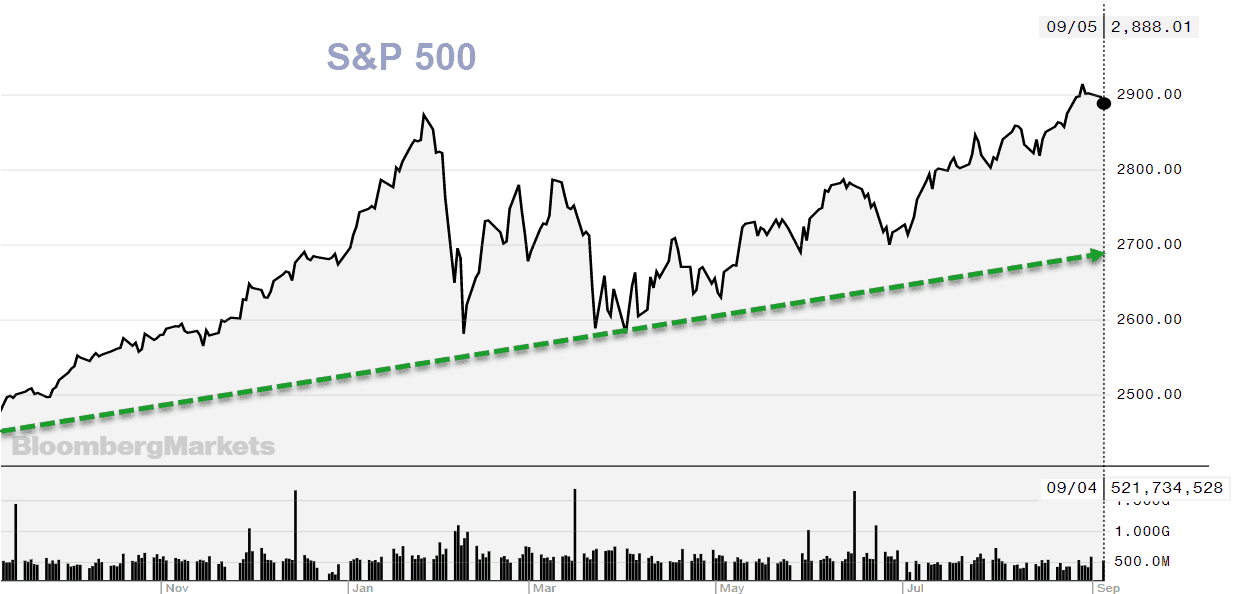
The S&P 500 was down slightly by .28% for the day, but is also in a strong uptrend, up 17.5% year over year.

S&P0905

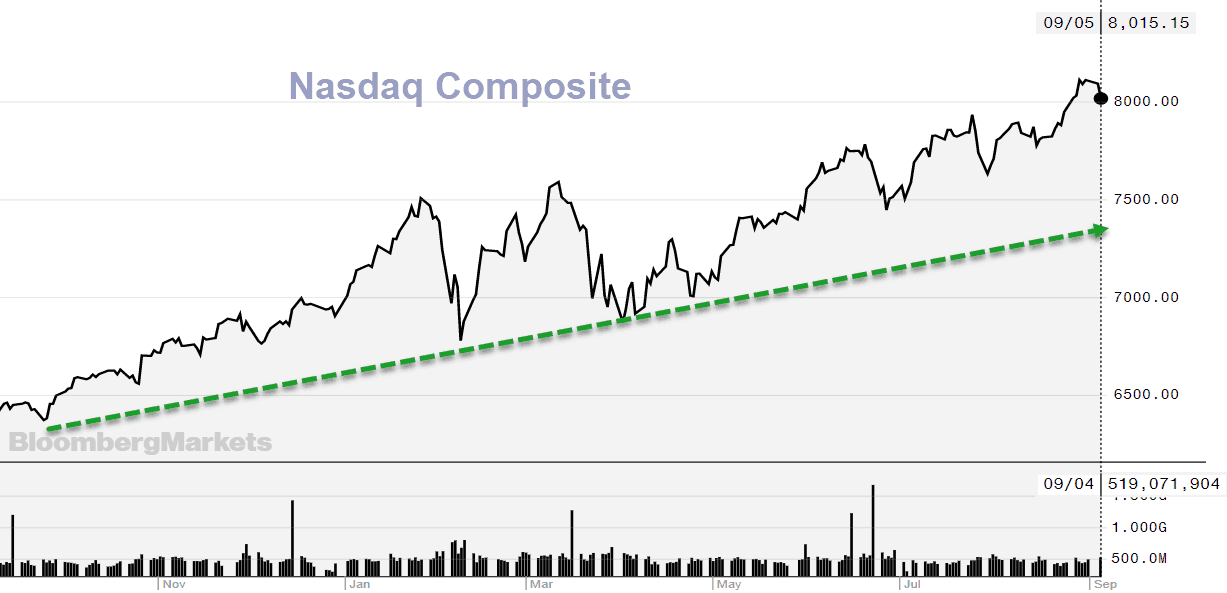
The Nasdaq was the big loser in the US, down 1.16% with Netflix leading the decline, down over 6% on the day. Tech stocks have been the biggest gainers, up 25.7% in a year. But they will also take the biggest fall in a correction.

Nasdaq00905

Global Currencies

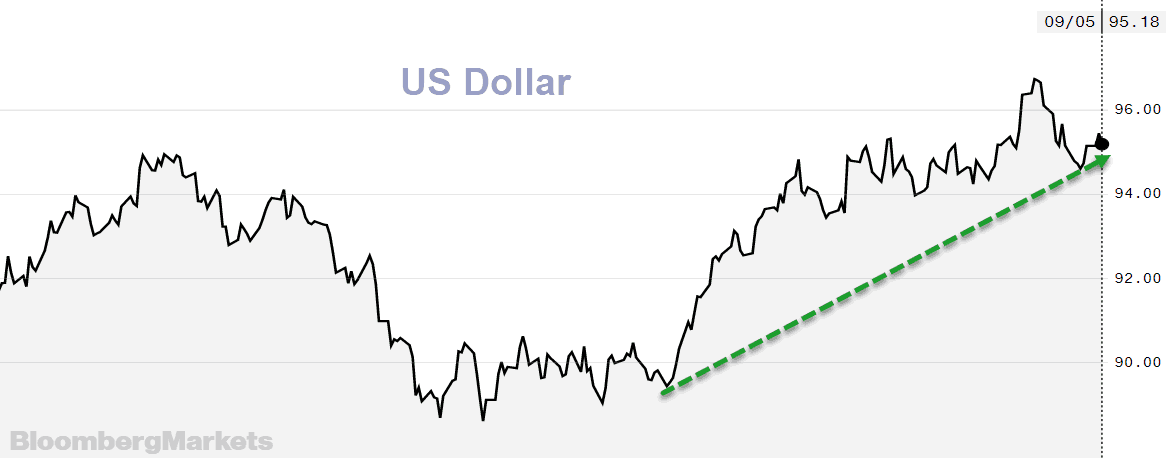
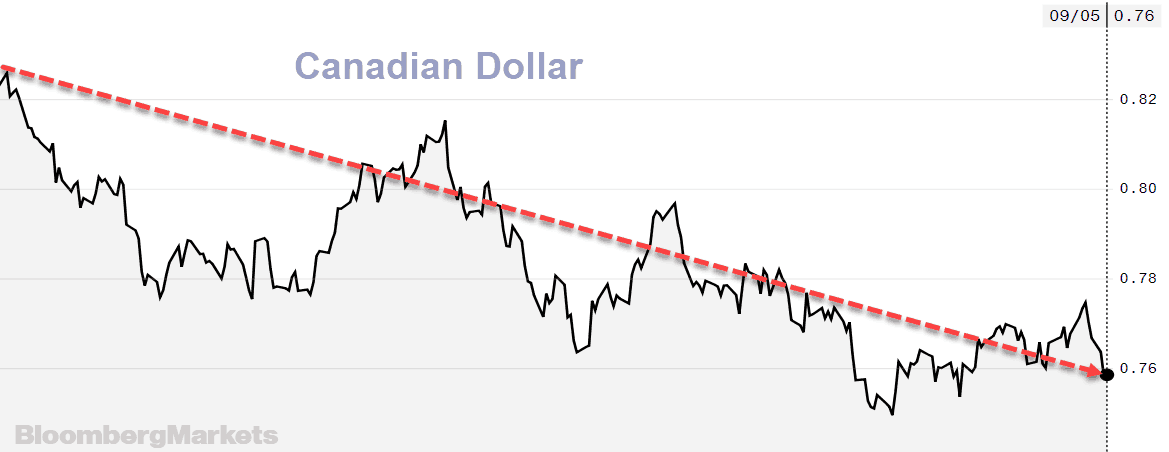
US dollar was down slightly on the day. Expect the $US to remain strong against most currencies for the foreseeable future.

 USD

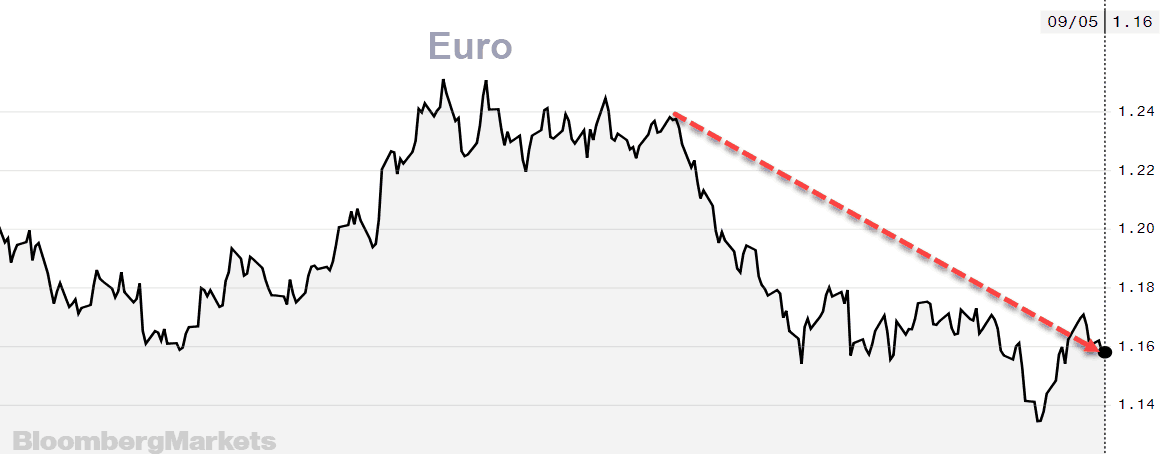
Euro struggling to gain traction. We expect the Euro to go into crisis mode in the next year.

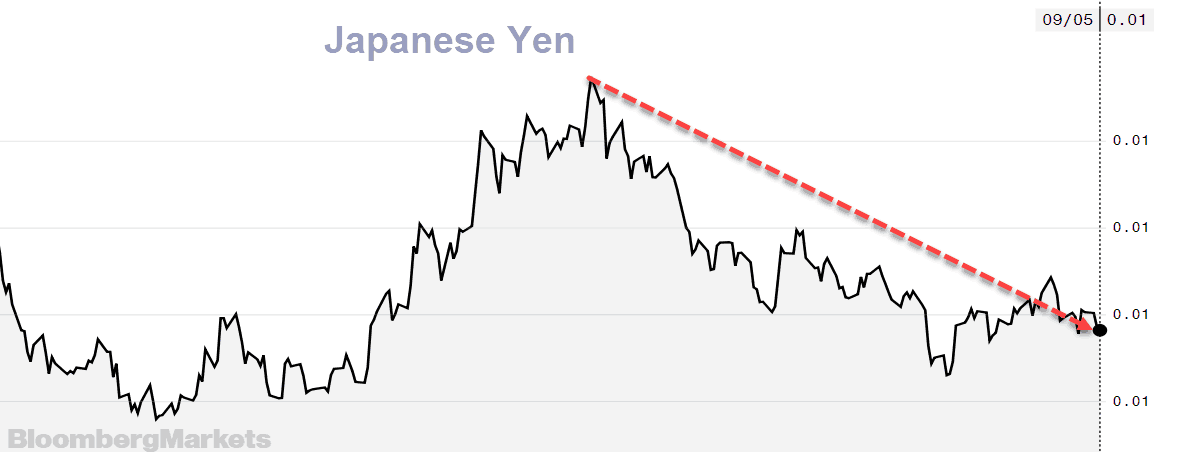
Japanese Yen can be a ‘safe haven’ play, but concerns over Japanese debt is well founded. Ultimately, the Yen will decline steeply.

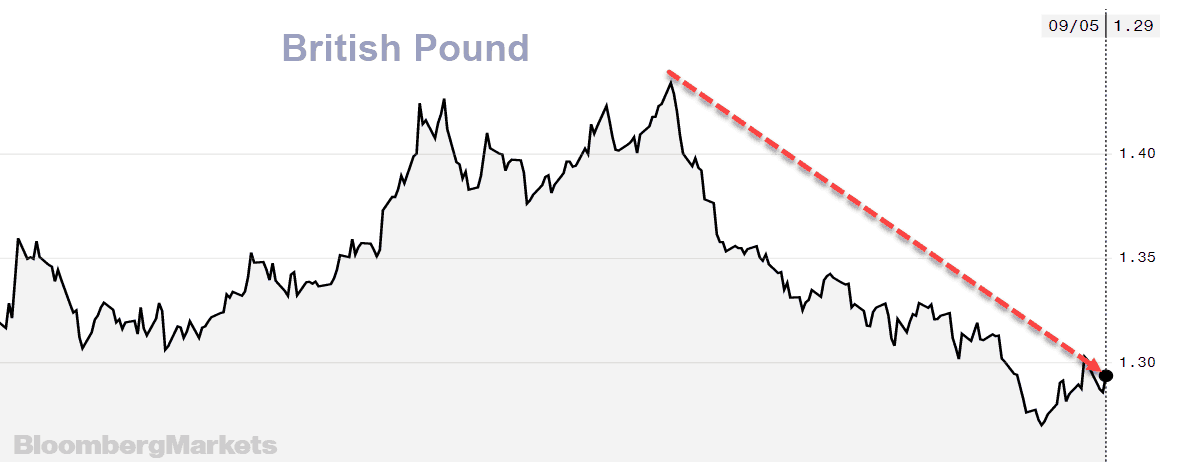
British Pound will continue to struggle with BREXIT noise.  We are bearish long-term.

Pound0905

Canadian dollar heavily impacted by NAFTA concerns. Will rise when commodities rise.

  Candollar0905

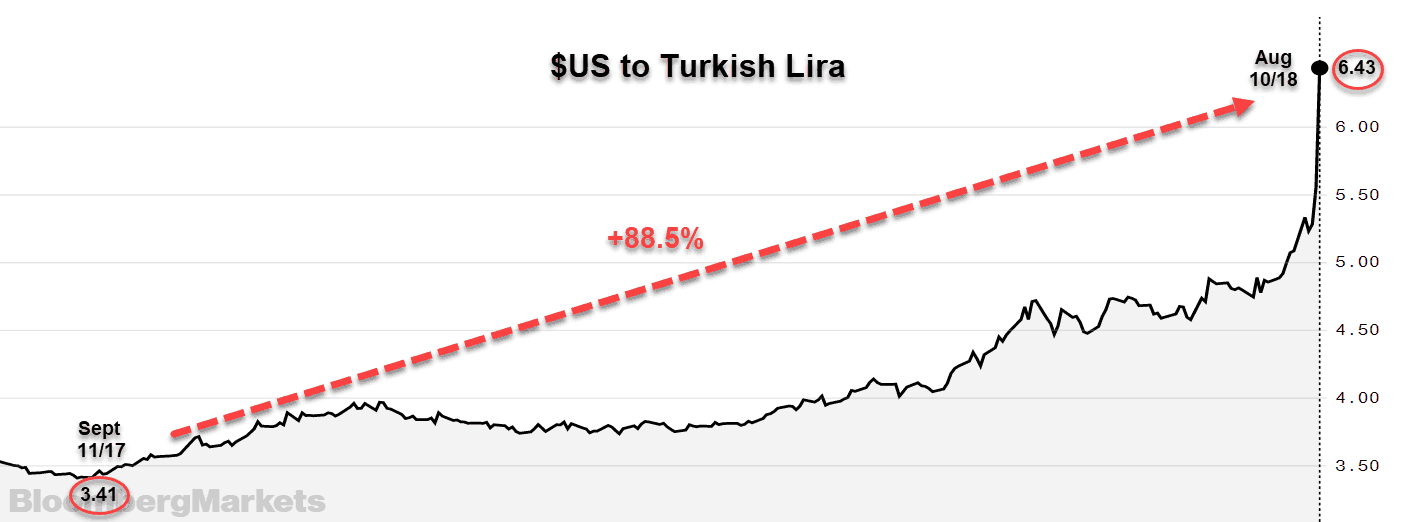
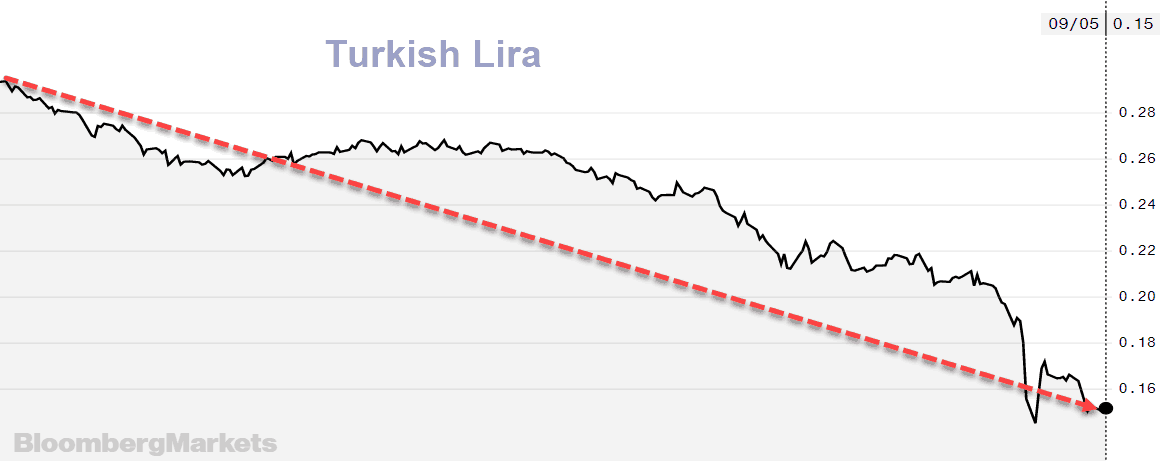
Turkish Lira down over 47% in the last year. Could be the canary in the coal mine regarding emerging market debt crisis.

Turkish Lira

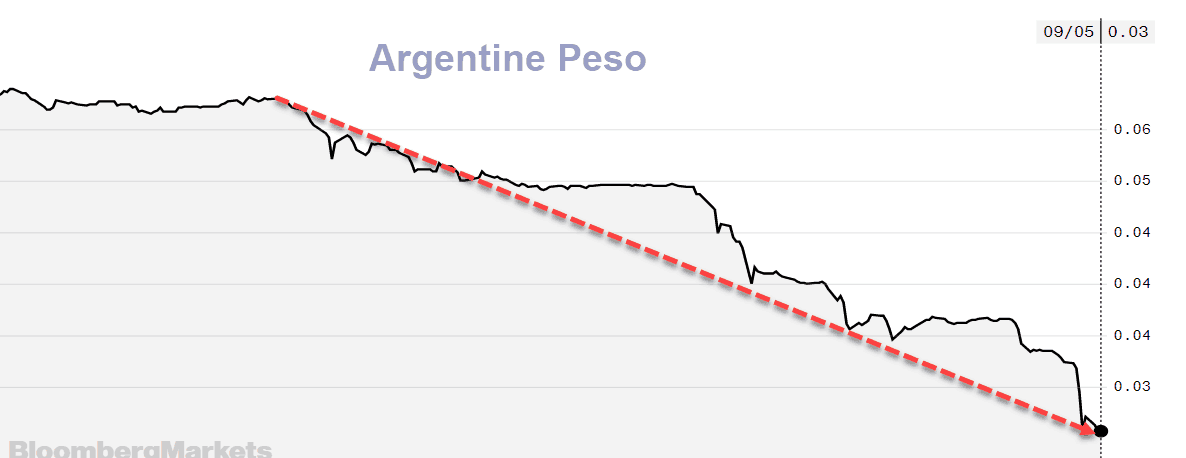
Argentine Peso down 56% in the last year. Another leading candidate for debt default.

ArgPeso

In addition to the very real and legitimate concerns over emerging market debt, we have the coming US elections, and the concerted effort to take down Trump. Whatever one’s feelings are for Trump the person, his policies have been very good for the markets. If Trump goes down, so will the markets. If you don’t have a strategy to protect yourself in a severe market decline, check out Trend Technical Trader.

Stay tuned!

The selected Optin Cat form doesn't exist.

Oh yeah, Turkey matters – here’s why

In the last few days we have received various forms of this question.

Why should we care about a currency crisis in Turkey?

The reason that investors need to ‘care’ about a currency crisis in Turkey is that despite all the trade war talk, we do live in a global economy. In The Trend Letter we cover global bonds, currencies, equities, commodities, and precious metals. We do this to show our subscribers how these sectors are all connected, and how a sharp move in one sector will affect other sectors.

In Sunday’s issue, we showed subscribers how a collapse in the Turkish Lira could be the next domino to fall in what we have been warning about…a global sovereign debt crisis. Here are the points from Sunday’s issue:

  • The big currency story last week was the collapse of the Turkish Lira
  • The Lira has lost 45% of its value since September & almost 20% in the last week
  • Turkish President Erdagon called the plunge a ‘fluctuation’

  • While most investors will simply shrug at this news, we are on alert for contagion to hit Europe, and the emerging markets
  • European banks are carrying over $220 billion in $US denominated debt from Turkish companies
  • With the Lira plunging in value vs the $US, it means it will cost these companies a lot more to service these debt payments that are denominated in US dollars
  • In fact, a company today would need to pay 88.5% more to buy the same number of $US dollars to pay their $US denominated debt payment than it would have last September
  • On September’17, for a Turkish company to make a $1 million dollar debt payment, it would have cost them 3.41 million Lira
  • Today, to make a $1 million payment, it would cost them 6.43 million Lira

Liracost

  • This will put a great deal of pressure on these Turkish companies to pay their debts
  • Understand that the issues in Turkey are wide spread in many emerging markets…they borrowed heavily in US dollar denominated debt when US rates were historically low
  • And now with the $US rising, these debts will become much more expensive to service

The key here is that Turkey is just one of many emerging market countries that have borrowed enormous amounts of debt that is denominated in US dollars. According to the International Monetary Fund (IMF) and supported by the Bank of International Settlementsemerging market borrowing has doubled in the past five years to US$4.5 trillion.

Global investors are now targeting countries with similar economic challenges, whether they be bloated current account deficits, inflationary pressures, or high debts denominated in foreign currencies. We are seeing currencies in Argentina, Brazil, Chile, Hungary, Mexico, Indonesia, India, Poland, and South Africa all taking a hit.

What many investors do not understand is that pension funds who need ~7% annually to meet their obligations could not survive buying government bonds paying around 1% (and in Europe paying negative yields), so they sought other, more risky investments.

When Turkish bonds collapsed and were paying yields of 20%, many banks and pension funds scooped them up, assuming they were safe. If your pension fund or mutual fund owns a bunch of Turkish government bonds, or bonds of Turkish companies, then that is why you should ‘care’ about  an economic collapse in Turkey.

When global capital is worried about a currency, it moves out of that currency and into a perceived safer currency. Right now the perceived safest currency in the world is the US dollar. In our February issue of Trend Letter, we made a currency recommendation that would benefit greatly from a strong US dollar. That trade is up over 21% in 6-months.

This strong US dollar vs almost every other currency is getting overbought here, so we should see a temporary reversal. But long-term, understand that $4.5 trillion in US dollar denominated debt is coming due, and with the US dollar much stronger today than it was when these funds were borrowed, it tells us that these emerging market companies and countries will need to buy a lot of US dollars in order to service those debts.

Stay tuned!

Don't Miss the News That Matters Most!

Just because you're busy doesn't mean you should miss what's driving the markets each day. Let us find the headlines and deliver them directly to your inbox every weekday morning. We also send you 'Todays Charts' at the end of each trading day. All FREE!

We respect your privacy.


Special Olympics offer

Since March 2002, Trend News Inc has been publishing The Trend Letter as one of the top performing investment newsletters in existence. From its recommendations to buy gold in its very first publication at $290 in March 2002, and subsequent sell signal at just under $1,800 in August of 2011, The Trend Letter was off to a tremendous start. While gold climbed over 500% in that timeframe, most of the gold stocks recommended performed even better.

gold2002

It did not stop with gold, as in 2003 the recommendation to load up on uranium stocks netted subscribers massive gains, from 0ver 300% to gains of 1023%, 1478%, and even 1525%.

uex

BUY recommendations are important, but it is our SELL recommendations that ensure the gains and protect our subscribers when markets turn down.

In July 2005, we warned about a real estate crash and strongly urged subscribers to get unleveraged if speculating in that market. We said:

“Never before have homeowners and investors been so heavily leveraged in the homes they have bought, and never before have they been so optimistic in their expectations. Unfortunately, we believe that like never before, we will see some serious losses in this market – just like the tech boom. Do not be the last one into this market and expect it to keep going up. If you have bought a home to enjoy and you can afford it – relax. If you have bought on sheer speculation and you cannot afford a drop in price – be warned.”

In December 2006 we started warning of a stock market meltdown. Then in May 2007 we gave a final alert…weeks later the top was in

 “We have locked in our profits on most of our equity positions, hopefully subscribers have followed our lead. We know that it is tough to SELL when everyone one is telling you to BUY, but our indicators are signalling this is the final warning to get out of equity stocks.”

Since 2009, the equity markets have been on an historic bull run, and there may still be a final melt-up run before the top is in. The key question now for every investor is, are you prepared for the inevitable market melt-down? As we have warned, so far in 2018 we have seen volatility rising. It is a statistical extreme that a major index would vacillate so many times, as it has done this year, around the year’s break-even level.  Especially this far into the year.

To be a successful investor today, you need to know when to buy and when to sell. That is what The Trend Letter does, it gives subscribers entry and exit strategies.

In these volatile times, investors must also have hedging strategies to handle severe corrections. This is exactly what our Trend Technical Trader (TTT) service provides. TTT is a hedging service that allows investors to profit in both up & down markets.

A yearly subscription to The Trend Letter normally costs $599.95 per year.

A yearly subscription to Trend Technical Trader normally costs $649.95 per year.

For any participant in the Special Olympics golf tournament, we are offering a combination subscription of both The Trend Letter & Trend Technical Trader for only $599.95 per year.

To take advantage of this offer click here

Headlines – May 11/18

  • Europe moves to safeguard Iran interests after US pull out. Read story
  • Did the FBI engage in outright spying on the Trump campaign? Read story
  • How Saudi Arabia can plug the hole left by Iranian crude without wrecking the OPEC deal. Read story
  • Former Blackberry CEO Balsillie says Facebook and Google are ‘entirely driven by mass surveillance’ and ‘we are cascading toward a surveillance state’. Read story
  • Trump swings for the bleachers. Read story
  • Pence warns Mueller “Wrap it up.” Read story
  • Japan’s single women are a burden on the state, MP says. Read story
  • Apple is battling Amazon to control the future of TV bundles. Read story
  • Ecuador’s new rules ban Assange from taking visitors or phone calls – WikiLeaks. Read story
  • Snapchat has started rolling back its redesign, as research shows  how wildly unpopular it was with millennials. Read story
  • US Postal Service gets whacked with $1.3 billion loss as it struggles to keep up with Amazon. Read story
  • Nestle falls behind as millennials warm up to frozen meals. Read story
  • What Walmart bought for $16 billion: a sliver of India and a lot of hope. Read story
  • Babies would rather talk to other babies than listen to your baby talk. Read story
  • On the lighter side. Check it out!

Stay tuned!

The selected Optin Cat form doesn't exist.