How shall we communicate?

Satellite

There are many ways to communicate, and big improvements are underway to dramatically increase the overall volume and speed of data communications.  Starting with the volume of information to be communicated, there are several technologies that will potentially process more data at higher speeds than ever thought possible.  Quantum computing is a holistically new way to solve difficult problems based on the principles of quantum physics.  This is where high-end computing is heading, giving us a sense of how super computers, super data centres, and super cloud networks will look and operate.  The research investment already tops $10b US, being led by USA, China, Australia, the European Union, and many other countries.  Google, IBM, and Intel all want to transition the technology into commercial services and products, targeting applications in data analytics, logistics, engineering, and software automation.  Today’s best quantum computing systems are being developed in research laboratories; however, they have not yet succeeded in justifying long-term growth or producing commercially viable products and services.  Like many new technology developments, some will be in our hands tomorrow, some next week, some next decade.  And some may not ever get off the test bench – that is the nature of disruptive technology.

One way or another the amount of data we will have at hand is going to increase and the ongoing challenge is to manage all that data effectively.  Managing it requires effective storage and communication solutions.  The preferred method for data storage is the cloud, and the preferred method for global data communications is satellite transmission.  New technologies that can improve on the status quo will be in high demand.  In the processing and storage field there are several developments that hold promise, such as new and more efficient enterprise database designs, and new cloud networking solutions, some based entirely on satellite networks.  Amazon’s Web Services (AWS) segment needs all these new solutions in order to grow their business around the globe.  As partnerships form to seamlessly integrate these services, global expansion becomes more efficient and a must-do for many multi-national corporations.

The Trend Disruptors team is watching new technologies and identifying the companies that stand out in terms of investment potential.  These companies may be large or small, and some of the small start-ups will make the grade and succeed, either on their own or by being acquired by larger organizations.  The best and most promising will generate Trend Disruptors recommendations.  We are watching a broad range of companies and technologies, all striving to disrupt specific market segments and industries.

Let Trend Disruptors be your guide to the future, as we continue to identify technology investment opportunities that can lead to financial success.

Note we will be posting a couple of new recommendations this week to subscribers of Trend Disruptors Premium. If you would like to subscribe to Trend Disruptors Premium and receive all of the recommendations we are offering a discount rate of $399.95, a discount of $200. To take advantage of this special rate Click Here

Stay Tuned!

Everything you need to know about the coming disruptive technologies such as AI, VR, 5G, Blockchain, Crypto Currencies & More - Free!!
Understand these powerful new technologies that will revolutionize how the world does business
Privacy guaranteed!

October 29/18

Stocks:

Another wild day as the markets opened strong, dropped dramatically, recovered some of those losses, but finally closed lower. The Dow had a swing of over 900 points during the day with the S&P and Nasdaq also having tough days. At the end of the day the tech heavy Nasdaq was down 2.02%, the Dow down .99% and the S&P down .66%.

The big talking points today were more China/US trade tensions, trading algorithms, and the US elections, where polls are showing that the Republicans will lose the House.

We now must watch to see if the 2600 level holds and particularly the 2580 level (green horizontal line).

spx1029

Key support levels to watch this week are 2600, 2580, 2535

Understand that the long-term trend is still bullish and will be as long as the S&P 500 holds above 2300.

Long-term trend is bullish

Immediate trend is bearish

Our current position is neutral

Gold:

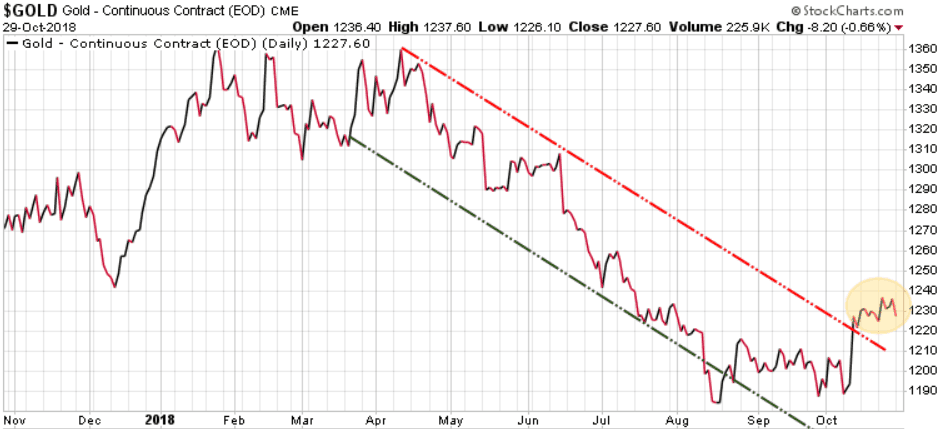
Gold continues to struggle to maintain any ‘safe haven’ status as it was down 8.20 today, even with all the market angst.

gold1029

Currency:

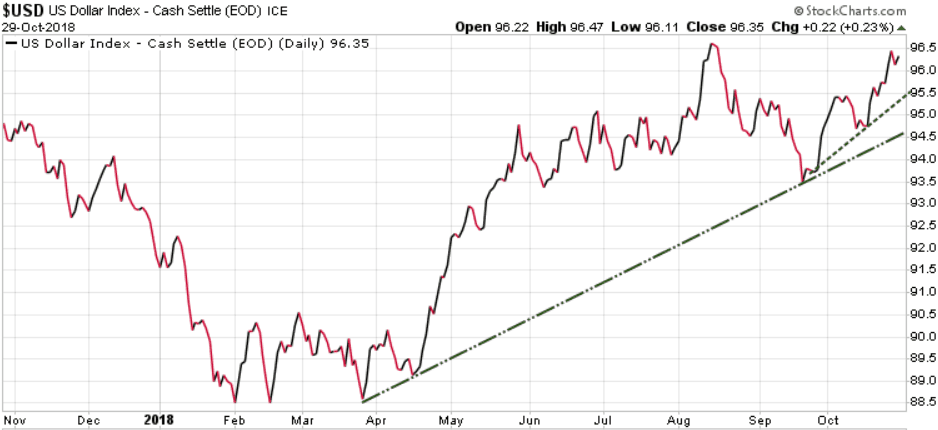
Global capital seeking a ‘safe haven’ continues to flow into the US dollar.

USD1029

Stay tuned!

October 24/18

Stocks:

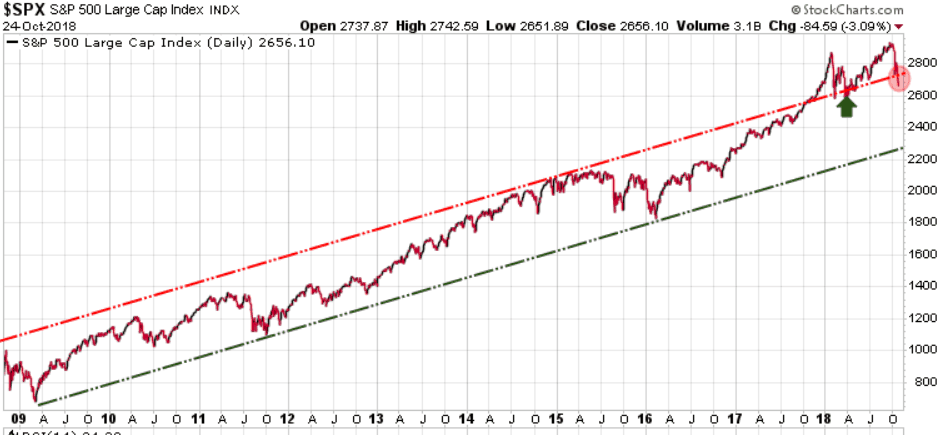
Today stocks fell sharply lower as losses accelerated into the close, which put both the Dow and the S&P 500 into the red for the year, and the Nasdaq into correction territory (10% decline). The S&P dropped whopping 84.59 points or 3.09%.

There are lots of news items driving this decline, but we believe that politics is now moving front and centre.  It is already ugly, but this US election is going to be very destructive. We live in Canada and have no vote in the US election. Our role is to help investors understand what is happening in the global economic environment and to help subscribers protect and grow their wealth.

What we do know is that whatever your opinion of Trump the person, his policies of lower taxes and reduced regulations have been very  good for US businesses, and they have been key drivers for this bull market.  The market right now is very concerned that if the Democrats win the election, these tax breaks and reduced regulations will be rolled back, hurting the profitability of these companies, so they are selling off.

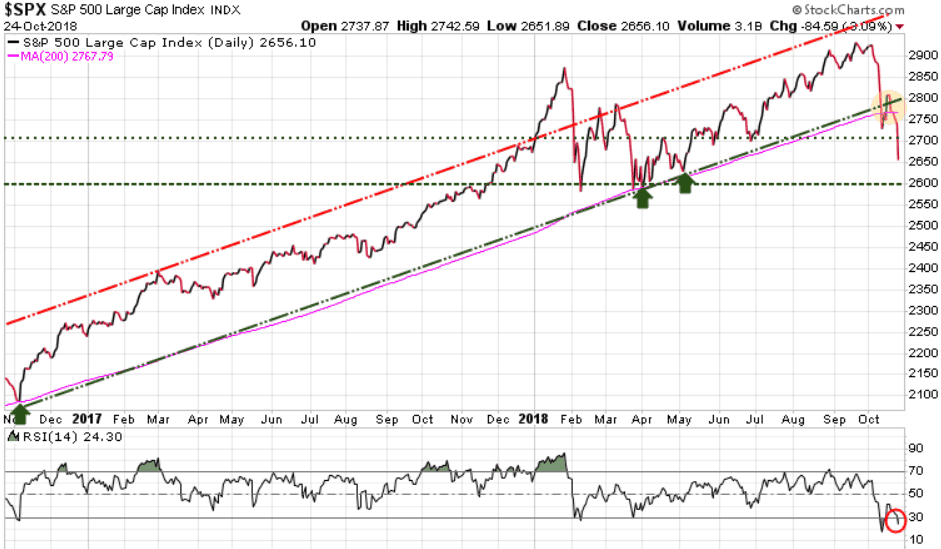
On a technical basis the S&P closed 111 points below its 200-day MA (pink line), which clearly bearish. It has also fallen definitively below its 2-year uptrend channel, also bearish.

Our next key support level is the late March low at 2600.  Our yearly forecast target low for the S&P had a potential for 2535, then 2470. Both of these will become valid if we break the 2600 level.

Looking at the bottom of the following chart we can see that the Relative Strength Index (RSI) has dropped to 24.30 (red circle), and whenever we see a reading below 30, it is considered oversold. This does not guarantee a rally here, but it does set up for at least a bounce soon.

spx1024

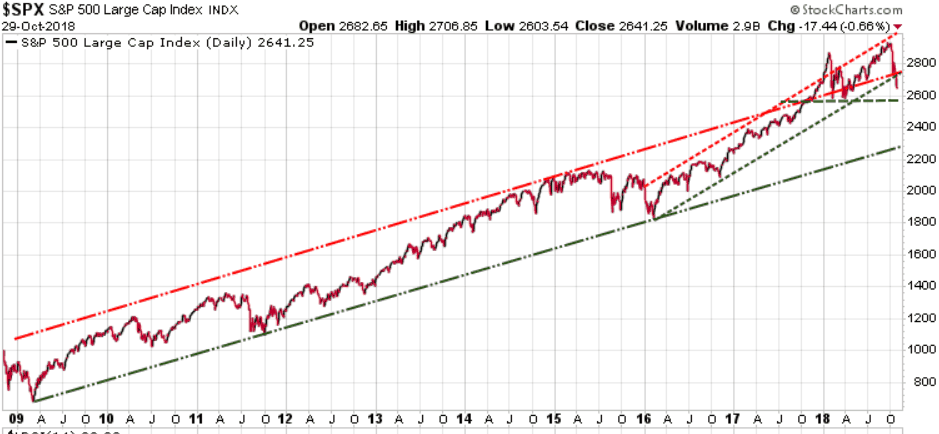
Looking at the bigger picture we see that the S&P has been trading above its 9+ year uptrend channel, although it has now fallen below the upper level of that channel.  All this action is bearish, suggesting that the S&P will very possibility test the 2600 level.  Given that markets decline much faster than they rise, we could see this support level hit this week, although the RSI suggests we see a bounce very soon.

spxlong1024

Understand that this is still a long-term bull market and that corrections are to be expected along the way. This bull market has been so strong over the past two years it appears some investors forget that corrections can be a healthy part of the process, they provide buying opportunities. We will see if this is simply a healthy correction or if it is the start of a new bear market. Everyone has an opinion, we will simply watch the numbers.

Long-term trend is bullish

Immediate trend is bearish

Our current position is neutral

Again we note: Whether you believe that this market is going to run much higher, or believe that we are now heading for a big crash, you need to have an exit or hedging strategy. This bull market will end, whether it starts today, next month, next year, or 2-years from now. Every investor needs to have a strategy to protect your wealth against a serious downside move that is accompanied by recessions.

While we are currently neutral with offsetting long and short positions, our Trend Technical Trader (TTT) hedging service has a number of more aggressive short trades and those trades have gains of 21.16% (entered Sept.5/18), 52.77(entered Sept 2/18), 45.52% (entered Oct 4/18), and 41.81% (entered Oct 4/18). All of these trades are simple click of the mouse actions, the same as trading any stock online. If you would like to subscribe to TTT, we are extending our Special Offer at $399.95, a $250 discount. Click Here to subscribe at this rate. It’s your money – take control!

Gold:

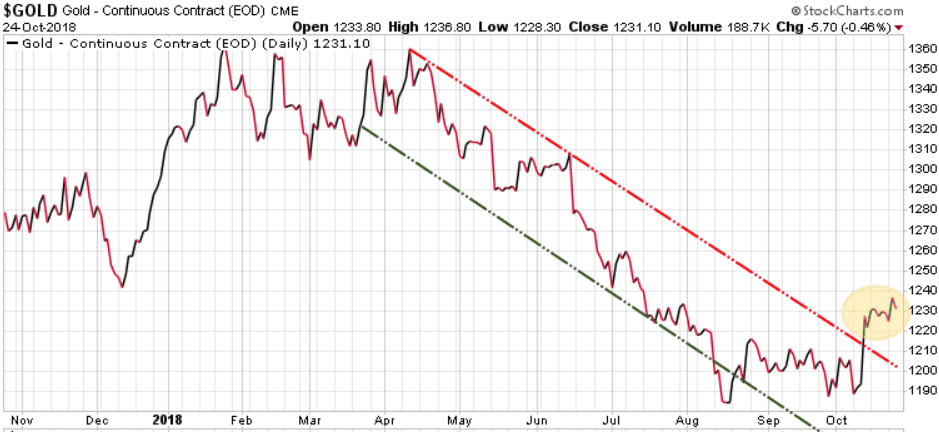
Gold was a big disappointment today, down 5.70, as it failed as a safe-haven play against a crashing equity market.  The safe-haven winners today were US bonds, the US dollar, and to a lesser degree, the Japanese Yen.

gold1024

Immediate trend is bullish

Long-term trend is bearish

Our current position is a buy

Stay tuned!

October 23/18

Stocks:

Another wild day in the markets with the S&P 500 trading in a range between the high at 2753.59 to a low of 2691.43, before rallying back some to close at 2740.69, down 15.19 or .55% for the day.

The latest news driving the market down was..

  • a Chinese official told a group of U.S. business leaders that China is not afraid of a trade war.
  • the EU has rejected Italy’s budget, demanding changes to both deficit spending and growth estimates. This is the first time the EU has rejected a countries budget. Rhetoric from both sides suggest that Italy’s relationship with the EU is not getting better.

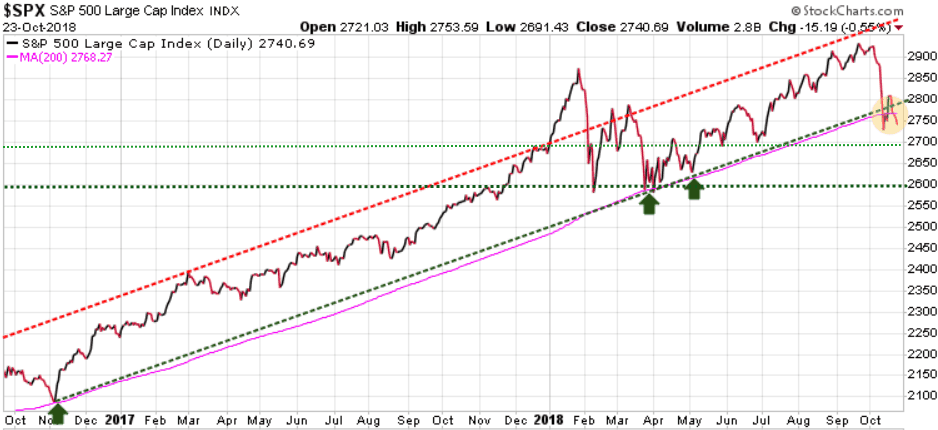
The immediate concern here is that the S&P closed 27.58 points below its 200-day MA (pink line), so we need to keep an eye on this as in each recent test (green arrows) the 200-day MA  support level has held.

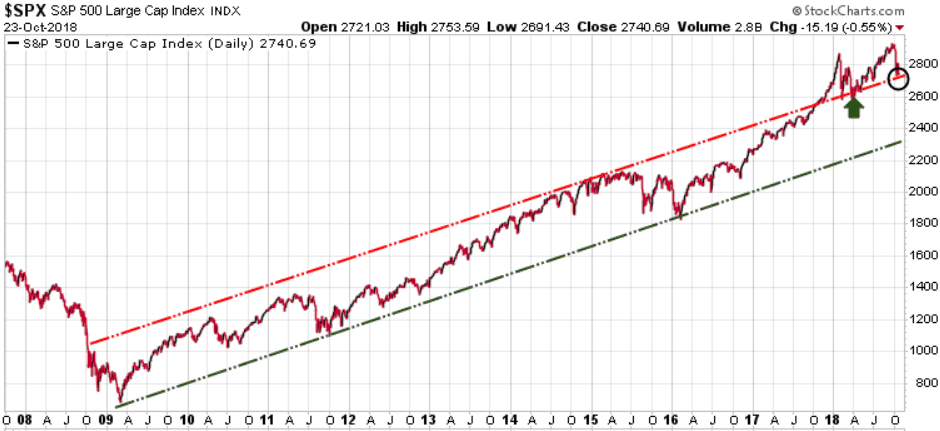
Looking at the bigger picture we see that the S&P is still trading above its 9+ year uptrend channel, although it did dip below the upper level during the day today.  In the near-term we need to see the S&P continue to close above the upper level of that channel at 2715. Keep an eye on this level.

Spxlong1023

Long-term trend is bullish

Immediate trend is neutral

Our current position is neutral

Note: Whether you believe that this market is going to run much higher, or believe that we are now heading for a big crash, you need to have an exit or hedging strategy.  This bull market will end, whether it starts today, next month, next year, or 2-years from now.  Every investor needs to have a strategy to protect your wealth against a serious downside move that is accompanied by recessions.

While we are currently neutral with offsetting long and short positions, our Trend Technical Trader (TTT) hedging service has a number of more aggressive short trades and those trades have gains of 10.9% (entered Sept.5/18), 37% (entered Sept 12/18), 33.8% (entered Oct 4/18), and 30.4% (entered Oct 4/18).  All of these trades are simple click of the mouse actions, the same as trading any stock online. If you would like to subscribe to TTT, we are extending our Special Offer at $399.95, a $250 discount. Click Here to subscribe at this rate.

Gold:

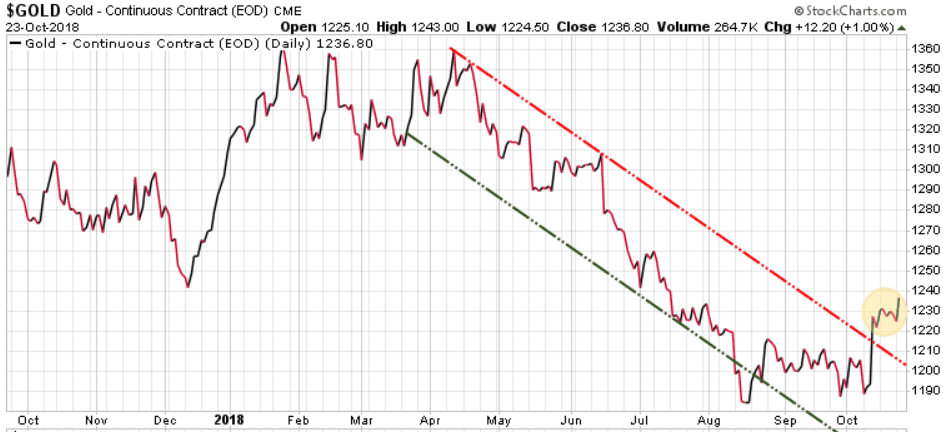
Gold popped up to 1245 at the intra-day high today as the equities were hit, but then cooled off and closed the session at 1236.80, up 12.20 for the day.

 gold1023

Immediate trend is bullish

Long-term trend is bearish

Our current position is a buy

Stay tuned!

October 19/18

We follow the trends and capital flows. Remember, this is a global market, it is all connected.

Stocks

Today was the 31st anniversary of ‘Black Monday’, when in 1987 the Dow dropped a massive 23% in one day.  Today we saw nothing like 31 years ago, with the S&P 500 up almost 30 points, before giving it all up and closing down a single point.  With volatility ramping up, traders are being more reluctant to hang on to stocks over the weekend, fearful that some event (or tweet) could send the market on another sharp decline.

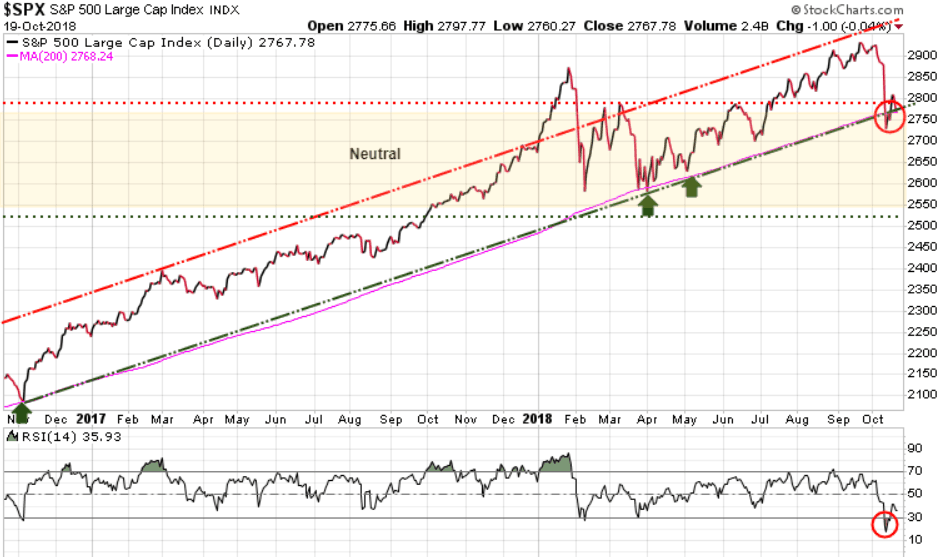
Last week after the large declines on Wednesday and Thursday we highlighted how the 200-day MA (pink line on chart) was a very key support area for the S&P 500. The last three times this support area was tested (November, March, and May) this support level held (green arrows on chart below).

Last week we also noted that the Relative Strength Index (RSI) had dropped to 17.66. An RSI reading above 70 indicates that the market is ‘overbought’  and that investors have become ‘complacent’, with a ‘risk-on’ sentiment. Conversely, an RSI reading below 30 indicates that the market is ‘oversold’, and that investors have become ‘fearful’, with a ‘risk-off’ sentiment. Whenever we get to these ‘overbought’ or ‘oversold’ extremes we typically see the market reverse and move in the opposite direction.

Looking at the lower part of the chart we see that the Relative Strength Index (RSI) is now back above 30, at 35.93.

Continue to watch the 200-day MA and if the S&P cannot climb back and close solidly above this support it means we are not out of the woods yet and that more moves to the downside are certainly possible. If it can hold above that level, then this could be the low for this move and we head higher to test the previous high at 2930.

Long-term trend is bullish

Immediate trend is neutral

Our current position is neutral

spx1019

Gold

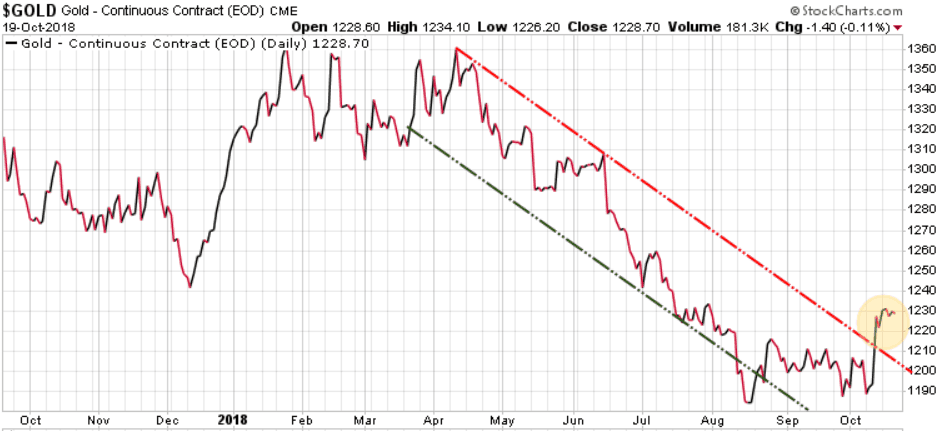
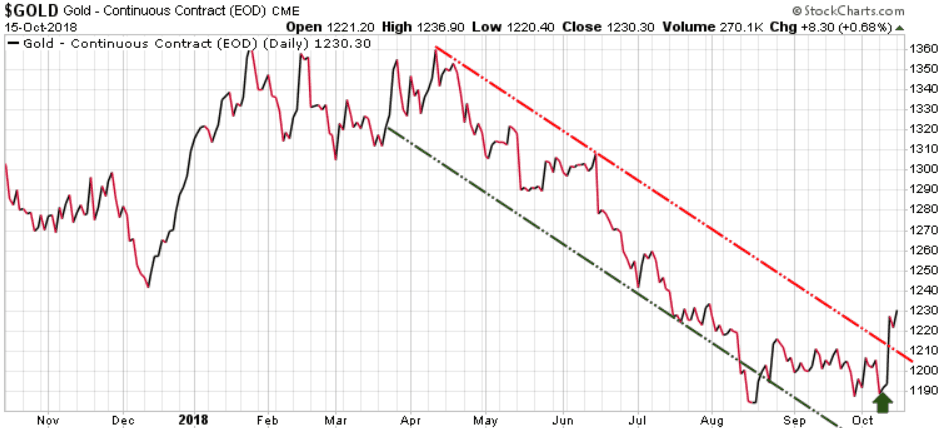
Gold was flat this week, having broken out of its near-term downtrend channel last week. Gold now needs to close above 1246, then push through and close above 1260, 1307, and 1377 to have a chance of having a solid bull run.

Long-term trend is bearish

Immediate trend is bullish

Our current position is a buy


Gold1019

There are talking heads flooding the airways with their opinions, but we just watch the numbers, and let the market tell us what direction it is going. The markets can be very deceptive and will play on your emotions. Instead of forming an opinion of what you think the market should do, watch the key support and resistance levels, and see what the market is actually doing.

The reason that we see the market reverse when it hits extremes is because the majority must always be wrong to fuel bull and bear markets. In the last stages of a bull market a mania is created where everyone wants in. Prices rise dramatically creating a FOMO (fear of missing out) sentiment where the average investor feels incredible pressure to jump into the market, right at the extreme top. At that point the early investors are more than happy to sell to the masses.  These late to the party investors are then stuck holding stocks when there are no more buyers.

In bear markets we see a similar story. As prices start to fall a new panic is created where everyone wants to sell, but there are no buyers, so the decline in prices escalates as everyone is running to the exit. Typically those same late to the party investors who bought right at the top, are the last to get out, often finally selling right near the bottom. And then the cycle repeats.


This weekend’s issue of The Trend Letter will have full coverage of where we sit with all markets, including the equity, bond, currency, precious metals, and commodity markets. If you are not a subscriber but would like to be, we are offering a special discount of $200 off the regular price of $599.95, so you only pay $399.95.  To take advantage of this offer, click here. 


If you have a substantial portion of your portfolio in stocks, or just need to protect yourself in case of a severe correction, seriously consider a ‘hedging’ strategy. While we expect to see higher highs before the ultimate top in this bull market, we certainly expect to see a great deal of volatility along the way. Last week was a wake up call for those who are not prepared for a significant correction.

We do not know of a better hedging service than Trend Technical Trader (TTT) which is designed to make money in a down market. TTT uses a combination of conservative and aggressive strategies to position subscribers to profit in a declining market. These TTT trades are simple to action, the same as any trade recommended in Trend Letter. We are offering a subscription to TTT for only $399.95 (regular price is $649.95). Click Here to take advantage of this offer. It’s your money – take control.

Stay tuned!

October 15/18

We follow the trends and capital flows. Remember, this is a global market, it is all connected.

Stocks

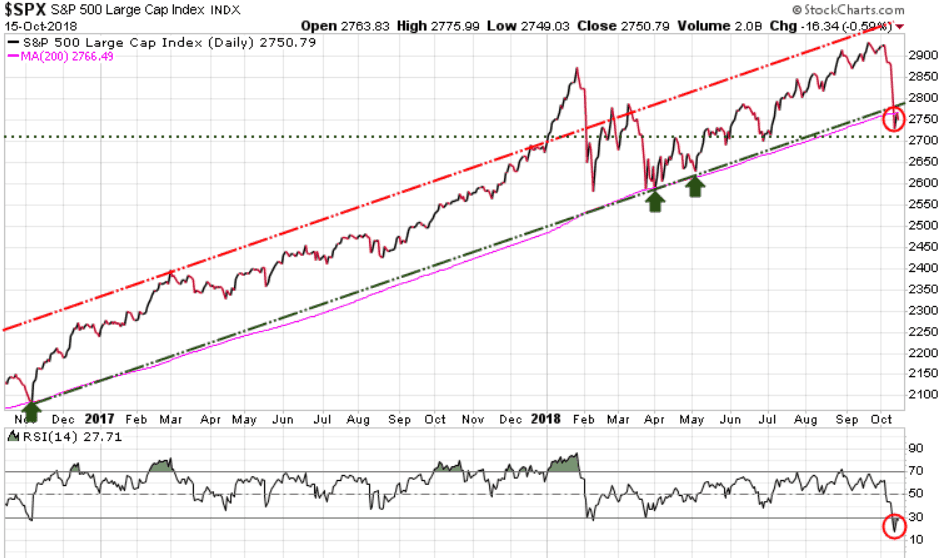
The S&P 500 had just surpassed Friday’s high with about an hour to go in today’s trading, then gave it all up and closed down 16.34 points or .59% on the day.

Looking at the lower chart we see that the Relative Strength Index (RSI) at 27.71 is still below 30, indicating that the S&P 500 is still oversold here. Continue to watch the 200-day MA (link line), as it has in the past acted as a very solid support level for the S&P 500. If the S&P cannot climb back and close solidly above this support, it means we are not out of the woods and that more moves to the downside are certainly possible.

Long-term trend remains bullish

Immediate trend is bearish

Our current position is NEUTRAL

spx1015

Gold

Gold had another up day, closing today up 8.30 or .68%. Gold has broken out of its near-term downtrend channel and now needs to close above 1246, then push through and close above 1260, 1307, and 1377 to have a chance of having a solid bull run.

Long-term trend is bearish

Immediate trend is bullish

Our current position is a BUY

Gold1015


Stay tuned!

A hedging strategy

Below is the weekend update from our hedging service Trend Technical Trader (TTT). TTT offers subscribers strategies to not just protect their wealth in declining markets, but to actually profit during market corrections/crashes.


Posted by Trend Technical Trader

The DJIA plunged last week, which should have come as no surprise to our readers.

Thursday a 386-point bounce began within just a few points of our predicted “around the 25200 level”, then markets dropped further to close near the lows of the day.  Friday’s trading was choppy but eventually markets rallied into the close.

A 287-point gain Friday in the DJIA is not impressive or an indication of strength after the 2052-point drop the senior index suffered the past week-and-a-half from peak to trough, however the rally is likely to continue another day or two.

Reiterating what we wrote on Wednesday:  While it’s true that market drops often end in October, we must ask which October?  Don’t presume it’ll be 2018.  All fundamental, historic, technical and sentiment indicators suggest a protracted bear market started in February as we’d stated emphatically at the time.

Rallies since then have only served to lure buyers into an epic top.

Recall that at the end of June we showed you our proprietary momentum indicator that has triggered shortly before each of every single major market drop of the past 30 years, warning that months of gains would be lost in days.  That’s what happened the past week-and-a-half and with that the DJIA is exactly back to where it was at the end of June, on its way much lower.

It’s not different this time.

Wednesday we correctly warned that “stocks are only slightly oversold on a short term basis, while in the intermediate and long term markets remain extremely overvalued with sentiment indicators highly elevated.  This week was just a very small “blip” in the longer term.”

This remains true, and in fact some of our historical technical measures suggest that stocks are overbought even in the short term.

As we’ve written before, small-caps tend to lead general market speculation up and down thus recent lows in the RUSSELL 2000 signaled trouble.  Today small-caps barely closed higher on the day (up less than one tenth of 1%), finding support at the 2018 break-even level.  We expect these to continue to lead the charge lower.

Most troubling is that key financial stocks are at 52-week lows.  We’ve often used these as market proxies which is what allowed us to confidently state that a plunge was due despite some major indexes hitting new all-time highs in the past month.  If you think general markets will charge far higher while global financials are in a massive and ongoing rut, you’re mistaken.

Thursday VXX hit a high of $38.69 so if you sold one of your VXX positions as suggested “near or above $37” then that’s coincidentally roughly a 37% gain in a week.

If you seek to reset that speculation we suggest doing so around $32 should it get there.  Those more conservative may wish to wait for a price back below $30.00

Wednesday we also predicted that margin calls may force covering of the record level of short positions in gold, and on Thursday precious metals did enjoy the largest 1-day rally in months.  Be aware however that as stocks sell-off globally in the weeks and months to come gold may be sold as well.  That’s what happened in 2008, proving that there’s no “flight to safety” among speculative classes when margin calls come due.  Cash will be king going forward.

Always adhere to prudent stops as posted.

We also enjoyed gains this week in our coffee position, via BJO, which rallied to a nearly 3-month high, now up 14% from our entry in August, complimenting our commodities gains booked earlier this year in cocoa and the Swiss franc.

Perhaps surprisingly Tesla Motors did not drop much this past week despite the general market plummet, catching bids just above its 200-week moving average though we still enjoy healthy gains in that short position.

There will likely be wild swings in Tesla, as is normal in any highly polarizing story stock with a cult-like following, but in time we’re confident it’ll be far below $100 as it should continue to grossly underperform vs. stocks in general.  Further, we expect that per the increased scrutiny of ongoing Department of Justice and S.E.C. investigations more and more of the company’s projections and accounting, along with the CEO’s very liberal concept of the truth, will be revealed as fraudulent.

Our Monthly Indicator is still bearish.

Update on Short positions:

At the extremes this week our five short positions were:

+44%, +40% and +16% in one week since entering, +37% in 1 month since entering, and +19% in 5 weeks since entering.

Two of our gold positions were +31% and +30% in 1 month since entering.

New position:

Given our bearish outlook overall, an outright long position may come as a shock however there are always exceptions.

We are recommending a new BUY Stop on a lithium company that is profitable and enjoys a competitive moat, and could be a major story stock in the future as battery technology improves and proliferates. Note: This recommendation is for paid subscribers only

To become a paid subscriber and receive all of TTT’s recommendations and market commentary, all at a Special Discount price of $399.95  (regular price is $649.95) CLICK HERE

October 12/18

We follow the trends and capital flows. Remember, this is a global market, it is all connected.

Stocks

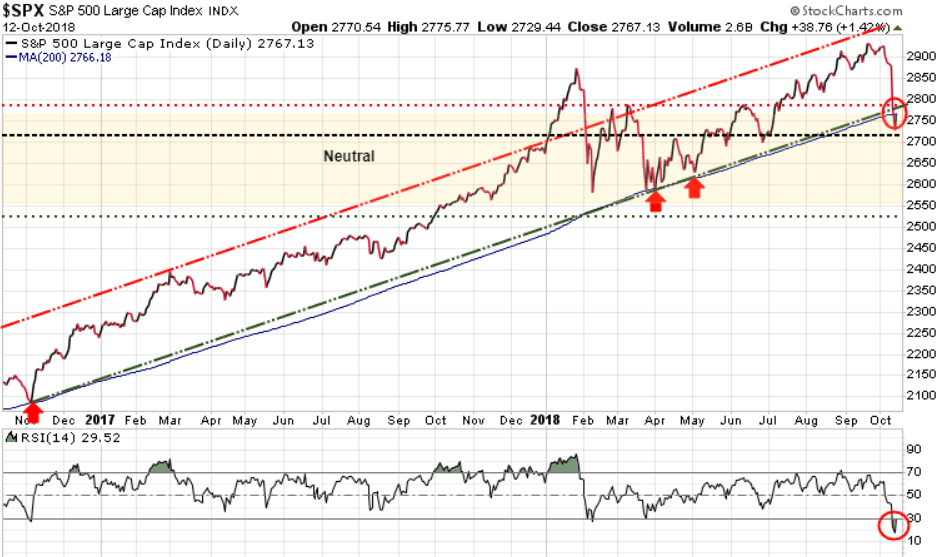
A wild ride today for all core indices. The S&P 500 hit an early high at 2775.77, only to give it all up and drop to 2730.23 by noon, and then recover and close at 2767.13, ending up 38.76 points or 1.42% for the day. While the bounce today was good, as we showed in yesterday’s update, the S&P 500 was technically very oversold, so today’s rally was no surprise to our readers. We said…

the Relative Strength Index (RSI) is now at 17.66 and whenever it is below 30 it is considered oversold, suggesting that the S&P 500 could soon rally back above its 200-day MA.

Looking at today’s chart we see that the S&P 500 did indeed rally and is within a whisper of testing that 200-day MA (blue line on chart). Even though the S&P 500 rallied today it is still down 4.39% for the week, suggesting that we are not out of the woods yet, and that more volatility should be expected next week.

SPX1012

This weekend’s issue of The Trend Letter will have full coverage of how this week’s action affected all markets, including the equity, bond, currency, precious metals, and commodity markets. If you are not a subscriber but would like to be, we are offering a special discount of $200 off the regular price of $599.95, so you only pay $399.95.  To take advantage of this offer, click here. 

Also, how was your sleep factor this week? If this week’s market volatility kept you up at night, it means that you are overexposed or most likely do not have a strategy to protect your wealth in such volatile times.

If you have a substantial portion of your portfolio in stocks, consider ‘hedging’ that long exposure. This week was a wake up call for those who are not prepared for a significant correction.

We do not know of a better hedging service than Trend Technical Trader (TTT) which is designed to make money in a down market. TTT uses a combination of conservative and aggressive strategies to position subscribers to profit in a declining market. These TTT trades are simple to action, the same as any trade recommended in Trend Letter. We are offering a subscription to TTT for only $399.95 (regular price is $649.95). Click Here to take advantage of this offer. It’s your money – take control.

Stay tuned!

October 11/18

We follow the trends and capital flows. Remember, this is a global market, it is all connected.

Stocks

In yesterday’s update we showed how the S&P 500 dropped a whopping 94.66 points or 3.29% and in doing so blasted through its 2825 support level.  We also noted the NASDAQ fell a massive 4.1%, the largest decline of the year. We further highlighted how the 200-day MA for the S&P 500 was a key support level and that we needed to watch to see if it would  hold.

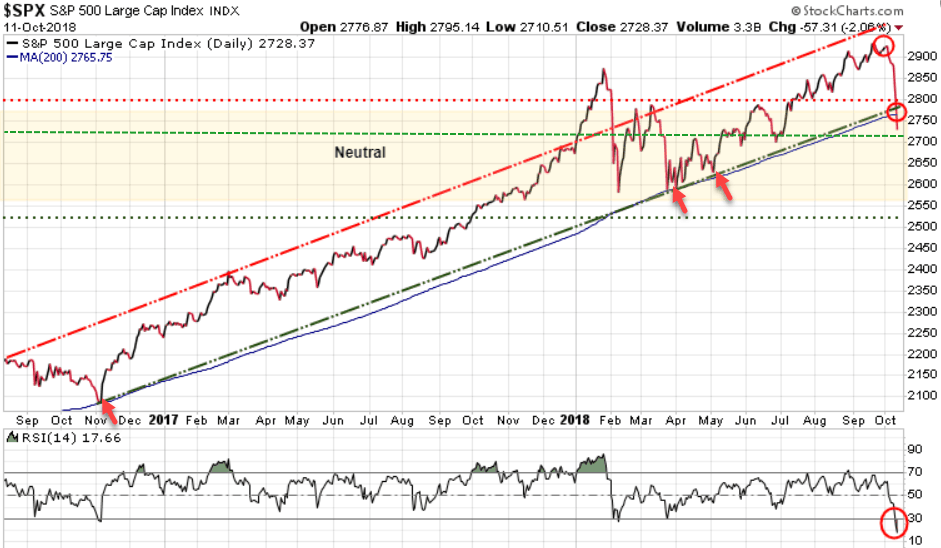
Well today the S&P 500 lost another 57 points or 2.06%. Interesting that the NASDAQ, the big loser yesterday, lost “just” 1.3%. What we want to keep an eye on is that 200-day MA (blue line).  As we can see on the 2-year chart, the S&P 500 had tested this level three times (red arrows) but today is the first time that the S&P 500 has closed below its 200-day MA. Typically during bull markets, stocks trade above the 200-day MA, while in bear markets they trade below it.

We now need to see if this is the start of a deep correction, even a crash, or if it is simply an overshoot of support. If we look at the bottom portion of the chart we can see that the Relative Strength Index (RSI) is now at 17.66 and whenever it is below 30 it is considered oversold, suggesting that the S&P 500 could soon rally back above its 200-day MA.

There is no end to the opinions as to why the markets are being hit so hard here. Be it the recent jump in interest rates, trade concerns, computer algorithmic trading, issues in Italy, and let’s not forget politics, as the US election is fast approaching.  Whatever the opinions, we just watch the numbers.

Key levels we need to watch here for the S&P 500:

  • Near-term Support at 2717
  • Next Support level at 2700
  • Near-term Resistance at 2775

The S&P 500 needs to close tomorrow above 2717 to signal we could be near the bottom of this correction. If 2717, then 2700 are breached, then a deeper correction is in the cards.

Bonds

Yesterday we noted that “Typically, when we see a big sell-off in the stock markets, capital flows into bonds, driving up bond prices and pushing yields lower. That did not happen today!

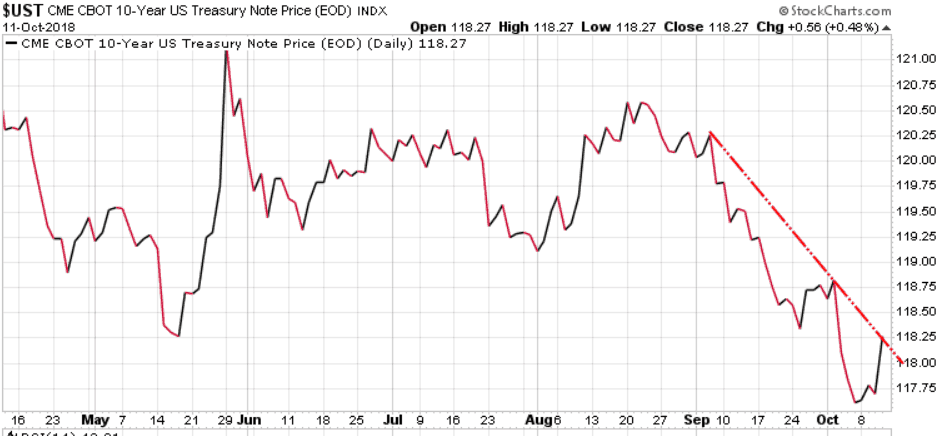
Today, we did see capital move into bonds, which pushed yields lower. The US 10-year is now pushing up against its near-term downtrend line. IF equities continue lower, we would expect to see bonds continue to push higher, meaning yields lower.

bonds1011

Gold

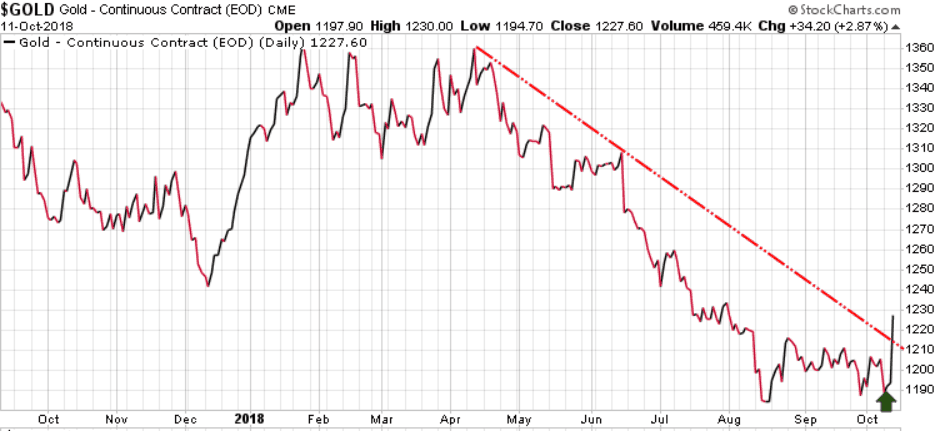
Yesterday we also highlighted how gold is typically a go-to ‘safe haven’ play when we see deep market declines, but that was not the case yesterday. Well today gold finally got some love and jumped 34.20 or 2.87% for the day.

gold1011

Cryptos

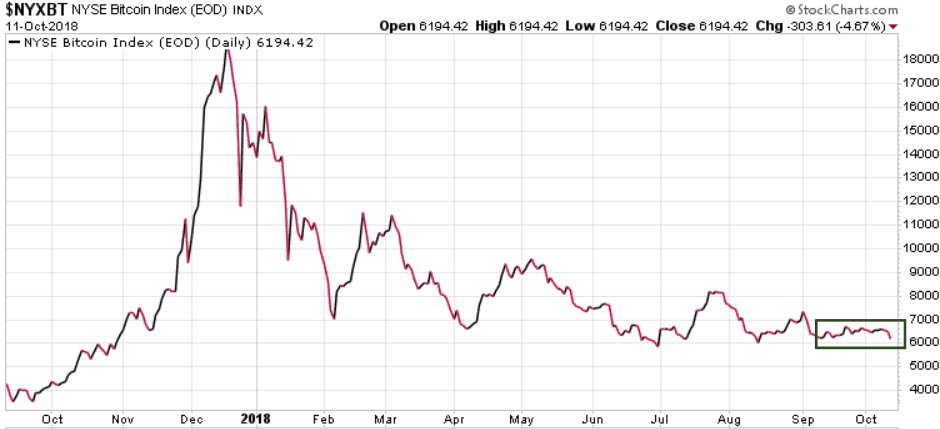
While gold was a big ‘safe haven’ play, there was virtually no reaction from the crypto currencies as Bitcoin actually moved lower today.

There are tons of opinions out there, but we will continue to let the markets tell us which of these sectors will rise, and which will fall.

Quick Note: We have had a lot of inquiries asking how can investors protect themselves from significant market corrections or crashes. While The Trend Letter uses basic insurance for a correction, note that our hedging service Trend Technical Trader (TTT) is designed to make money in a down market. Its 4 recent hedge positions are up 37% (opened Oct 4/18), 33.5% (opened Oct 4/18), 33% (opened Sept 12/18), and 16.4% (opened Sept 5/18). These TTT trades are simple to action, just the same as any trade recommended in  Trend Letter. We are offering a subscription to TTT for only $399.95 (regular price is $649.95). Click Here to get that price. It’s your money – take control.

Stay tuned!

October 10/18

We follow the trends and capital flows. Remember, this is a global market, it is all connected.

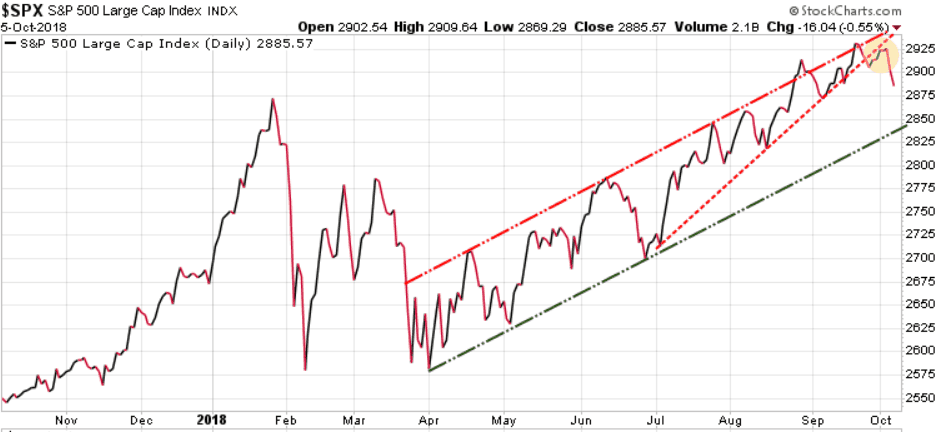
In our Sunday issue of The Trend Letter we posted the following chart highlighting how the S&P 500 had broken below immediate support (yellow highlighted area) and warned that a break below 2825 (green line) would open the door for a deeper correction.

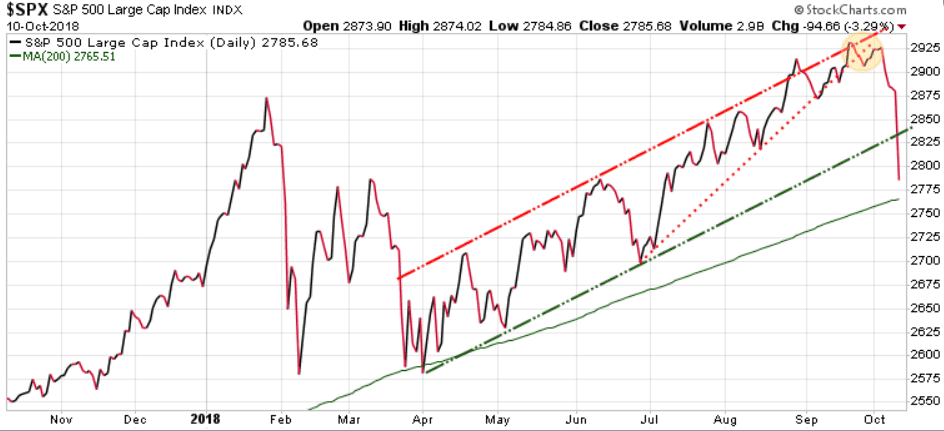
Well, today the S&P 500 dropped a whopping 94.66 points or 3.29% and in doing so blasted through that 2825 support level.  Note, the NASDAQ fell a massive 4.1%, the largest decline of the year. The 200-day MA for the S&P 500 (lower green line) is a key support level, so we will watch to see if it holds. It is currently at 2765.51.

SPX1010

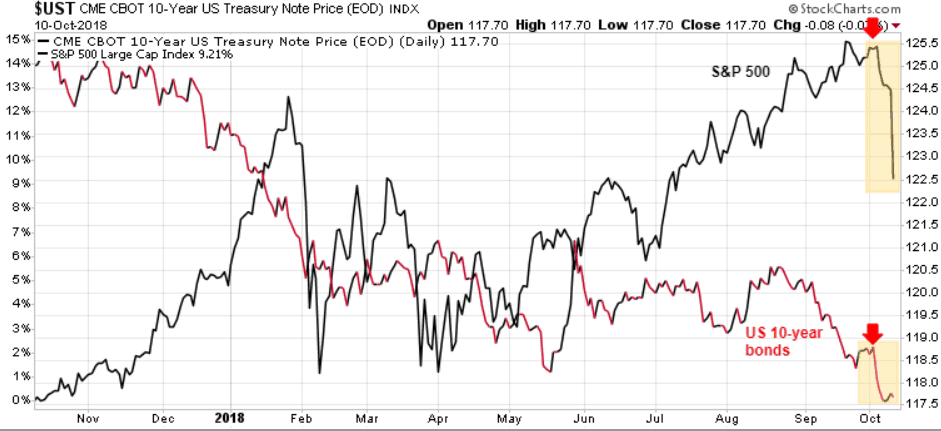
A key reason for this sell-off is the rising interest rates. After a decade of global central banks artificially keeping interest rates low (even negative), rates are starting to rise. Typically, when we see a big sell-off in the stock markets, capital flows into bonds, driving up bond prices and pushing yields lower. That did not happen today!

As we can see, for the last couple of weeks, both the S&P 500 and the US 10-year bonds have been falling.

BondsVsSPX

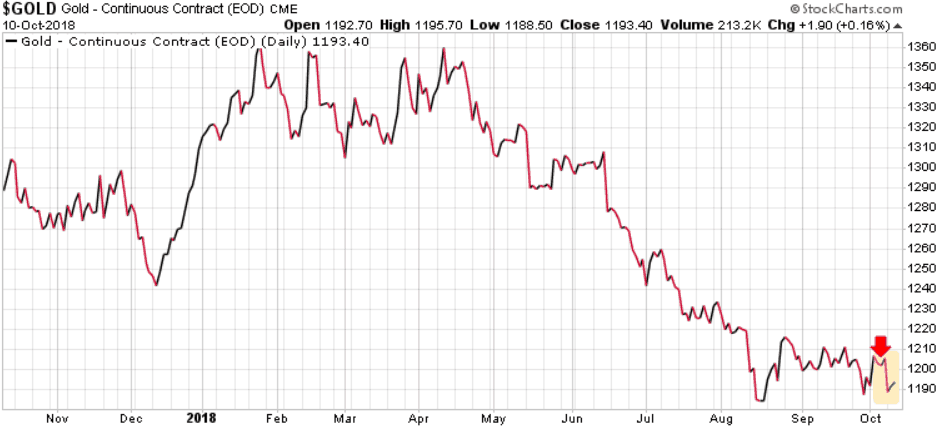
What about gold, that other ‘safe haven’ play? Similar story, gold has been absolutely hated by investors, and cannot seem to get any momentum, even with a massive equity market sell-off. Should we see this correction in the equities accelerate, watch for gold to rally.

Gold1010

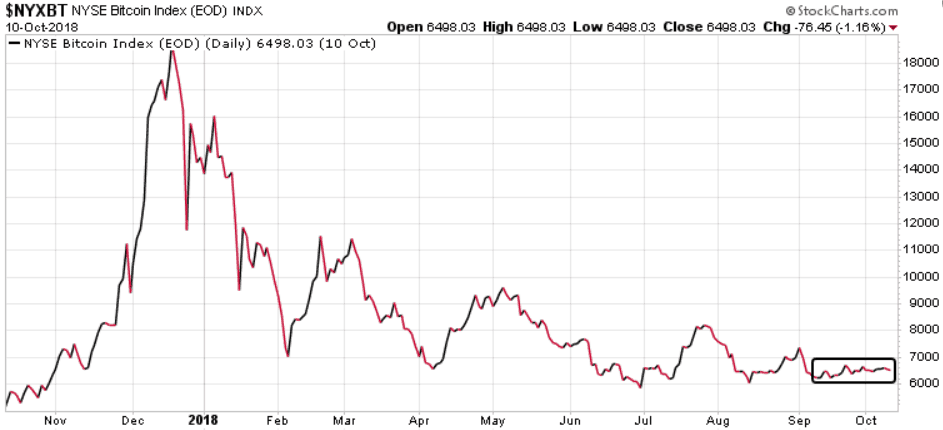
Not even crypto currencies could catch a bid with the equity market sell-off. Bitcoin was flat today and even showed some selling in the last hour.

Bitcoin1010

There are tons of opinions out there, but we will continue to let the markets tell us which of these sectors will rise, and which will fall.

Trend Letter subscribers, be sure to check your inbox for a new position today.

Stay tuned!