Investing in stocks is a way to set aside money while you are busy with life and have that money work for you so that you can fully reap the rewards of your labor in the future. Legendary investor Warren Buffett defines investing as “the process of laying out money now in the expectation of receiving more money in the future.” The goal of investing is to put your money to work in one or more types of investment vehicles in the hopes of growing your money over time.

The key is that you don’t need to be an expert to invest like one. What you need is a good source that explains what is happening in the markets and then makes recommendations, telling you WHY you should invest in that stock or sector.

Since 2002 the Trend Letter has delivered average returns of over 40% per closed trade. We help people just like you understand what is happening in the markets and what sectors, and stocks make the most sense to invest in.

What Are the Risks of Investing?

Investing is a commitment of resources now toward a future financial goal. There are many levels of risk, with certain asset classes and investment products inherently much riskier than others. However, essentially all investing comes with at least some degree of risk: it is always possible that the value of your investment will not increase over time. For this reason, a key consideration for investors is how to manage their risk to achieve their financial goals, whether they are short- or long-term.

Key rule: Have an Exit Strategy

The first rule in being a successful investor is to not lose money. That might sound obvious, but the truth is most investors have no exit strategy for when they are wrong.  Basic human emotion is perhaps the greatest enemy of successful investing. But whether you’re a long-term investor or a day trader, a disciplined approach to trading is key to profits. You must have a trading plan with every trade. You must know exactly at what level you are a seller of your stock—on the upside and the down. Before we buy any stock or Exchange Traded Fund (ETF) we always set a SELL Stop in case the market moves against us.  When the stock starts rising, we raise our SELL Stop to ensure we lock in gains when we get a pull back.

The bottom line

Being a successful invest requires having the tools necessary that give you the best information to understand current and future market trends. At Trend News we offer three services for investors:

  1. Trend Letter is a weekly service that covers stocks, bonds, currencies, commodities, and precious metals. Trend letter has been publishing since 2002 and has an incredibly successful record over that 20+ year span.
  2. Trend Technical Trader (TTT) is an online service that was originally designed as a hedging service, allowing investors to protect their investment during down markets.  We have expanded TTT service to include trading long positions in precious metals, commodities, and other sectors as well.
  3. Trend Disruptors is our service for investors interested in investing in technical sectors. Disruptive technology propels us into the future at a rapid and increasing pace. Virtually no industry goes untouched, as the boundaries between the physical and virtual worlds are erased, transformed, or re-imagined. New technology can re-shape existing business around the world, and create entirely new business models never before thought of.

Whatever you  experience, we have a service that can help you become a very successful investor. It’s your money – take control.

Market Notes

Market Notes – June 10/22

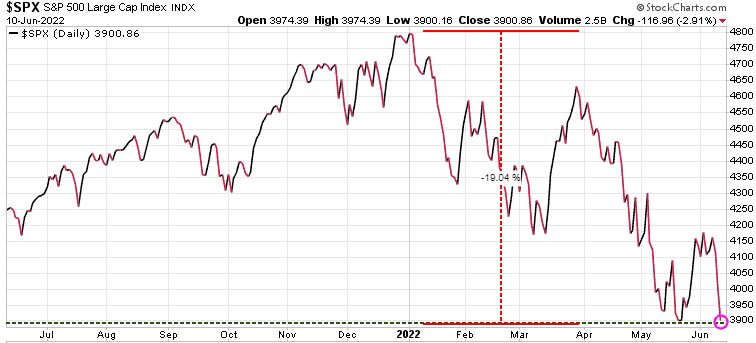
US stocks sank Friday as investors digested two downbeat prints on the US economy.

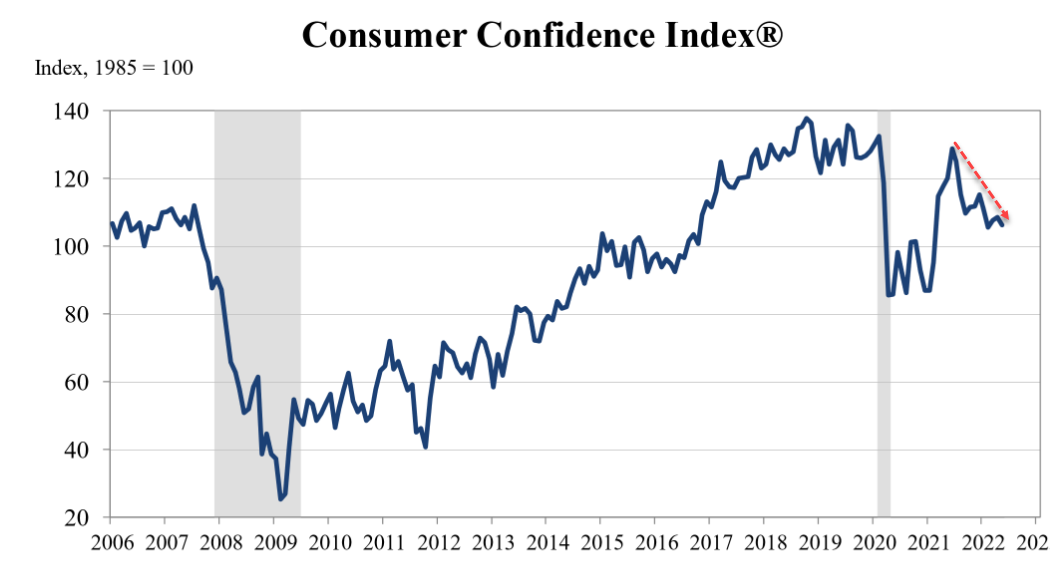
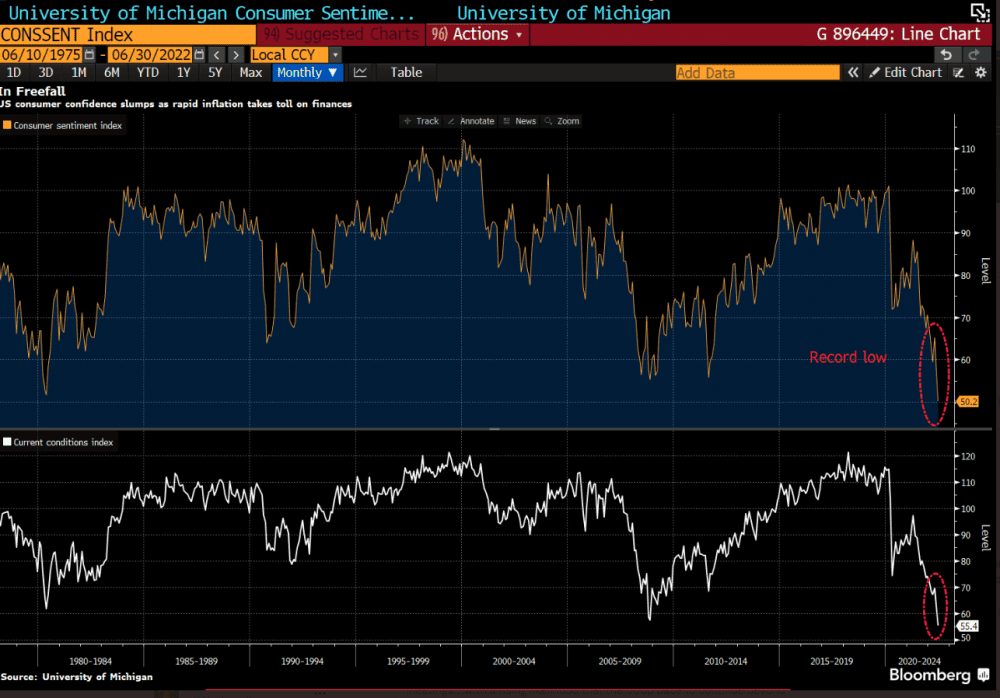
May data on inflation showed price increases unexpectedly accelerated last month, with consumer prices rising 8.6% year-over-year in May, the most since 1981. Consumer sentiment data released Friday morning came in at a record low, as inflation weighs on American households.

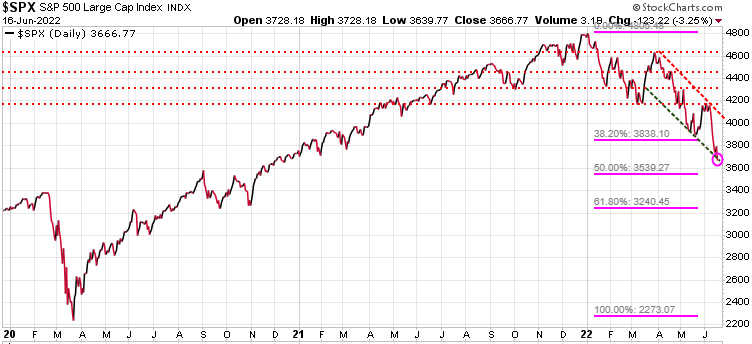
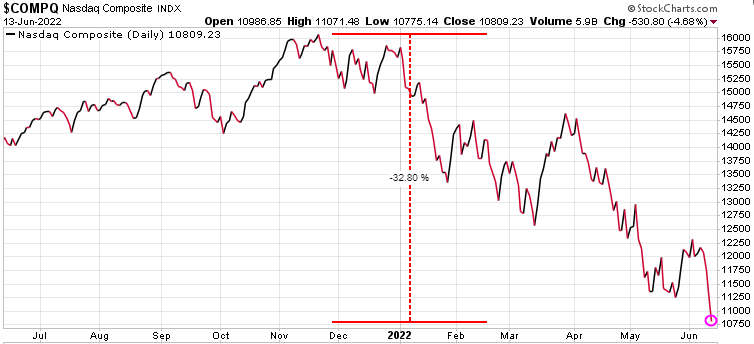
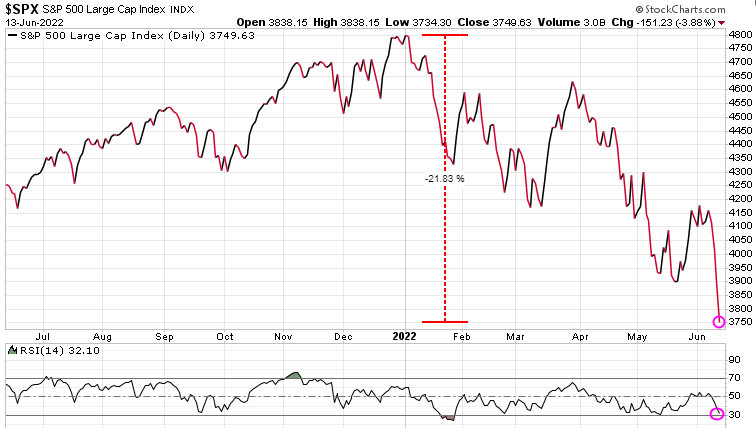
The S&P 500, Dow and Nasdaq dropped sharply following the print. The S&P 500 sank by 2.9% during the session, and by more than 5% since last Friday to post its worst weekly performance since January. The index ended just a hair above 3,900, or its lowest level in about three weeks. The Dow sank by 880 points, or 2.7%, and the Nasdaq Composite dropped 3.5% by the end of Friday’s session.

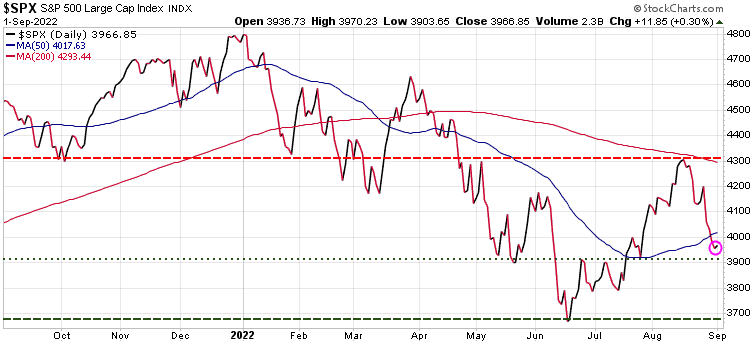
The S&P 500 is back to testng its previous low and if that level does not hold, we could see a significant decline.

Note that Trend Letter subscribers were given a new BUY recommendation on an insurance play this week. These insurance plays, or hedges are critical to protecting your wealth in a bear market. Our hedging service Trend Technical Trader (TTT) has a number of hedging options and subscribers can decide which one suits their specific trading strategy.  If you do not have a hedging strategy, seriously consider subscribing to TTT at a 50% discountClick here to subscribe to TTT

Consumer sentiment has dropped to a record low.

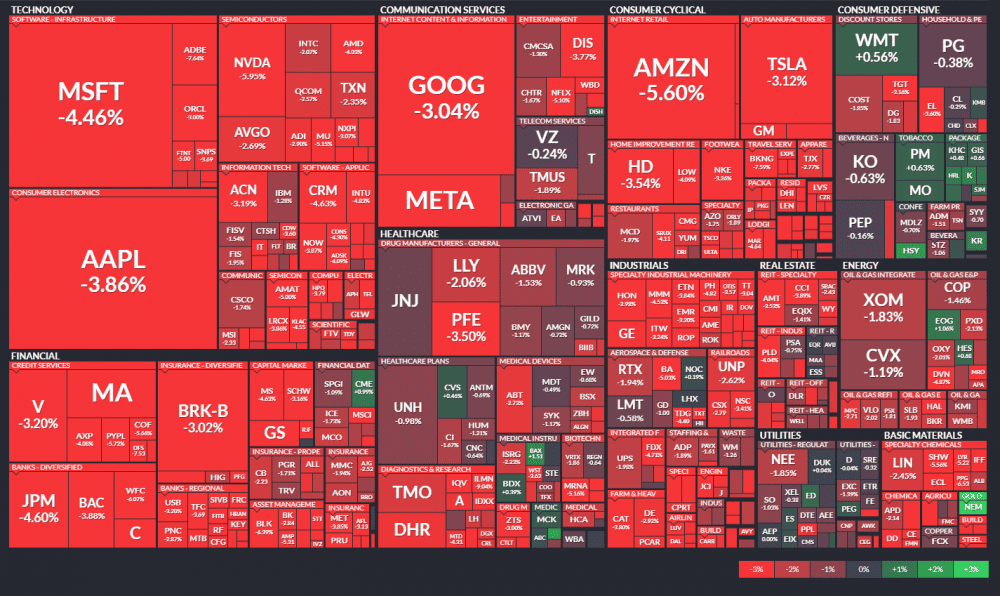
A sea of red.

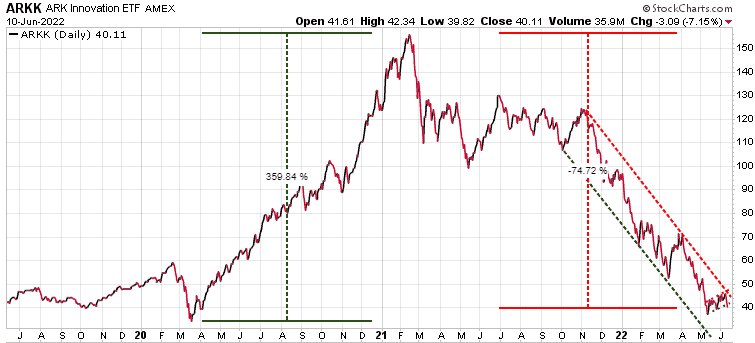
Cathy Wood’s ARKK ETF was the darling of the Tech sector after the Covid crash, having soared ~360%. In this bear market since the high in Feb’21, it has given up ~75%.

Stay tuned!

Market Notes

Market Notes – May 18/22

In yesterday’s issue of Today’s Charts we warned that in bear markets there is a lot of volatility, with violent moves both up and down. Today we saw what a violent move down in stocks looks like. We also warned that most relief rallies in a bear market fail. It is another reminder to ensure you have a hedging strategy, especially in times like these.

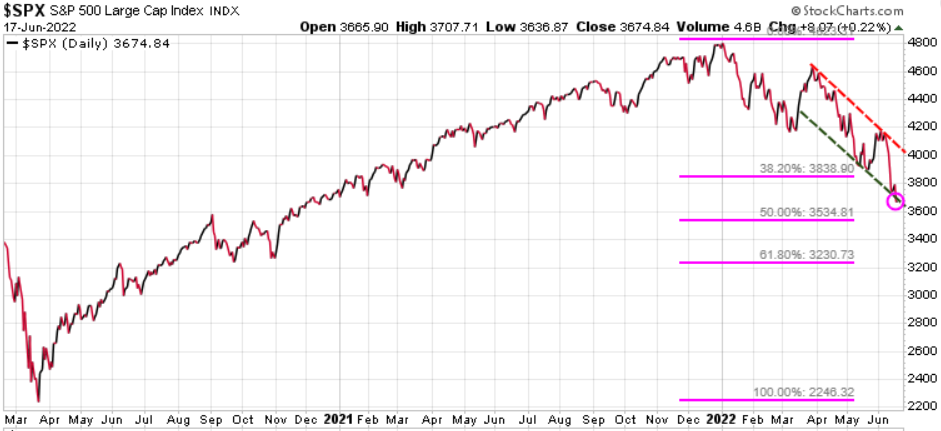
How far does this market fall? Below is a chart we showed Trend Letter subscribers recently. A 38% fibonacci retracement of the bull market run from 2009 would drop the S&P 500 to 3233, for a decline of over 32% from the January high. A 50% fibonacci retracement would take the S&P 500 down to 2750, a decline of over 42% from  the January high.

Tech stocks continue to be the big losers in this market sell-off, with the Nasdaq 100 dropping over 5.1% today and is now down 28% since its all-time high in Nov’21.

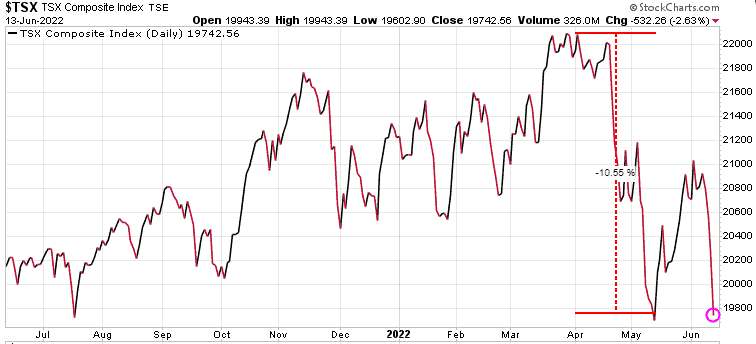
The Canadian TSX is also struggling but the energy is reducing the pain somewhat. TSX is down 9% from its all-time high.

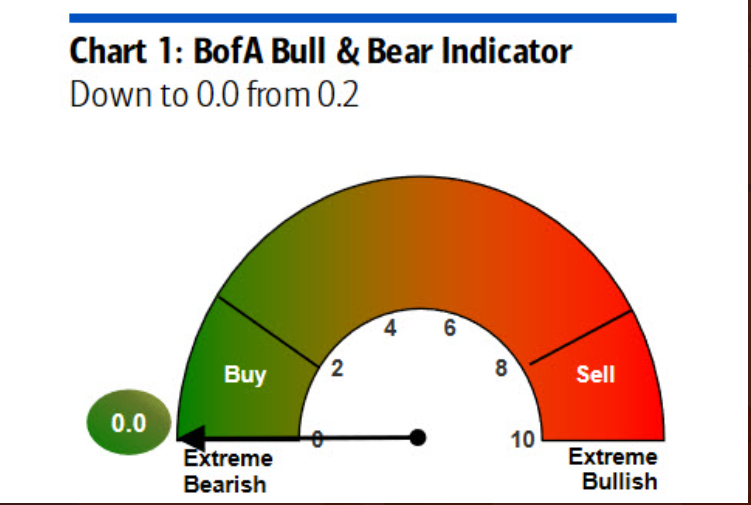
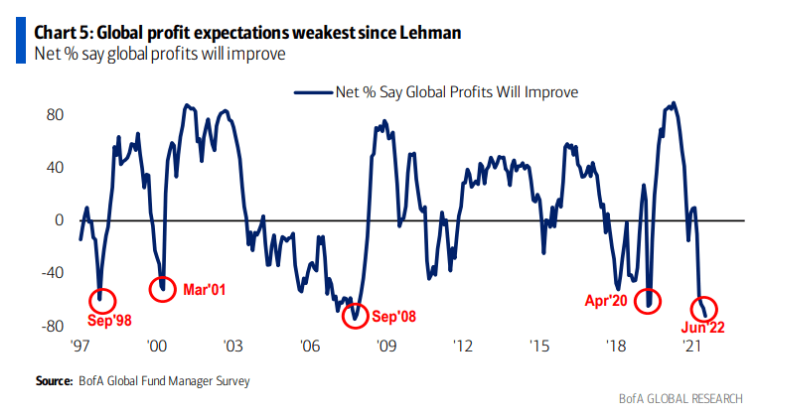
Based on the Bank of America’s Global Fund Manager Survey, fund managers haven’t been this gloomy about corporate profits since 2008.

Note that all three of our services have created target lists of excellent stocks that once we see the bottom of this bear market each service will be jumping in on those stocks. We are not there yet, but certainly getting closer to a bottom. We are offering the same great specials that we offered attendees of the World Outlook Financial Conference recently, where each service is 50% off and you can bundle two or all three services for even greater discounts.  If interested, click on the button below. It’s your money – take control!


Market Notes

Market Notes – May 17/22

As noted in Sunday’s issue of the Trend Letter, after the big sell-off, we are now seeing a relief rally. This could last for days, weeks or even a couple of months, but be very careful because if we do not see higher-highs and higher-lows, then we are most likely to see the market turn even lower. Bear markets tend to get very nasty with wild swings both up and down. While these relief or reflective rallies can be traded, in bear markets these rallies regularly fail.

Relief rallies

For the S&P 500, we need to see it push through its near-term resistance at 4300.

S&P500

One of the things that does suggest we get a rally here is that market sentiment has been very beamish, which tends to be a contrarian indicator.  Below is the CNN Fear & Greed Index and as we can see it is at an ‘Extreme Fear’ level.

Fear & Greed

The next chart is the put/call ratio (orange line) overlayed on the S&P 500. When this ratio is rising it tells us that investors are being more bearish, risk-averse. When the ratio is declining it means the investors are becoming more bullish, risk-on.  The vertical pink lines show how when we see peaks in the put/call ratio, it usually identifies short-term bottoms in the S&P 500, suggesting a relief rally has started.

Put/Call

Central bankers had been keeping interest rates low and have been major buyers of their domestic bonds.  Those loose monetary policies have fueled the bull run in the equity markets. But now the US Fed, Bank of Canada, and others are raising rates and are no longer buying their domestic bonds. In fact, the Fed will start to be SELLERS of these bonds.  The correlation of the bull market in stocks (green line) with the massive increase of the Fed’s balance sheet (red line) from buying all those bonds,  is very clear on this chart. Rising interest rates, a reduction in the balance sheet and a slowing economy, are serious headwinds for the equity markets.

Assets

Since the start of the year we have warned investors to have a hedging strategy for what we anticipated would be a very volatile year in 2022. The market action in these last 4 months is exactly the reason investors need a strategy to protect their wealth in volatile markets.  Our Trend Technical Trader (TTT) service was originally a hedging service and although it now recommends long positions as well, TTT is still a hedging service with many hedging strategies that are doing very well as the market crashes.

If you do not have a hedging strategy, seriously consider subscribing to TTT which offers numerous hedging options. Note also, TTT includes the Gold Technical Indicator (GTI).

To ensure all readers have access to this hedge service, we temporarily reduced the price by 50%. Click button below to subscribe. It’s your money – take control!


Market Notes

Market Notes – May 12/22

Stocks rebounded sharply in the final hour of trading, with the S&P 500 almost erasing a selloff that pushed it to the brink of a bear market earlier Thursday.

The turnaround came as Federal Reserve Bank of San Francisco President Mary Daly told Bloomberg News that a 75-basis-point increase in rates is “not a primary consideration,” while adding that the US is in a strong place and should be able to withstand monetary tightening. For a market that’s been haunted by fears that restrictive policy by major central banks will cause a recession, those comments offered a degree of comfort at the end of a session marked by wild volatility.


A small glimmer of hope as the S&P 500 was down 76 points at one point, but came back to close down just over 5 points.  The S&P is now down over 18% from the high to start the year. At the bottom of the chart  note that based on RSI the S&P 500 is getting close to being oversold, so at least a relief rally should be expected soon.  Loading up here would be like trying to catch a falling knife – be careful!

The tech heavy Nasdaq is now down almost 30% from its November and is also very close to being technically oversold.

Cryptocurrencies have been hit hard and Coinbase, the largest crypto exchange is getting hammered, down 55% in just the last 5 days, and down 85% since the November high.

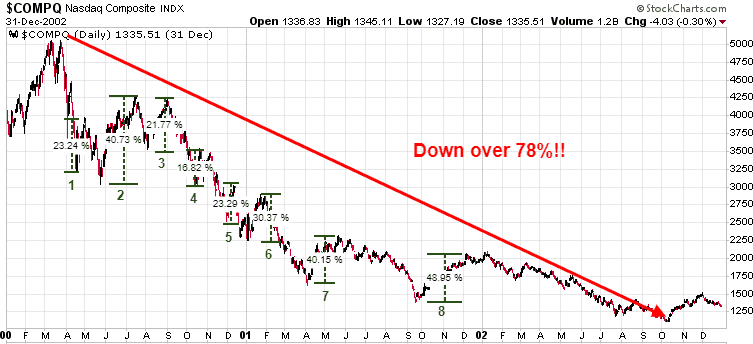
Tech now experiencing something similar to what was seen in 2000. Back then Tech collapsed as recession flushed out cyclical stocks masquerading as growth stocks. Profit disappointments in Tech during ’01 recession brought sector to collapse. Look familiar?

US 30-year mortgage has now jumped to 5.30%, almost double the Dec’20 rate of 2.67%.

Since the start of the year we have warned investors to have a hedging strategy for what we anticipated would be a very volatile year in 2022. The market action in these last 4 months is exactly the reason investors need a strategy to protect their wealth in volatile markets.  Our Trend Technical Trader (TTT) service was originally a hedging service and although it now recommends long positions as well, TTT is still a hedging service with many hedging strategies that are doing very well as the market crashes.

If you do not have a hedging strategy, seriously consider subscribing to TTT which offers numerous hedging options. Note also, TTT includes the Gold Technical Indicator (GTI).

To ensure all readers have access to this hedge service, we temporarily reduced the price by 50%. Click button below to subscribe. It’s your money – take control!


Market Notes

Market Notes – May 9/22

Global markets got hit hard today with investors refocusing on the Ukraine war, a global energy shock and the risk asthe Fed tries to fight the supply-driven inflation.  “I’ve been in the markets for 25 years and I’ve never seen anything like this,” said Danielle DiMartino Booth, CEO and chief strategist for Quill Intelligence, a Wall Street and Federal Reserve research firm. “It’s violent not just volatile.”

In the weekend edition of the Trend Letter we showed this updated chart, highlighting  what a correction vs a bear market would look like. A move down to the 3800 level would be a  decline of ~20% from the December high, signalling a correction. We would expect a relief rally from that level. If we then re-test that level, a bear market would likely take the S&P down to the 2730 level which would be a 50% retracement of the rally from 2009 to the recent high in December.

The tech heavy Nasdaq was down a whopping 4.29% on Monday. Now down ~28% so far this year!

The Canadian TSX was down 3.07%

Silver has really struggled recently, and dropped another 2.46% today.  Based on RSI (bottom of chart), silver is now oversold.

Since the start of the year we have warned investors to have a hedging strategy for what we anticipated would be a very volatile year in 2022. The market action in these last 4 months is exactly the reason investors need a strategy to protect their wealth in volatile markets.  Our Trend Technical Trader (TTT) service was originally a hedging service and although it now recommends long positions as well, TTT is still a hedging service with many hedging strategies that are doing very well as the market crashes.

If you do not have a hedging strategy, seriously consider subscribing to TTT which offers numerous hedging options. Note also, TTT includes the Gold Technical Indicator (GTI).

To ensure all readers have access to this hedge service, we temporarily reduced the price by 50%. Click button below to subscribe. It’s your money – take control!


Stay tuned!

Market Notes

Market Notes – April 28/22

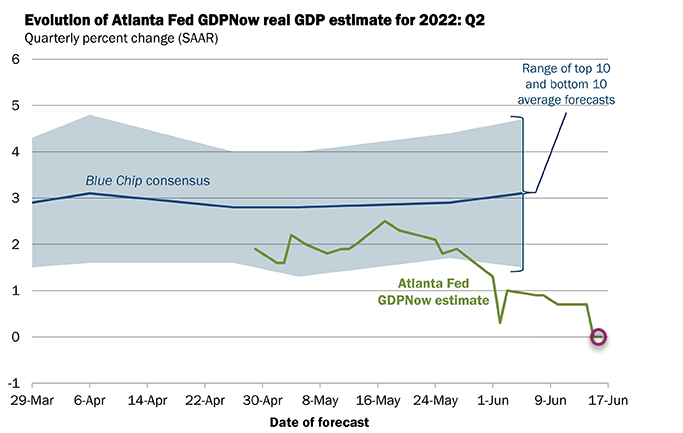
US stocks ended sharply higher Thursday, led by technology shares as markets continued a comeback from steep losses earlier this week. This gain was in spite of the news that the US economy   unexpectedly contracted at the start of 2022 for the first time in nearly two years as lingering supply chain imbalances, inflationary pressures, and war in Eastern Europe weighed on growth. First-quarter US gross domestic product (GDP) fell at a 1.4% annualized rate after a 6.9% pace of growth at the end of 2021.

The bad news is good news logic here is that the Fed will be less likely to aggressively raise rates if the economy is heading toward a recession.  The other spark for the markets was the anticipation for Apple’s earnings, which came in positive after the close.


As we highlighted in Tuesday’s Today’s Charts, investor sentiment had gotten very negative (bearish) and suggested that we would see a relief rally.  Right on schedule, starting Wednesday we saw the markets rally, and then today had a gonzo spike.

The key support for the S&P 500 was the 4173 level which held the previous two times it was tested (green arrows). It held again this week, which triggered this relief rally which should test near-term resistance at 4465 (light red dashed horizontal line). If it can push through that level, then the next resistance is 4630 (next red dashed horizontal line).

The S&P 500 has seen a series of lower highs and lower lows, so until it breaks out of that trend we need to be cautious here. The 4173 remains near-term support and if that level gets taken out, then we are in for a deeper correction, potentially much deeper.

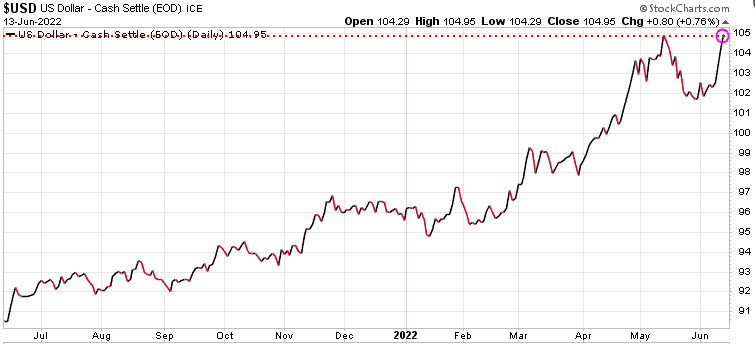
The US dollar has been on a parabolic tear this year. With Exchange Traded Funds (ETFs) it is very easy to trade currencies, just as easy as trading any stock. Unfortunately, most investors miss these opportunities.  Trend Letter uses these ETFs and currently has a leveraged short Euro trade that is up over 32% right now.

The Japanese 10-year bond yield has been negative until just recently, and even today only pays 0.21%. The US yield is 2.82% (Canada is 2.78%), so Japanese investors are pouring into US bonds, meaning they are converting Yen for $US. As a result, the Yen is getting hammered, down over 20% this year.  A weak Yen drives up import costs, especially energy and food.

After hitting .83 in early June thanks to energy and commodities, the Loonie has not been able to maintain that strength due to the massive strength in the US.

Stay tuned!


Market Notes

Market Notes – April 26/22

Another rough day for stock markets globally.  Most markets opened lower and after making a few feeble efforts to rally, they could not gain any traction.  Lots of headwinds for the markets: inflation,  central banks aggressively raising rates, Covid lockdowns in China, and the fear of escalation in the Russian-Ukraine war.  Most of these markets are getting close to being oversold, so we should soon get a relief rally very soon.
The Nasdaq-100 Index tumbled 3.95%. It has fallen 22.37% since the November high and 14.64% in the last month. The Nasdaq is now officially in a bear market.  Note that the March low did not hold support. Looking at the bottom of the chart, we can see based on RSI, the Nasdaq is close to being oversold.
The S&P 500 is now testing key support, where it held twice in March (green arrows).

The Canadian TSX has been the strongest market globally, up until  the recent decline thanks to the spike in energy and commodity prices. But in the last few days, even those sectors sold off. Note at the bottom of the chart, that the TSX is oversold now based on RSI.

Sentiment is very weak. The CNN Fear & Greed Index looks at 7 indicators that affect investors’ sentiment and as we can see, it is very close to an ‘Extreme Fear’ reading.  These indicators tend to be quite contrarian, suggesting that at minimum, we should see a relief rally very soon. But such a rally could be a sucker rally.

Stay tuned!

Market Notes

Market Notes – April 25/22

(AP News)…Elon Musk reached an agreement to buy Twitter for roughly $44 billion on Monday, promising a more lenient touch to policing content on the social media platform where he — the world’s richest person — promotes his interests, attacks critics and opines on a wide range of issues to more than 83 million followers.

The outspoken Tesla CEO has said he wanted to own and privatize Twitter because he thinks it’s not living up to its potential as a platform for free speech.

Musk said in a joint statement with Twitter that he wants to make the service “better than ever” with new features, such as getting rid of automated “spam″ accounts and making its algorithms open to the public to increase trust.

“Free speech is the bedrock of a functioning democracy, and Twitter is the digital town square where matters vital to the future of humanity are debated,” the 50-year-old Musk said, adding hearts, stars and rocket emojis in a tweet that highlighted the statement.

Musk’s offer is $54.20 for each share.

Wild swings for the equity markets today, with the S&P 500 tumbling at the opening where it bottomed at 4200, and then fought its way to a high of 4299, before closing near that high at 4296. In yesterdays’ issue of the Trend Letter, we told subscribers… ‘sentiment is very bearish, which to us can be quite contrarian, suggesting a possible relief rally, short-term is likely.’ 

Watch the 4470 level for near-term resistance, and 4600 for key resistance. Understand that with the Fed tightening its balance sheet, raising rates, and  the yield curve inverting, a recession is extremely likely.  The first step is for the S&P 500 to break out of its downtrend channel.

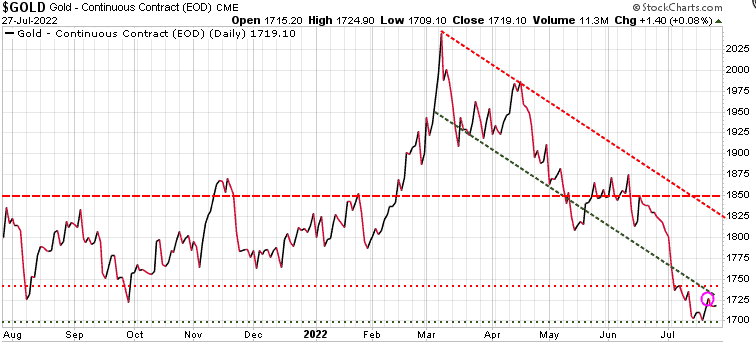
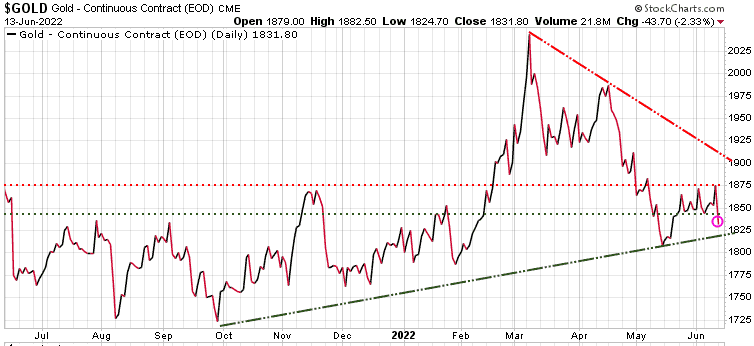
Gold had another disappointing day, closing down 38.38 on Monday. Gold has now lost 108.00 since the intra-day high last Monday.

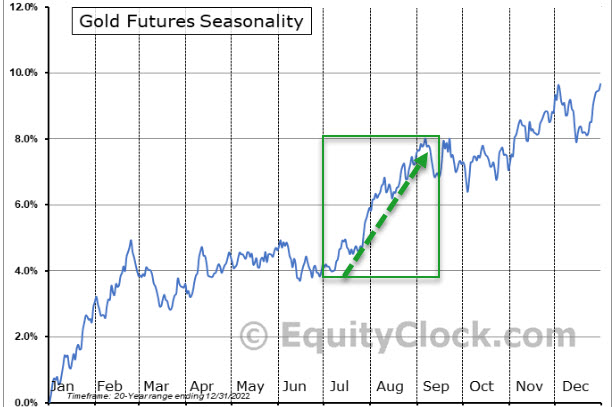
Based on seasonality, gold is in a strong period from late March through to early June. So far, that strong historic trend has not materialized this year.

Stay tuned!

Market Notes

Market Charts – April 13/22

Based on seasonality, most North American markets are in a strong period.  Here we see the  chart for the S&P 500, which is strong through to early May. The Toronto and Nasdaq charts look very similar.

Gold is also in a very strong seasonal period, from mid-March right through to early June.

The real returns for government bonds (bond yield – inflation) is negative in most countries, with only Mexico and Brazil being positive on the chart we publish each week in the Trend Letter. Canadian bond holders are losing 3.07% per year, US bond holders are losing 5.80% and Spanish bond holders are losing a whopping 8.10%.

Small businesses make up ~45% of GDP in both Canada and the US. Below are the results of the Nation Federation of Independent Business (NFIB) latest survey.  It shows that the general outlook for these business owners is ‘poor’. In particular, for ‘Expect the economy to improve’, the percentage dropped 14% to -49%, the lowest level recorded in the survey’s 48-year history.

The Index has declined every month this year. Thirty-one percent of owners reported that inflation was their single most important problem encountered in operating their business, an increase of 5 points from February. This is the highest reading since Q1 1981 and has replaced “labour quality” as the number one problem. The net percent of owners raising average selling prices increased 4 points to a net 72% seasonally adjusted, the highest reading in the 48-year-history of the survey. The highest reading in the mid-70s, the last time inflation was a serious problem, was 67% in Q4 1974.

Stay tuned!

Market Notes

Market Notes – April 12/22

The market opened strong,  but couldn’t hold the intraday gains. The S&P 500 continued to trade with lower highs and lower lows, and has now fallen through  both the 50-DMA (red wavy line) and the 200-DMA (blue wavy line).  The inflation numbers were the main problem for the markets, as US inflation came out at 8.5%, which will put more pressure on the Fed to raise rates.

With US rates rising faster than the other main economies (Europe and Japan) capital flows out of those regions and into the $US.

There is usually a strong correlation between energy stocks and crude oil, but recently we are seeing a price divergence. The recent weakness in crude oil may suggest a growing sentiment among investors that inflation may be topping and a recession is a more likely occurrence.  This correlation will return, we just now need to see if oil resumes its rally and joins the XLE, OR if XLE starts to decline along with oil.

Gold had been trading in a tight range and it has been disappointing that it hasn’t been able to rally with the war and inflation.  It has now broken through near-term resistance, which is encouraging.

Stay tuned!