Market Charts – February 11/22
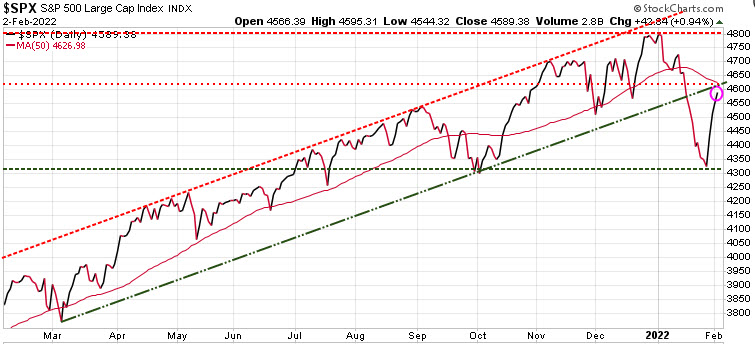
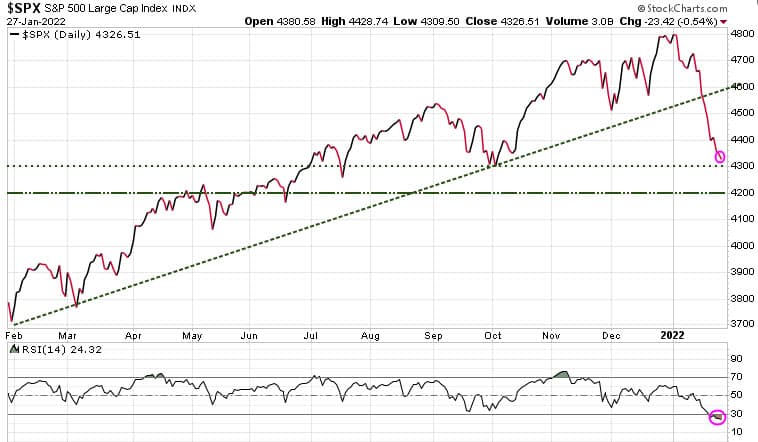
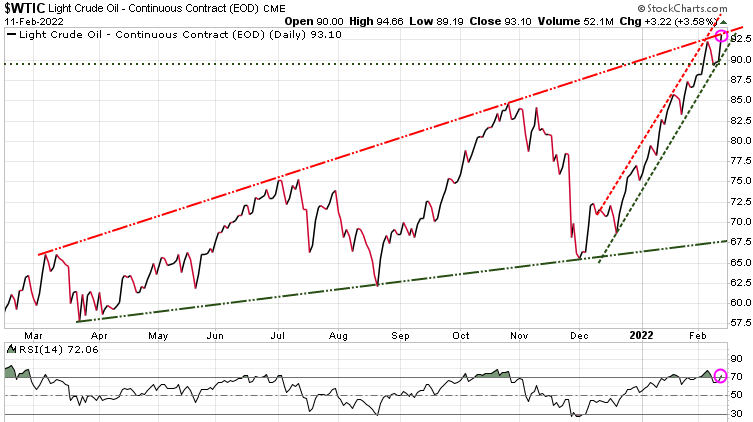
(From Yahoo News)…Stocks added to Thursday’s losses as jitters over a swift tightening of financial conditions increased on the heels of a multi-decade high print on inflation. Fresh geopolitical concerns between Russia and Ukraine further weighed on stocks and sent oil prices soaring to a fresh seven-year high.
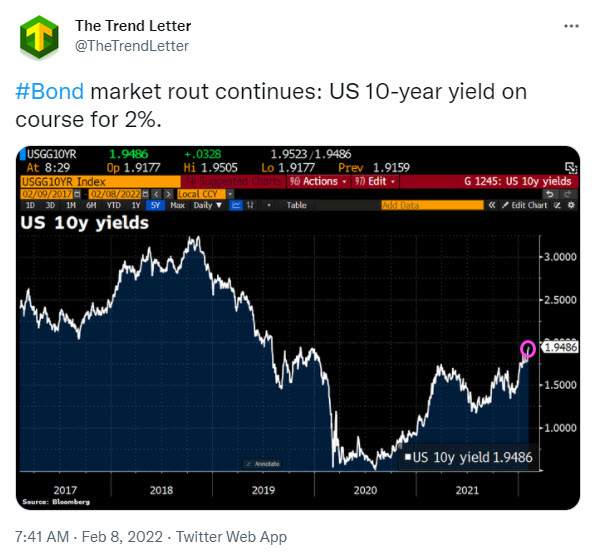
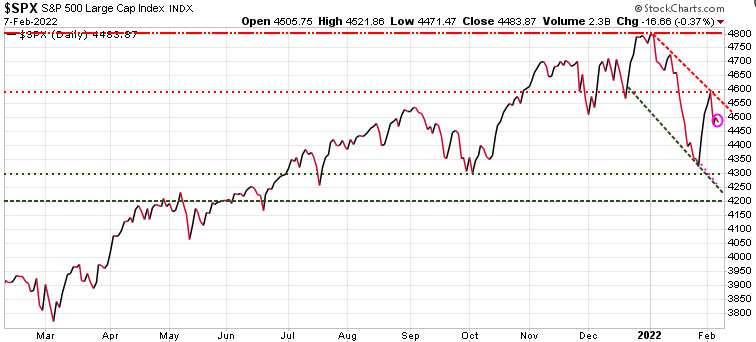
The S&P 500, Dow and Nasdaq fell during a choppy session Friday. Stocks sank to session lows Friday afternoon, after the UK issued a warning for British citizens to leave Ukraine as tensions with Russia mounted further. The benchmark 10-year Treasury yield turned lower after breaking above 2% for the first time since August 2019 a day earlier.
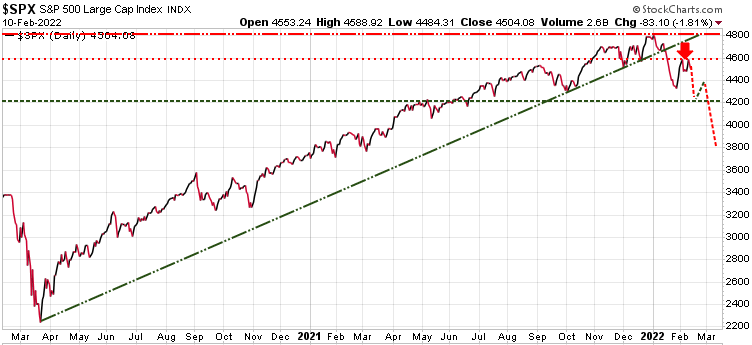
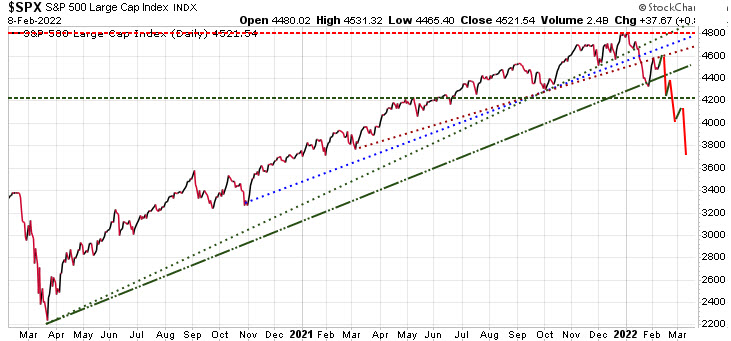
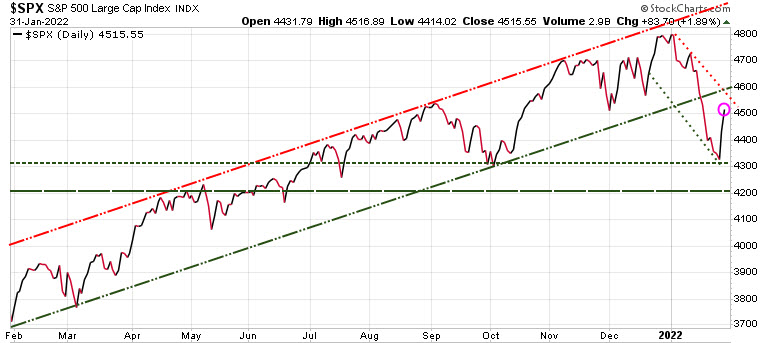
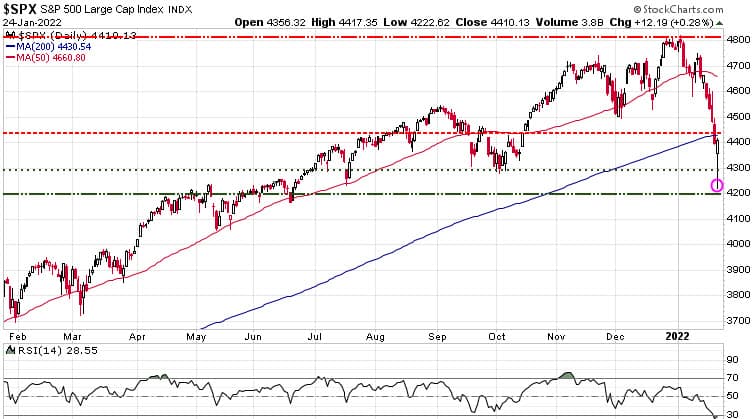
We continue to show the chart of the S&P 500 with our model’s projection of a potential test of the 4200 support level, then a bounce to 4400, and another test and potential breach of the 4200 level into mid March.

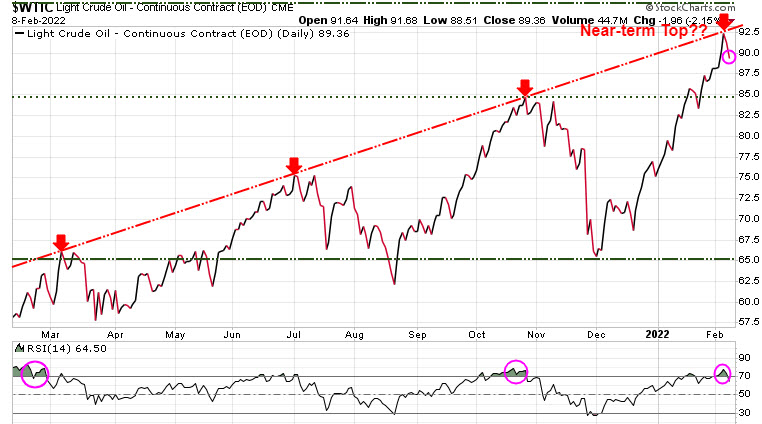
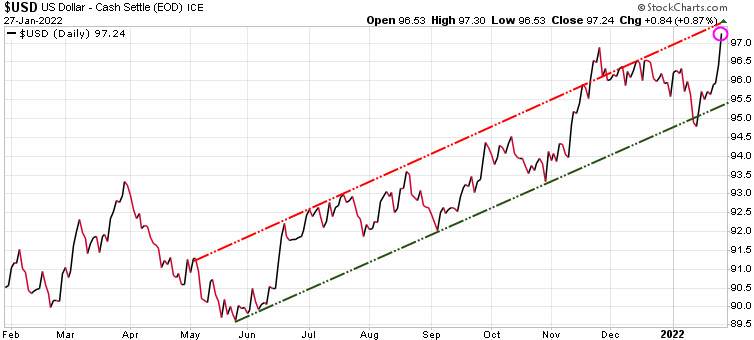
Oil rose for an eighth straight week as tensions between Ukraine and Russia heightened concern about tight global supplies. US National Security Advisor Jake Sullivan said Friday that the US believes Russia could take offensive military action or attempt to spark a conflict inside Ukraine as early as next week.
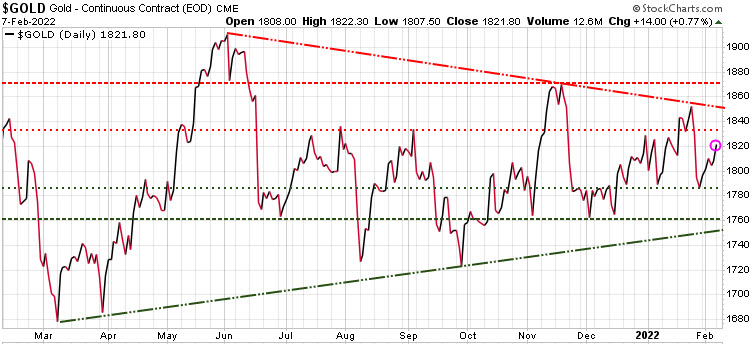
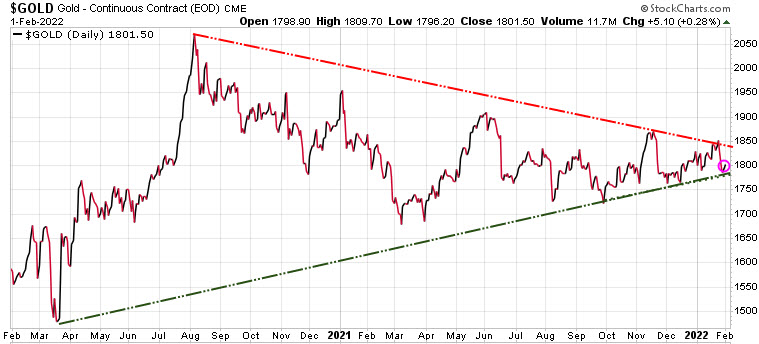
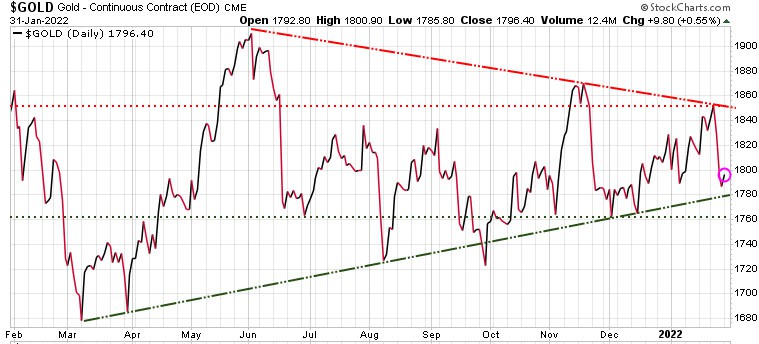
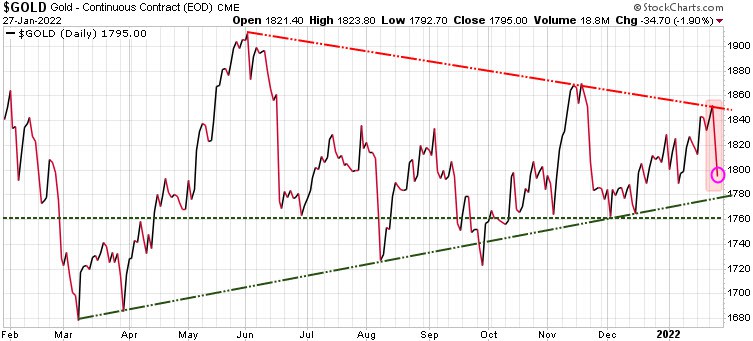
Gold is catching a bid as markets worry the Federal Reserve could opt for an emergency rate hike before the March meeting to try and tame inflation. Gold is up nearly 2% on the week as more investors turn to the precious metal amid a widespread risk-off sentiment in the marketplace. This week’s shockingly high US inflation report has added more uncertainty regarding the Fed’s tightening plan.

Note: If you are not hedged or do not have an exit strategy seriously consider subscribing to our premier hedging service, Trend Technical Trader. To ensure all readers have access to this hedge service, we temporarily reduced the price by $300. Click button below to subscribe. It’s your money – take control!
Stay tuned!