Posts by The Trend Letter

S&P 500 – November 20/18

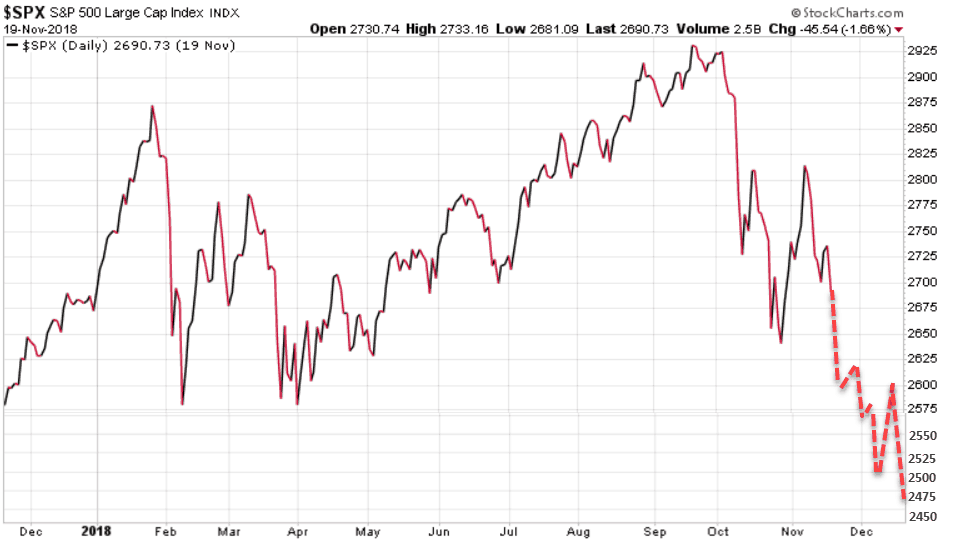
In our November 11/18 issue of the Trend Letter we showed a chart with our model’s bearish projection for the S&P 500 to have a cycle inversion targeting a drop to 2600 and even 2500 by year-end.  With last night’s close of 2690 being sub 2700, we now have the scenario where this 2600 target could be achieved much sooner than year-end, potentially in the next week.

Below is our model’s updated bearish chart. If we do test 2600 in the next week watch for a further decline to test 2500 in early December.  A gap down to 2500 should then trigger a rally back up to 2600, but then look for a double bottom to re-test 2500, and even our initial target low of 2470 by year-end.

We are now short-term bearish and we would need a rally and close this week above 2700 to open the door for a run to test the key resistance at 2830.

Long-term trend is  bullish

Immediate trend is bearish

Our current position is neutral

Stay tuned!

S&P 500 and Gold

S&P 500:

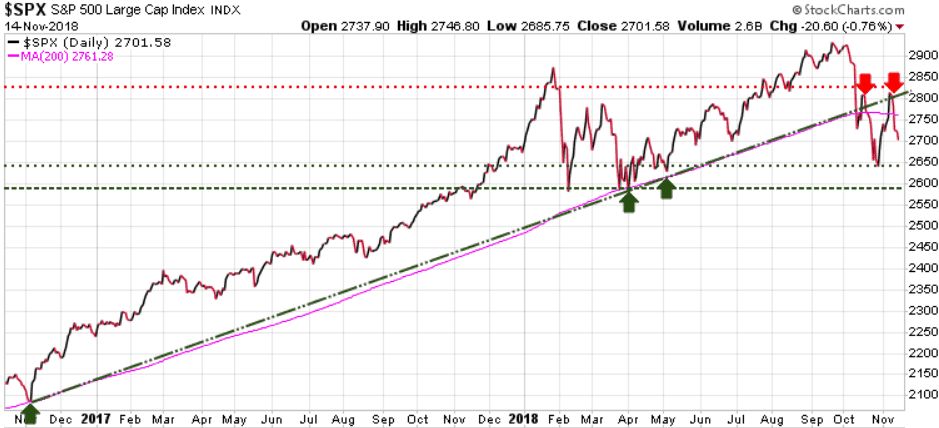
Another wild day in the equity markets with the S&P hitting a high of 2746.80, then hitting a low of 2685.75, before closing at 2701.58. As we warned in Sunday’s issue of the Trend Letter, instead of a year-end rally we could see a cycle inversion if the S&P cannot push through the 2830 resistance level. In Sunday’s Trend Letter we showed a chart of a bearish scenario with a test of 2600 in December, and a potential low of 2475 before year-end.

The S&P has fallen below both its uptrend line (green diagonal) and its 200-day MA (pink line),

spx1114

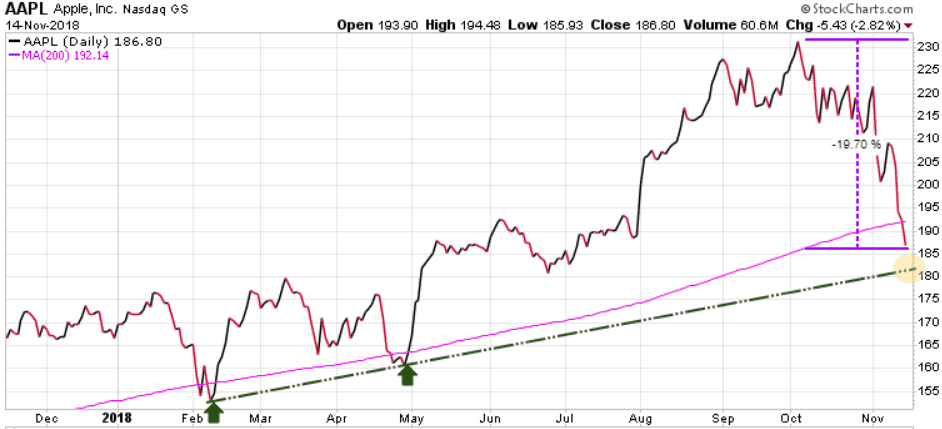
One of the negative drivers was that Apple has now dropped below its 200-day MA and is down almost 20% since its high in October. Tech stocks which have been the darlings of the bull market are being sold-off and are leading the way down. Apple has Key Support at 182, its uptrend line (yellow shaded area).

AAPL1114

S&P 500 trends:

Long-term trend is bullish

Immediate trend is bearish

Our current position is neutral

Gold:

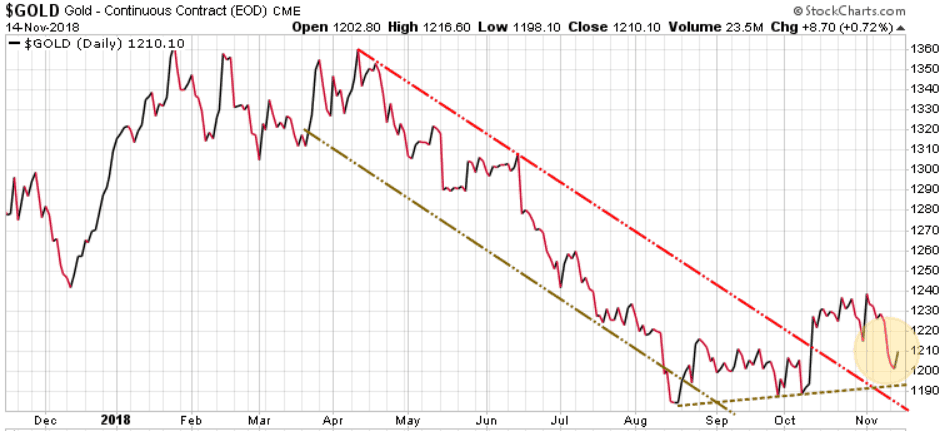
Gold was finally able to have an up-day closing up 8.70 after declining all through November.

Gold1114

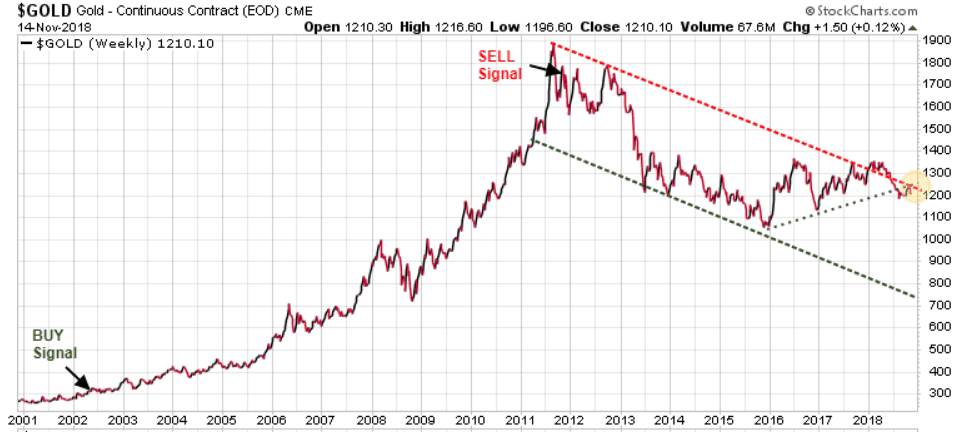
In our very first issue of the Trend Letter in 2002 we recommended buying gold when it was trading at 290. We rode that bull market all the way up to August 2011 when it hit our SELL Stop at just under 1800, a  500% gain. Since then gold has been in a 7+year downtrend channel.

Goldlong1114

So what happened? After the peak in 2011, after years of decline, investors got tired of waiting for gold to rebound, to the point where today gold is hated by the investment community. Over the past month based on the Commitment of Trader (COT) data, gold is oversold to an extreme. It means that future traders are massively pessimistic on gold and even more so on silver. As contrarians will love these scenarios because at the extremes futures traders often get it wrong.  When these speculative traders all bet in one direction, the opposite usually occurs. This opens a scenario where we could see a very good run for gold, silver, and other precious metals.

But understand, while we are looking for gold to have a good run up here, we do not see this as the ultimate low for gold. So if adding gold or gold stocks at these levels be sure to determine your SELL Stops to protect yourself in case this expected rally does not materialize, or does not last long. Gold must push through 1370 before we even consider a long-term rally.

Long-term trend is bearish

Immediate trend is neutral

Our current position is buy

Stay tuned!

November 8/18

S&P 500:

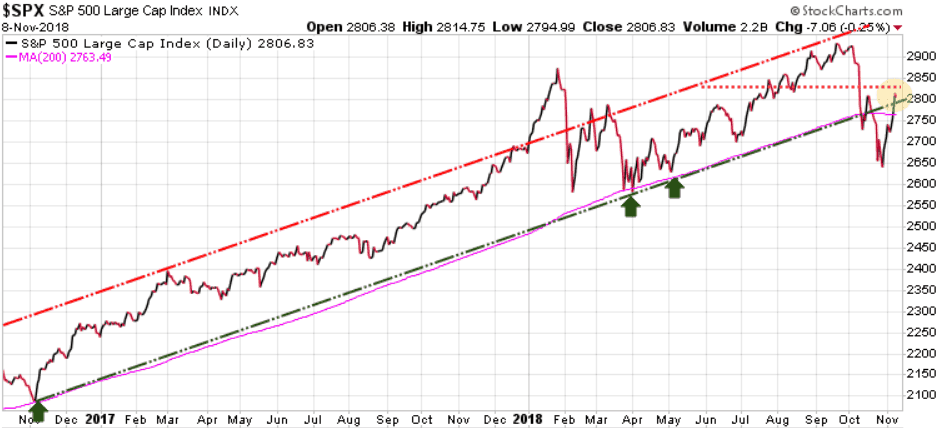
After a huge up day yesterday the S&P 500 consolidated today, closing down 7 points. The S&P is trading above its 200-day MA (pink line) and within its 2-year uptrend channel. The S&P needs to push above the 2830 level by Monday or it re-opens the door for a possible cycle inversion where instead of a rally through to year-end we see a re-test of the 2600 level with a potential challenge down to the 2475-2500 level we discussed in Monday’s blog

Long-term trend is bullish

Immediate trend is bullish

Our current position is neutral

Subscribers to the Trend Letter will get a full update on Sunday.

Stay tuned!

November 7/18

S&P 500:

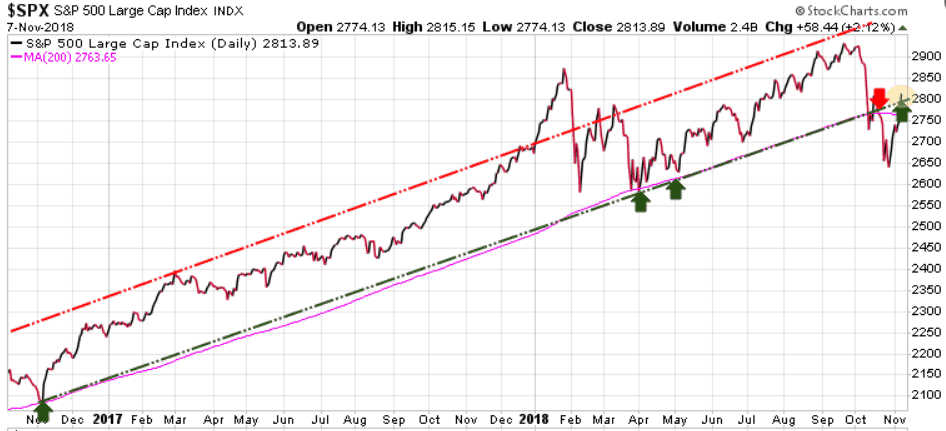
In Monday’s update we highlighted a potential scenario where depending on the election results we could see a quick drop to test the previous 2600 support level and if that level gave way, black box algorithmic SELL Stops would be triggered, causing a potential spike lower to 2500. We also noted that a quick run to 2800 would diminish the odds of a move to 2500. Fortunately for the bulls, we saw the latter scenario.

As we can see on the chart below, the S&P closed the day at 2813, an impressive 58.44 point or 2.12% move  higher, putting it back into its 2-year uptrend channel, and above its 200-day MA…bullish action.

spx1107

Long-term trend is bullish

Immediate trend is bullish

Our current position is neutral

Note that the S&P must close above 2830 this week to maintain its immediate bullish trend.

Stay tuned!

Really, the S&P 500 below 2500 this week?

Stocks:

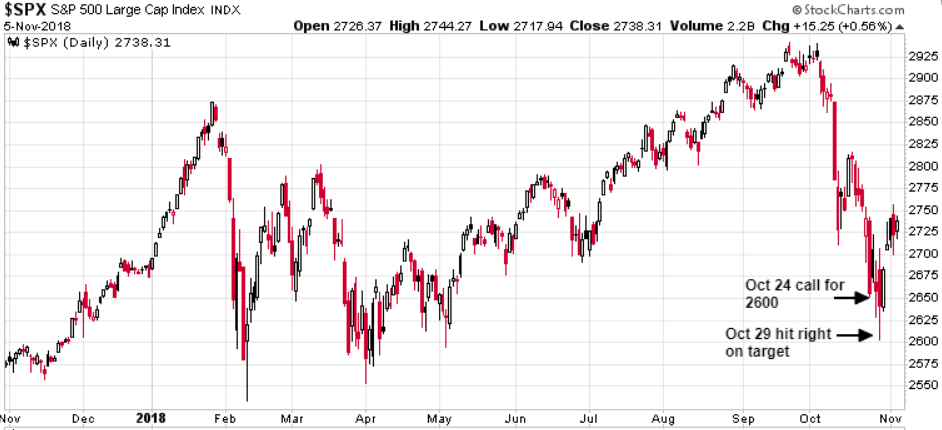
In our October 24th Market Update we stated:

S&P has been trading above its 9+ year uptrend channel, although it has now fallen below the upper level of that channel.  All this action is bearish, suggesting that the S&P will very possibility test the 2600 level.  Given that markets decline much faster than they rise, we could see this support level hit this week

Five days later the S&P hit an intra-day low at 2603, just 3 points from our target.

spx1105

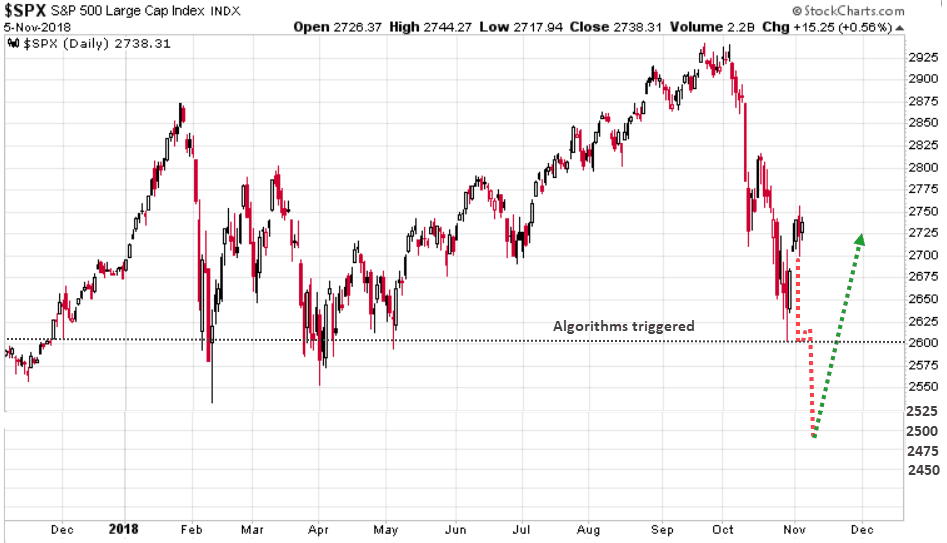
Tomorrow is the US mid-term election and over the next few days we could see some wild action in the markets. Below is one of the scenarios our models are projecting, so be prepared. If the market gets nervous and re-tests the 2600 level, a breach of this level could trigger black box algorithms initiating a series of SELL Stops that could quickly push the S&P down below key support levels at 2535 and 2500.  This scenario would then validate our model’s Feb’18 call for an ultimate low of 2470. If this scenario plays out, the market would be then be extremely oversold opening the door for a significant rally right back through 2600, potentially closing the week close to 2725.

An immediate push through 2800 would diminish the odds of a bearish decline to 2500 target and would signify a likely early resumption of the uptrend.

spx1105altrig

Let’s watch and see how the mid-term elections play out.

————————————————————————————

In the recent market correction Trend Technical Trader (TTT) recommended 4 plays to profit during a market decline. At their peak these plays gained 24%, 46%, 49% & 54% in  less than 2 months. If you would like to subscribe to TTT and have a plan to not just protect yourself during the next market correction or crash, but to actually profit from it, CLICK HERE and receive $250 off the regular price and pay only $399.95

————————————————————————————

Stay tuned!

November 1/18

Stocks:

The S&P 500 rallied over 1% for the 3rd straight day for the first time in six weeks after Trump tweeted that he and Xi of China had a good conversation on trade.

TrumpChina

However, in after market trading Apple shares were down up to 7% after it warned that it could miss its December revenue target due to weakness in the emerging markets.

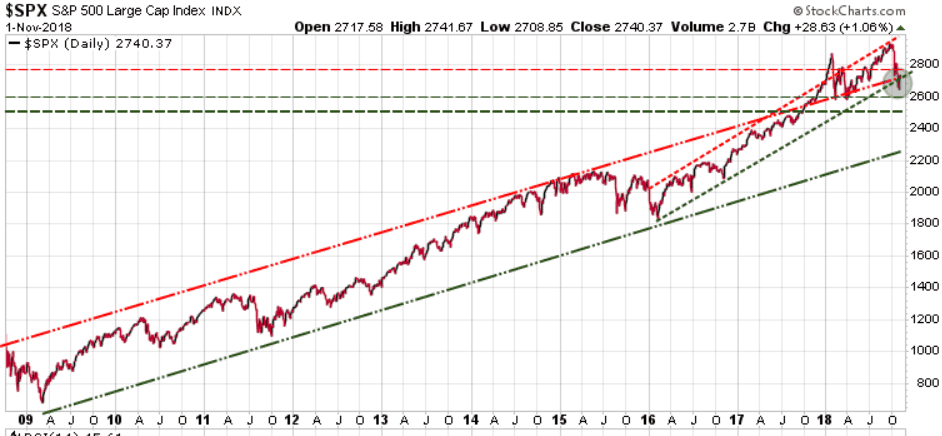
The S&P is now back above its 9+ year uptrend channel (green shaded area). What we are looking for is that 2600 support level to hold. We have resistance at 2770 and if the S&P cannot get up through that resistance level we could see a sharp decline testing 2600.  If 2600 is tested and does not hold, then we have 2580, 2535 and 2500. Our previous long-term projection was after 2930 we would see a sharp correction with a potential low of 2470 – that projection is still valid.

spx1101

There are lots of reasons for the market to drop dramatically and do not underestimate the impact of a Democratic win in the upcoming elections. As investors we do not participate in political discussions other than to say if the markets felt that Trump’s tax and regulation policies were to be rolled back we would see a violent reaction.

Key support levels to watch tomorrow and next week are  27002600, 2580, 2535. Expect a wild ride over the next month.

Long-term trend is bullish

Immediate trend is neutral

Our current position is neutral

Once again we implore every investor to have a hedging or exit strategy.  As an investor you need to be prepared for a serious market correction, or potential crash.  If the recent market action has caused you to lose sleep at night then you are not properly protected.  Now is the time to protect your investments.

If you have not done so already, for each of your positions determine how low you are willing to let them go before selling. Then use SELL Stops and if they are hit, SELL, do not change your mind and talk yourself out of  selling. Or if you do not want to sell for tax or other reasons, use a hedging service like Trend Technical Trader. TTT subscribers who have followed its lead have booked gains of over 40% in a number of trades in just the last 5 or so weeks. If you want to subscribe, we will extend our earlier offer of a $250 discount, meaning you only pay $399.95.

If you had been a TTT subscriber and actioned those trades, they could have covered a decades’ worth of subscriptions. Click here to take advantage of this offer. It’s your money – take control!

Gold:

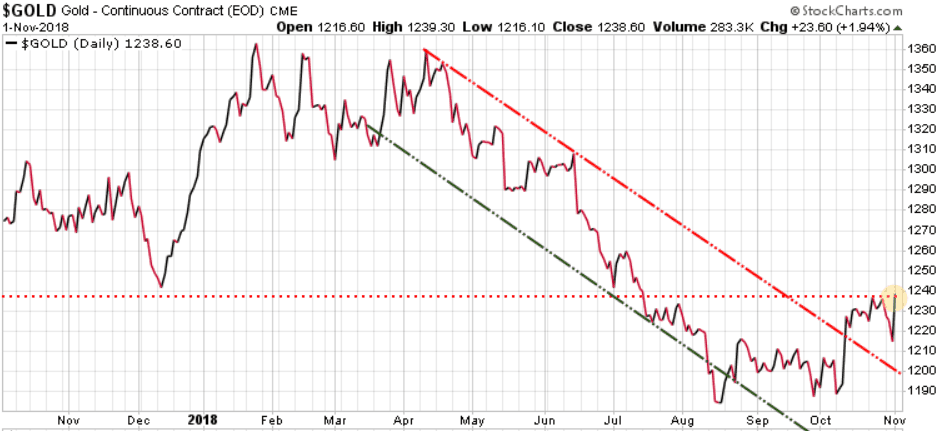
Gold had a solid day gaining 23.60 and closing just above its previous high.  If it can continue higher, 1260 is its next resistance level.

gld1101

Long-term trend is bearish

Immediate trend is bullish

Our current position is bullish

Stay tuned!

October 29/18

Stocks:

Another wild day as the markets opened strong, dropped dramatically, recovered some of those losses, but finally closed lower. The Dow had a swing of over 900 points during the day with the S&P and Nasdaq also having tough days. At the end of the day the tech heavy Nasdaq was down 2.02%, the Dow down .99% and the S&P down .66%.

The big talking points today were more China/US trade tensions, trading algorithms, and the US elections, where polls are showing that the Republicans will lose the House.

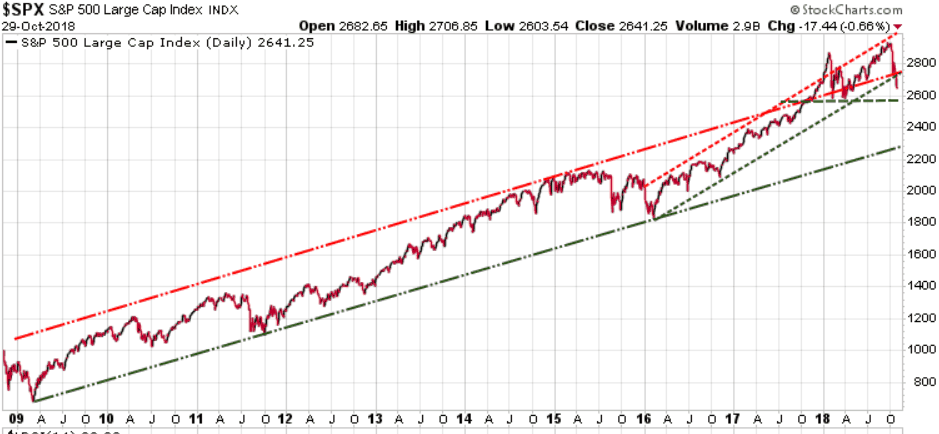
We now must watch to see if the 2600 level holds and particularly the 2580 level (green horizontal line).

spx1029

Key support levels to watch this week are 2600, 2580, 2535

Understand that the long-term trend is still bullish and will be as long as the S&P 500 holds above 2300.

Long-term trend is bullish

Immediate trend is bearish

Our current position is neutral

Gold:

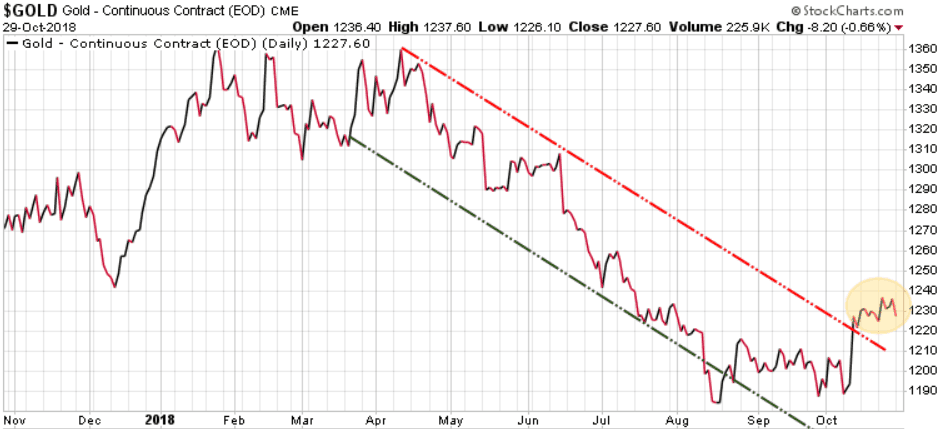
Gold continues to struggle to maintain any ‘safe haven’ status as it was down 8.20 today, even with all the market angst.

gold1029

Currency:

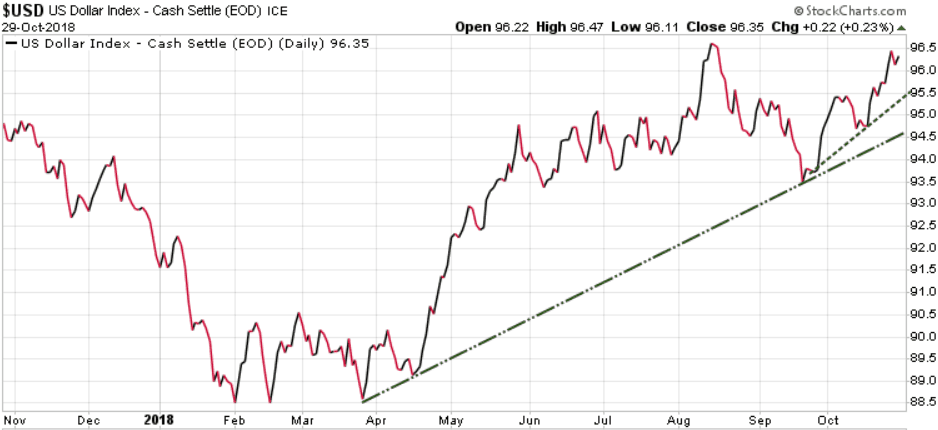
Global capital seeking a ‘safe haven’ continues to flow into the US dollar.

USD1029

Stay tuned!

October 24/18

Stocks:

Today stocks fell sharply lower as losses accelerated into the close, which put both the Dow and the S&P 500 into the red for the year, and the Nasdaq into correction territory (10% decline). The S&P dropped whopping 84.59 points or 3.09%.

There are lots of news items driving this decline, but we believe that politics is now moving front and centre.  It is already ugly, but this US election is going to be very destructive. We live in Canada and have no vote in the US election. Our role is to help investors understand what is happening in the global economic environment and to help subscribers protect and grow their wealth.

What we do know is that whatever your opinion of Trump the person, his policies of lower taxes and reduced regulations have been very  good for US businesses, and they have been key drivers for this bull market.  The market right now is very concerned that if the Democrats win the election, these tax breaks and reduced regulations will be rolled back, hurting the profitability of these companies, so they are selling off.

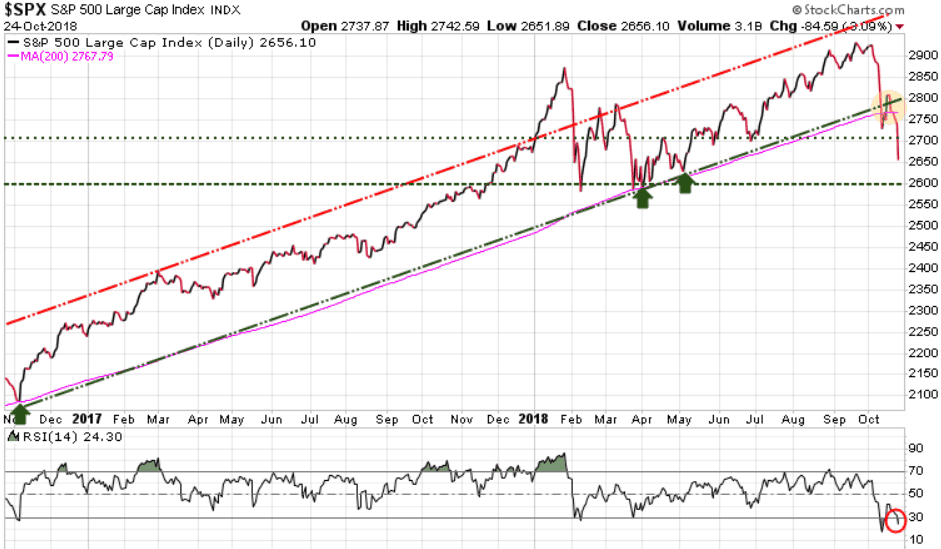
On a technical basis the S&P closed 111 points below its 200-day MA (pink line), which clearly bearish. It has also fallen definitively below its 2-year uptrend channel, also bearish.

Our next key support level is the late March low at 2600.  Our yearly forecast target low for the S&P had a potential for 2535, then 2470. Both of these will become valid if we break the 2600 level.

Looking at the bottom of the following chart we can see that the Relative Strength Index (RSI) has dropped to 24.30 (red circle), and whenever we see a reading below 30, it is considered oversold. This does not guarantee a rally here, but it does set up for at least a bounce soon.
spx1024

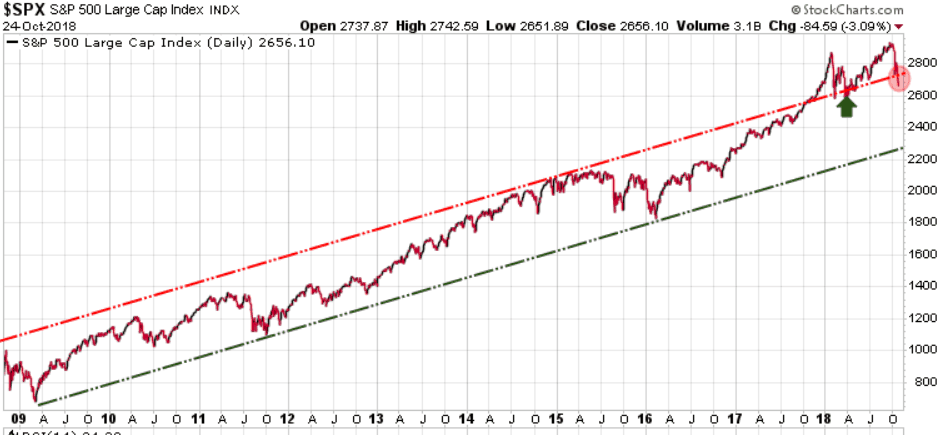
Looking at the bigger picture we see that the S&P has been trading above its 9+ year uptrend channel, although it has now fallen below the upper level of that channel.  All this action is bearish, suggesting that the S&P will very possibility test the 2600 level.  Given that markets decline much faster than they rise, we could see this support level hit this week, although the RSI suggests we see a bounce very soon.
spxlong1024

Understand that this is still a long-term bull market and that corrections are to be expected along the way. This bull market has been so strong over the past two years it appears some investors forget that corrections can be a healthy part of the process, they provide buying opportunities. We will see if this is simply a healthy correction or if it is the start of a new bear market. Everyone has an opinion, we will simply watch the numbers.

Long-term trend is bullish

Immediate trend is bearish

Our current position is neutral

Again we note: Whether you believe that this market is going to run much higher, or believe that we are now heading for a big crash, you need to have an exit or hedging strategy. This bull market will end, whether it starts today, next month, next year, or 2-years from now. Every investor needs to have a strategy to protect your wealth against a serious downside move that is accompanied by recessions.

While we are currently neutral with offsetting long and short positions, our Trend Technical Trader (TTT) hedging service has a number of more aggressive short trades and those trades have gains of 21.16% (entered Sept.5/18), 52.77(entered Sept 2/18), 45.52% (entered Oct 4/18), and 41.81% (entered Oct 4/18). All of these trades are simple click of the mouse actions, the same as trading any stock online. If you would like to subscribe to TTT, we are extending our Special Offer at $399.95, a $250 discount. Click Here to subscribe at this rate. It’s your money – take control!

Gold:

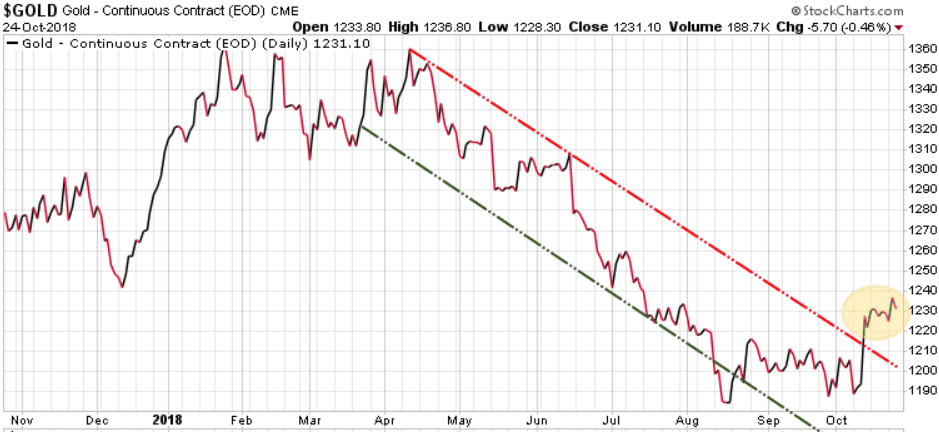
Gold was a big disappointment today, down 5.70, as it failed as a safe-haven play against a crashing equity market.  The safe-haven winners today were US bonds, the US dollar, and to a lesser degree, the Japanese Yen.
gold1024

Immediate trend is bullish

Long-term trend is bearish

Our current position is a buy

Stay tuned!

October 23/18

Stocks:

Another wild day in the markets with the S&P 500 trading in a range between the high at 2753.59 to a low of 2691.43, before rallying back some to close at 2740.69, down 15.19 or .55% for the day.

The latest news driving the market down was..

  • a Chinese official told a group of U.S. business leaders that China is not afraid of a trade war.
  • the EU has rejected Italy’s budget, demanding changes to both deficit spending and growth estimates. This is the first time the EU has rejected a countries budget. Rhetoric from both sides suggest that Italy’s relationship with the EU is not getting better.

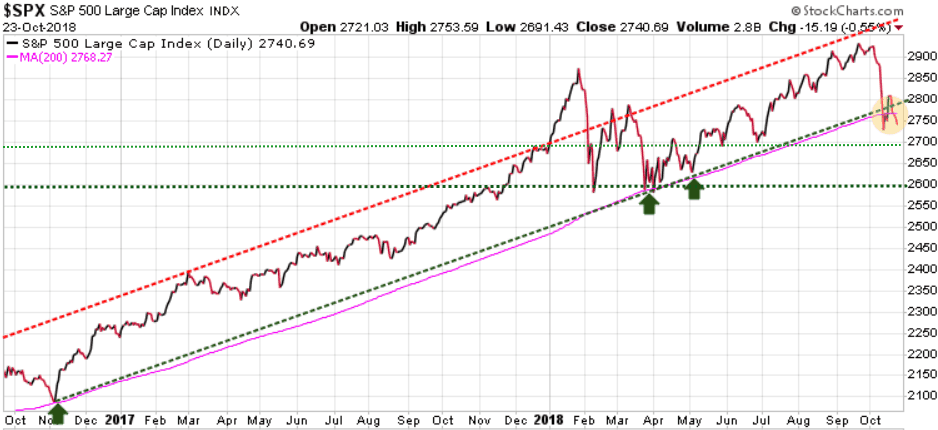
The immediate concern here is that the S&P closed 27.58 points below its 200-day MA (pink line), so we need to keep an eye on this as in each recent test (green arrows) the 200-day MA  support level has held.

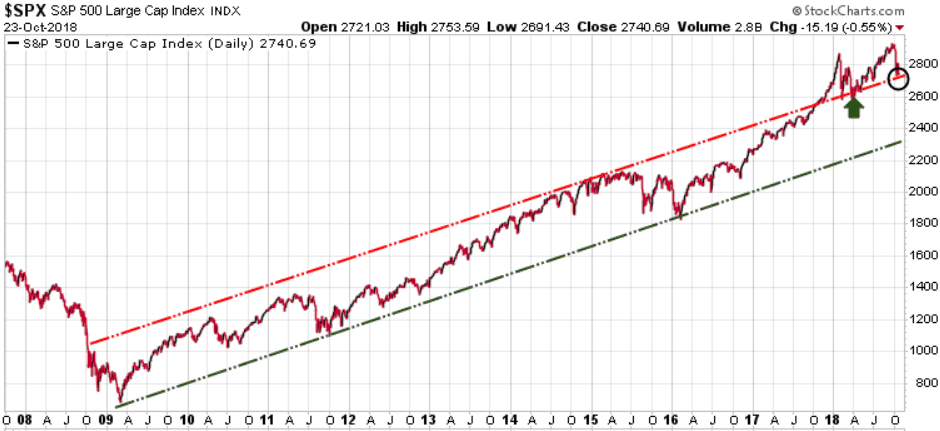
Looking at the bigger picture we see that the S&P is still trading above its 9+ year uptrend channel, although it did dip below the upper level during the day today.  In the near-term we need to see the S&P continue to close above the upper level of that channel at 2715. Keep an eye on this level.

Spxlong1023

Long-term trend is bullish

Immediate trend is neutral

Our current position is neutral

Note: Whether you believe that this market is going to run much higher, or believe that we are now heading for a big crash, you need to have an exit or hedging strategy.  This bull market will end, whether it starts today, next month, next year, or 2-years from now.  Every investor needs to have a strategy to protect your wealth against a serious downside move that is accompanied by recessions.

While we are currently neutral with offsetting long and short positions, our Trend Technical Trader (TTT) hedging service has a number of more aggressive short trades and those trades have gains of 10.9% (entered Sept.5/18), 37% (entered Sept 12/18), 33.8% (entered Oct 4/18), and 30.4% (entered Oct 4/18).  All of these trades are simple click of the mouse actions, the same as trading any stock online. If you would like to subscribe to TTT, we are extending our Special Offer at $399.95, a $250 discount. Click Here to subscribe at this rate.

Gold:

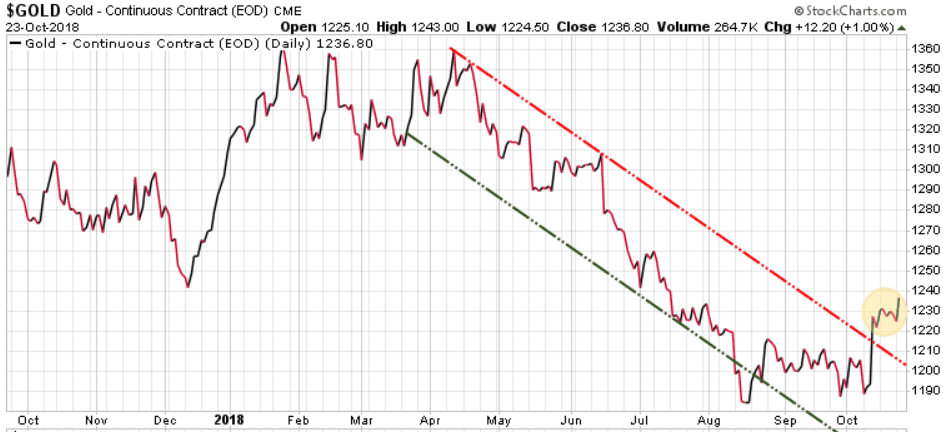
Gold popped up to 1245 at the intra-day high today as the equities were hit, but then cooled off and closed the session at 1236.80, up 12.20 for the day.

 gold1023

Immediate trend is bullish

Long-term trend is bearish

Our current position is a buy

Stay tuned!
October 19/18

We follow the trends and capital flows. Remember, this is a global market, it is all connected.

Stocks

Today was the 31st anniversary of ‘Black Monday’, when in 1987 the Dow dropped a massive 23% in one day.  Today we saw nothing like 31 years ago, with the S&P 500 up almost 30 points, before giving it all up and closing down a single point.  With volatility ramping up, traders are being more reluctant to hang on to stocks over the weekend, fearful that some event (or tweet) could send the market on another sharp decline.

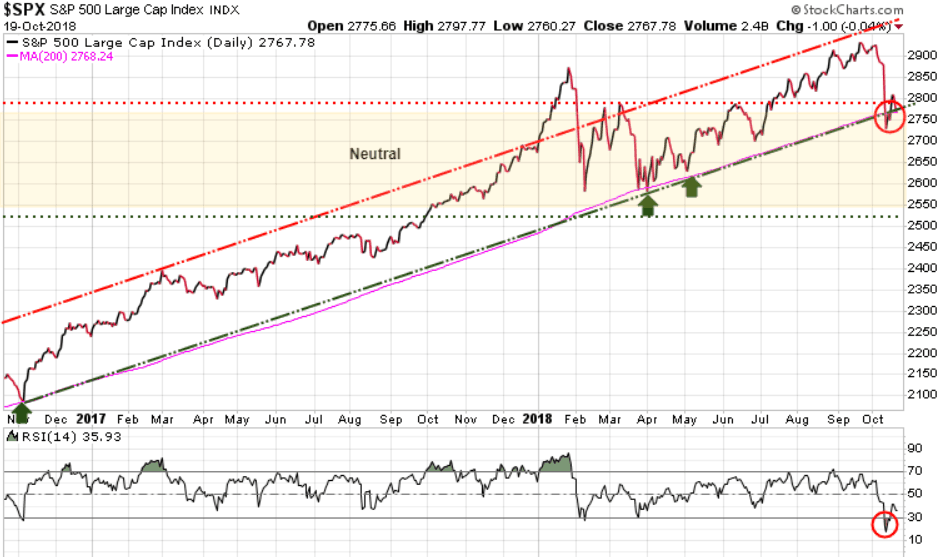
Last week after the large declines on Wednesday and Thursday we highlighted how the 200-day MA (pink line on chart) was a very key support area for the S&P 500. The last three times this support area was tested (November, March, and May) this support level held (green arrows on chart below).

Last week we also noted that the Relative Strength Index (RSI) had dropped to 17.66. An RSI reading above 70 indicates that the market is ‘overbought’  and that investors have become ‘complacent’, with a ‘risk-on’ sentiment. Conversely, an RSI reading below 30 indicates that the market is ‘oversold’, and that investors have become ‘fearful’, with a ‘risk-off’ sentiment. Whenever we get to these ‘overbought’ or ‘oversold’ extremes we typically see the market reverse and move in the opposite direction.

Looking at the lower part of the chart we see that the Relative Strength Index (RSI) is now back above 30, at 35.93.

Continue to watch the 200-day MA and if the S&P cannot climb back and close solidly above this support it means we are not out of the woods yet and that more moves to the downside are certainly possible. If it can hold above that level, then this could be the low for this move and we head higher to test the previous high at 2930.

Long-term trend is bullish

Immediate trend is neutral

Our current position is neutral

spx1019

Gold

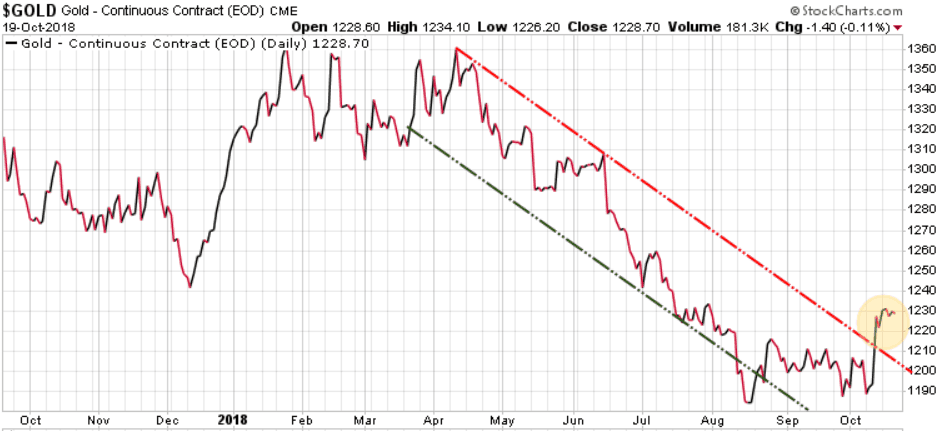
Gold was flat this week, having broken out of its near-term downtrend channel last week. Gold now needs to close above 1246, then push through and close above 1260, 1307, and 1377 to have a chance of having a solid bull run.

Long-term trend is bearish

Immediate trend is bullish

Our current position is a buy


Gold1019

There are talking heads flooding the airways with their opinions, but we just watch the numbers, and let the market tell us what direction it is going. The markets can be very deceptive and will play on your emotions. Instead of forming an opinion of what you think the market should do, watch the key support and resistance levels, and see what the market is actually doing.

The reason that we see the market reverse when it hits extremes is because the majority must always be wrong to fuel bull and bear markets. In the last stages of a bull market a mania is created where everyone wants in. Prices rise dramatically creating a FOMO (fear of missing out) sentiment where the average investor feels incredible pressure to jump into the market, right at the extreme top. At that point the early investors are more than happy to sell to the masses.  These late to the party investors are then stuck holding stocks when there are no more buyers.

In bear markets we see a similar story. As prices start to fall a new panic is created where everyone wants to sell, but there are no buyers, so the decline in prices escalates as everyone is running to the exit. Typically those same late to the party investors who bought right at the top, are the last to get out, often finally selling right near the bottom. And then the cycle repeats.


This weekend’s issue of The Trend Letter will have full coverage of where we sit with all markets, including the equity, bond, currency, precious metals, and commodity markets. If you are not a subscriber but would like to be, we are offering a special discount of $200 off the regular price of $599.95, so you only pay $399.95.  To take advantage of this offer, click here. 


If you have a substantial portion of your portfolio in stocks, or just need to protect yourself in case of a severe correction, seriously consider a ‘hedging’ strategy. While we expect to see higher highs before the ultimate top in this bull market, we certainly expect to see a great deal of volatility along the way. Last week was a wake up call for those who are not prepared for a significant correction.

We do not know of a better hedging service than Trend Technical Trader (TTT) which is designed to make money in a down market. TTT uses a combination of conservative and aggressive strategies to position subscribers to profit in a declining market. These TTT trades are simple to action, the same as any trade recommended in Trend Letter. We are offering a subscription to TTT for only $399.95 (regular price is $649.95). Click Here to take advantage of this offer. It’s your money – take control.

Stay tuned!