Posts by The Trend Letter

Market Notes

Market Charts – February 28/22

Yesterday, the US and its allies ramped up their sanctions against Russia when they announced that certain Russian banks would be shut off from SWIFT. That’s a global messaging system used by banks worldwide to conduct their business and issue payments. It’s a key system when it comes to a country’s ability to participate in international trade. SWIFT is an acronym for the Society for Worldwide Interbank Financial Communications.

The Bank of Russia halted trading in Moscow on Monday, one of several measures unleashed in a bid to shield the nation’s economy from sweeping sanctions.

The Russian ETF is down a staggering 28% today, and  56% in the last week.

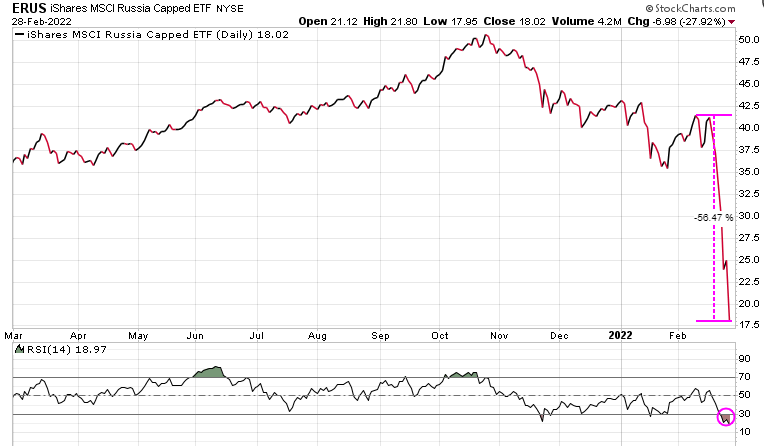
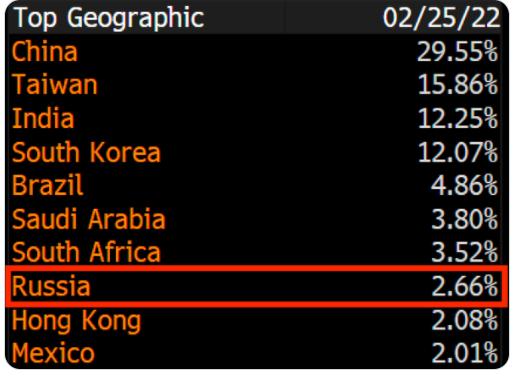
According to Reuters, equity index provider Morgan Stanley Capital International (MSCI) on Monday said Russia’s stock market is ‘uninvestable’ after stringent new Western sanctions and central bank restrictions on trading, making removal of Russian listings from indexes a ‘natural next step.’ With more than $924 billion in emerging markets ETFs, and with a Russian weighting of 2.66%, this move means that over $24 billion will flow out of Russian equities.

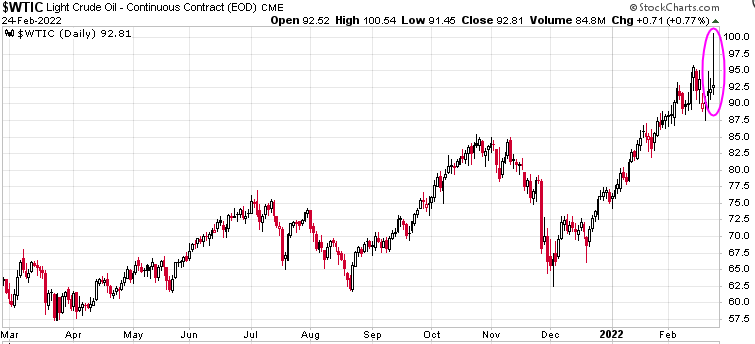
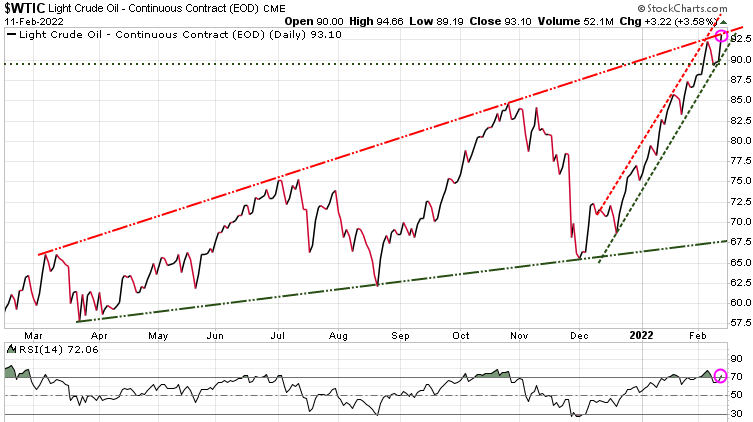
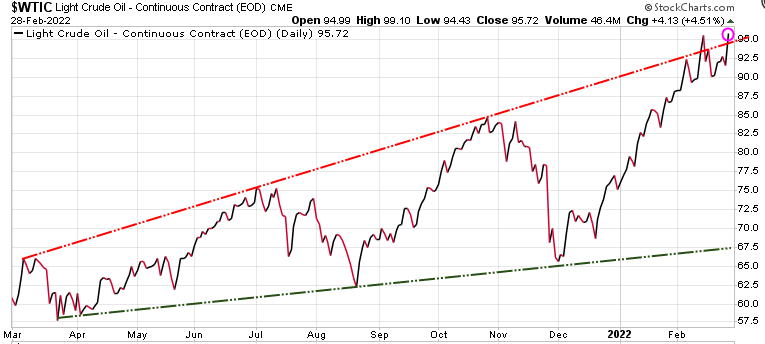
Oil was up another 4.13 or 4.51% as new sanctions put squeeze on many commodities.

Stay tuned!

Market Charts – February 24/22

The market was initially spooked by Moscow’s invasion against neighboring Ukraine early Thursday morning local time, using land, air and naval forces. The S&P 500 was down as much as 2.6% during the session but closed up 1.5% higher despite the outbreak of violence.

As we had been highlighting, if the S&P 500 tests the 4200 level we should see a short-term bounce. It breached that level intra-day but closed at 4288.

Oil prices settled well off their highs alongside the recovery in equities. The US oil benchmark, WTI, settled the day 71 cents, or 0.77%, higher at 92.81 per barrel after hitting a high of 100.54 during the day.

Gold also had a wild day, with a high of 1976, then down to 1911 before closing at 1926. Note at bottom of chart, gold is now technically overbought

Stay tuned!

Market Notes

Market Charts – February 23/22

(From Yahoo Finance)…Stocks extended losses on Wednesday after a steep sell-off during Tuesday’s trading day, which pushed the S&P 500 and Dow to their lowest settlements so far of 2022.

The S&P 500 wiped out early advances to trade sharply lower in afternoon trading. The blue-chip index had also closed lower by just over 1% on Tuesday, bringing it more than 10% from its record closing high from Jan. 3 — or below the threshold to enter a correction.

Hopes of a diplomatic resolution for tensions between Russia and Ukraine appeared to deteriorate this week, as President Joe Biden publicly called Russia’s move to deploy troops to separatist regions of Ukraine “the beginning of a Russian invasion” of the region. The US unleashed a first tranche of sanctions on Russian financial institutions, sovereign debt and several key individuals in the country. Late Tuesday, US Secretary of State Antony Blinken also said he called off a meeting with his Russian counterpart, Foreign Minister Sergei Lavrov, that was supposed to take place this week.


The S&P 500 has now broken through the 4300 support level and is just 25 points from testing critical support at 4200. Note at the bottom of the chart that based on RSI, the S&P 500 is close to being oversold. This suggests that if we hit 4200, we could form a temporary bottom at that level.

If you are a trader and are looking for a short-term bottom, do not buy until you see the market form a bottom and then start to turn up. You do not want to  try and catch a falling knife.

Hopefully, you have taken our advise and established exit or hedging strategies. If you do not have a hedging strategy, seriously consider subscribing to Trend Technical Trader (TTT) which offers numerous hedging strategies. Note also, TTT includes the Gold Technical Indicator (GTI).

To ensure all readers have access to this hedge service, we temporarily reduced the price by $300. Click button below to subscribe. It’s your money – take control!

Stay tuned!

Market Notes

Market Charts – February 22/22

The S&P 500 on Tuesday fell into a correction for the first time in two years, joining the Nasdaq Composite, as Russia sent troops into pro-Russian regions in Ukraine.

The S&P 500 index SPX, closed at 4,304.76, below the correction level at 4,316.91, which would represent a 10% drop from its Jan. 3 record close. A correction is commonly defined by market technicians as a fall of at least 10% (but not greater than 20%) from a recent peak.

The last time the S&P 500 entered a correction was Feb. 27, 2020, when the market was being whipsawed by fears about the outbreak of the COVID pandemic.

This time around, investors were wrestling with escalating tensions between Moscow and Kyiv, which could devolve into a full-blown war. Wall Street also was wrangling with a surge in inflation and a Federal Reserve that is bent on hiking interest rates to combat growing pricing pressures, which, incidentally, could be exacerbated by Ukraine-Russia tensions.


The S&P 500 closed right at our initial near-term support level at 4300, which is below the January low. As we have been warning for the last month, the next level of support is 4200, and if that level is breached, we could be in for a significant correction.

The Nasdaq was down 1.23% today and is now down ~17% since the  November high.

Gold was up 7.60 and managed to close above 1900. A bit surprised it didn’t do better given Russia’s escalation with Ukraine

Stay tuned!

Market Notes

Market Charts – February – 21/22

North American markets were closed today, but we wanted to give investors a heads up as we head into a new week of trading.  As we have been highlighting the last couple of weeks, near-term support for the S&P 500 sits at 4300, then 4200 (green horizontal lines on chart). As Martin highlighted in his interview on Mike Campbell’s Money Talks this  weekend (click here to listen), if the 4200 level does not hold, WATCH OUT! 

Many have asked if the 4200 support level is breached, how low is the S&P 500 likely to go? A potential answer could where the Fed Put kicks in; the level the S&P 500 would drop to before the Fed reverses policy to support the market.

Using Fibonacci retracement level from the March 2020 low as a guide, from the December 2021 high, the first level the Fed might act could be a 38.2% retracement to 3800A 50% retracement would take it to 3494 & a 61.8% retracement would see the S&P 500 drop to 3187

Be sure to have a hedging or exit strategy to protect your wealth. If you do not have a hedging strategy, seriously consider subscribing to Trend Technical Trader (TTT) which offers numerous hedging options. Note also, TTT includes the Gold Technical Indicator (GTI).

To ensure all readers have access to this hedge service, we temporarily reduced the price by $300. Click button below to subscribe. It’s your money – take control!

Stay tuned!


Money Talks interview with Martin Straith

Martin was the guest on Michael Campbells’ Money Talks podcast this weekend. Topics included how to protect your investments and investing in Psychedelic therapies.

Market Notes

Market Charts – February 18/22

Stocks extended declines Friday to close a second straight week in negative territory with geopolitical tensions intensifying to contribute to a further risk-off tone in markets.

The S&P 500 fell 0.71% to 4,348.97, building on a 2% loss in the previous session, while the Dow Jones index closed down 0.68% to 34,079.12 after erasing 1.8% Thursday for its worst day in nearly three months. The Dow also closed at its lowest level since September. The Nasdaq Composite shed 1.23% to 13,548.07 — its lowest level since January. Meanwhile, the CBOE Volatility Index (VIX), or “fear gauge,” spiked back to hover near 28 Friday.


The S&P continues to trade in its near-term downtrend channel. We are seeing lower highs, and lower lows, which is bearish. Near-term support remains at 4300, then 4200.  Near-term resistance sits at 4600, which has been tested twice, and each time that resistance level has held.  If the 4200 level is breached, then a much deeper correction is possible.

Note that is we do test the 4200 level, at least a temporary rally should follow.

Gold was down 4.00 today, a little profit taking after its impressive run this month. Russia-Ukraine tensions are certainly contributing to this rally. Note at the bottom of the chart, RSI is very close to being technically overbought.

Stay tuned!

Market Notes

Market Charts – February 15/22

The S&P 500 closed higher by 1.6% in its first rise in four sessions. The jump came amid an announcement from Russia that it had pulled back troops near Ukraine and was seeking to continue diplomatic efforts with the West. However, President Joe Biden said during a news conference Tuesday afternoon that a Russian invasion of Ukraine remained “distinctly possible,” while noting that diplomacy should be given “every chance to succeed.”


For the S&P 500 the levels to watch are the 4600 near-term resistance level and the 4300 near-term support.

New margin debt totals were just released. This chart shows real growth of both the S&P500 and margin debt. The real risk here is that with margin debt so high, if we get a significant pull back or correction in the equity markets, margin calls will kick in, forcing these speculators to sell to cover, exacerbating the decline.

The threat of a Russian invasion of Ukraine has been pushing oil prices to a seven year high this year. But with Russia claiming to be pulling troops back from the Ukraine border,  oil and energy stocks reversed some of those recent gains today.

Stay tuned!

Market Notes

Market Charts – February 14/22

Stocks fell Monday as investors eyed the escalating threat of Russian invasion in Ukraine alongside ongoing concerns over inflation and an aggressive move toward policy tightening by the Federal Reserve.

The S&P 500 came off session lows but still ended in the red to extend losses after last week’s roller-coaster sessions on Thursday and Friday. Treasury yields rose and the 10-year yield hovered back near 2%. The latest leg lower came after the Wall Street Journal reported the U.S. was closing its embassy in Kyiv and destroying networking and computer equipment, with concerns over a Russian military attack mounting.


For the S&P 500, we are still focused on the 4300 and 4200 key support levels.  A break through the 4600 resistance level would be bullish. We do look for a bounce here, but expect it to be short lived, then the 4300 support level to be tested.

War tensions have pushed both gold and the $US higher. Typically, when the $US is rising gold declines, but in times like these, both become safe-haven plays. Gold has now pushed through its declining wedge pattern and is testing the November high, both bullish.

Stay tuned!

Market Notes

Market Charts – February 11/22

(From Yahoo News)…Stocks added to Thursday’s losses as jitters over a swift tightening of financial conditions increased on the heels of a multi-decade high print on inflation. Fresh geopolitical concerns between Russia and Ukraine further weighed on stocks and sent oil prices soaring to a fresh seven-year high.

The S&P 500, Dow and Nasdaq fell during a choppy session Friday. Stocks sank to session lows Friday afternoon, after the UK issued a warning for British citizens to leave Ukraine as tensions with Russia mounted further. The benchmark 10-year Treasury yield turned lower after breaking above 2% for the first time since August 2019 a day earlier.


We continue to show the chart of the S&P 500 with our model’s projection of a potential test of the 4200 support level, then a bounce to 4400, and another test and potential breach of the 4200 level into mid March.

Oil rose for an eighth straight week as tensions between Ukraine and Russia heightened concern about tight global supplies. US National Security Advisor Jake Sullivan said Friday that the US believes Russia could take offensive military action or attempt to spark a conflict inside Ukraine as early as next week.


Gold is catching a bid as markets worry the Federal Reserve could opt for an emergency rate hike before the March meeting to try and tame inflation. Gold is up nearly 2% on the week as more investors turn to the precious metal amid a widespread risk-off sentiment in the marketplace. This week’s shockingly high US inflation report has added more uncertainty regarding the Fed’s tightening plan.

Note: If you are not hedged or do not have an exit strategy seriously consider subscribing to our premier hedging service, Trend Technical Trader. To ensure all readers have access to this hedge service, we temporarily reduced the price by $300. Click button below to subscribe. It’s your money – take control!

Stay tuned!