Posts by The Trend Letter

Market Notes

Market Charts – April 5/22

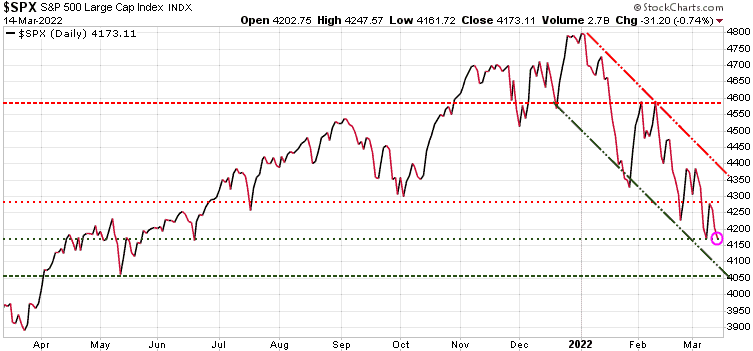
US stocks faltered on Tuesday, dragged down by losses in tech, as investors weighed remarks by Federal Reserve Governor Lael Brainard that indicated policymakers were ready to act more aggressively to rein in inflation. Investors also monitored reports indicating the US and European Union are expected to unveil more sanctions against Russia on Wednesday.

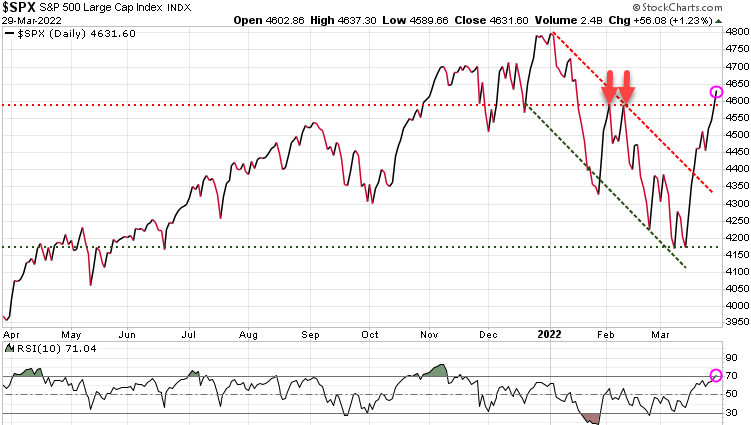
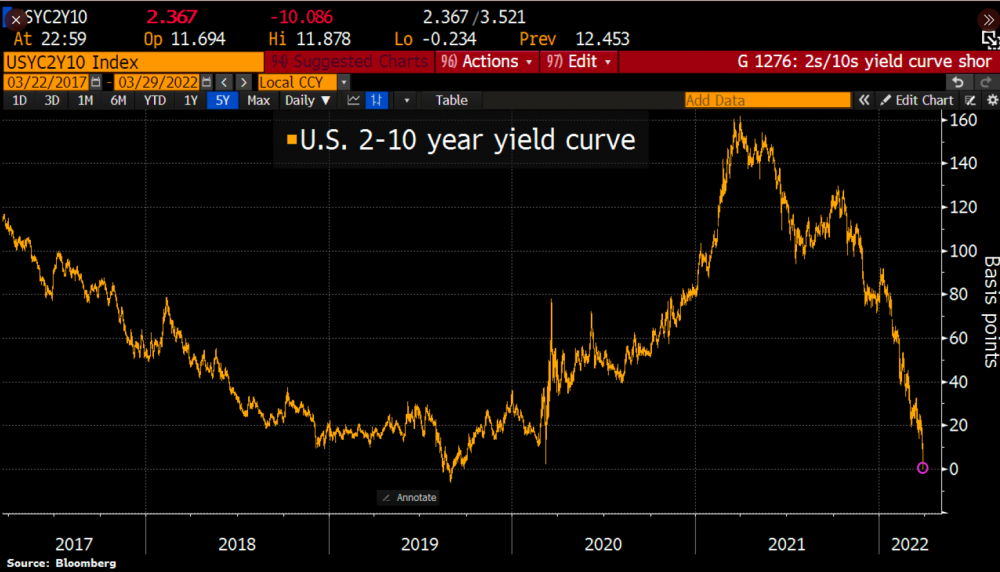
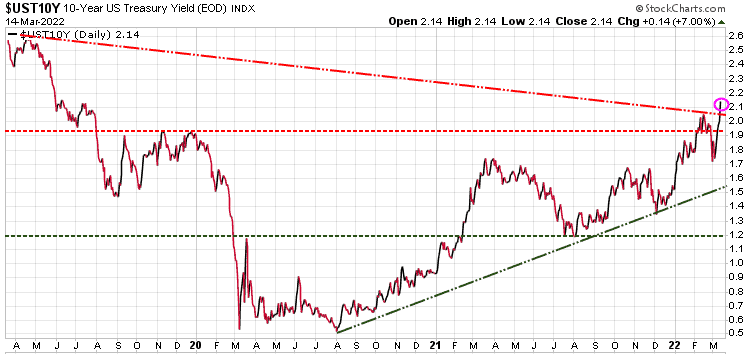
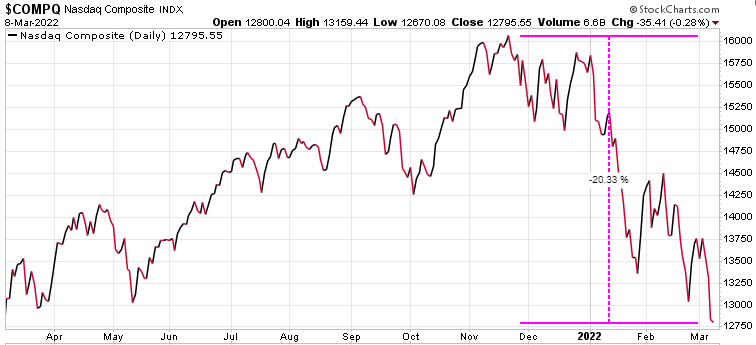
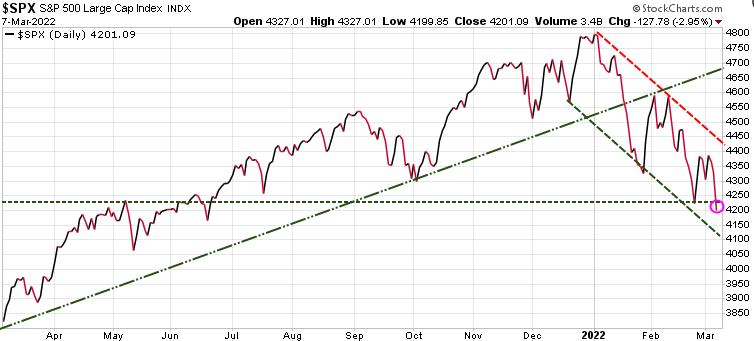
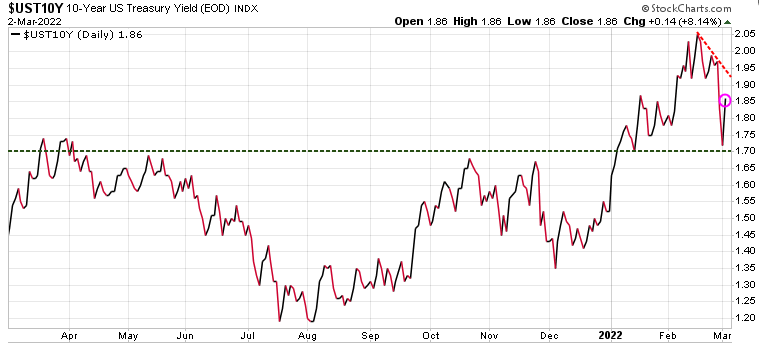
The S&P 500 tumbled 1.3%, and the Dow Jones Industrial Average shed 280 points after climbing for two straight trading sessions. The Nasdaq Composite plunged 2.3% to log its biggest drop in three weeks and erase gains from a tech rally that helped the index pop on Monday. Meanwhile, the 10-year U.S. Treasury yield jumped to 2.56%, its highest level since May 2019.

Brainard, who is awaiting a confirmation vote to serve in the central bank’s number two role, said at a conference on Tuesday that the Fed can raise interest rates more aggressively to dampen the high rate of inflation felt by Americans, also noting that officials will likely start shrinking asset holdings in a about a month (a move that could have the effect of further raising long-term interest rates).


FOMC board members speak all the time, but Brainard is the pending vice-chair,  so her comments should be given more weight than other Fed members. We had been warning our Trend Letter subscribers know that the Fed was between a rock and a hard place.  If they raise rates and reduce their balance sheet to fight inflation, they will crush the stock markets and risk putting the economy into a deep recession.  If they don’t fight inflation, it will continue to soar. And because it is an election year in the US, and given lower income voters are hit hardest by rising inflation, there will be political pressure to fight inflation, even if it means crushing the economy and stock markets.

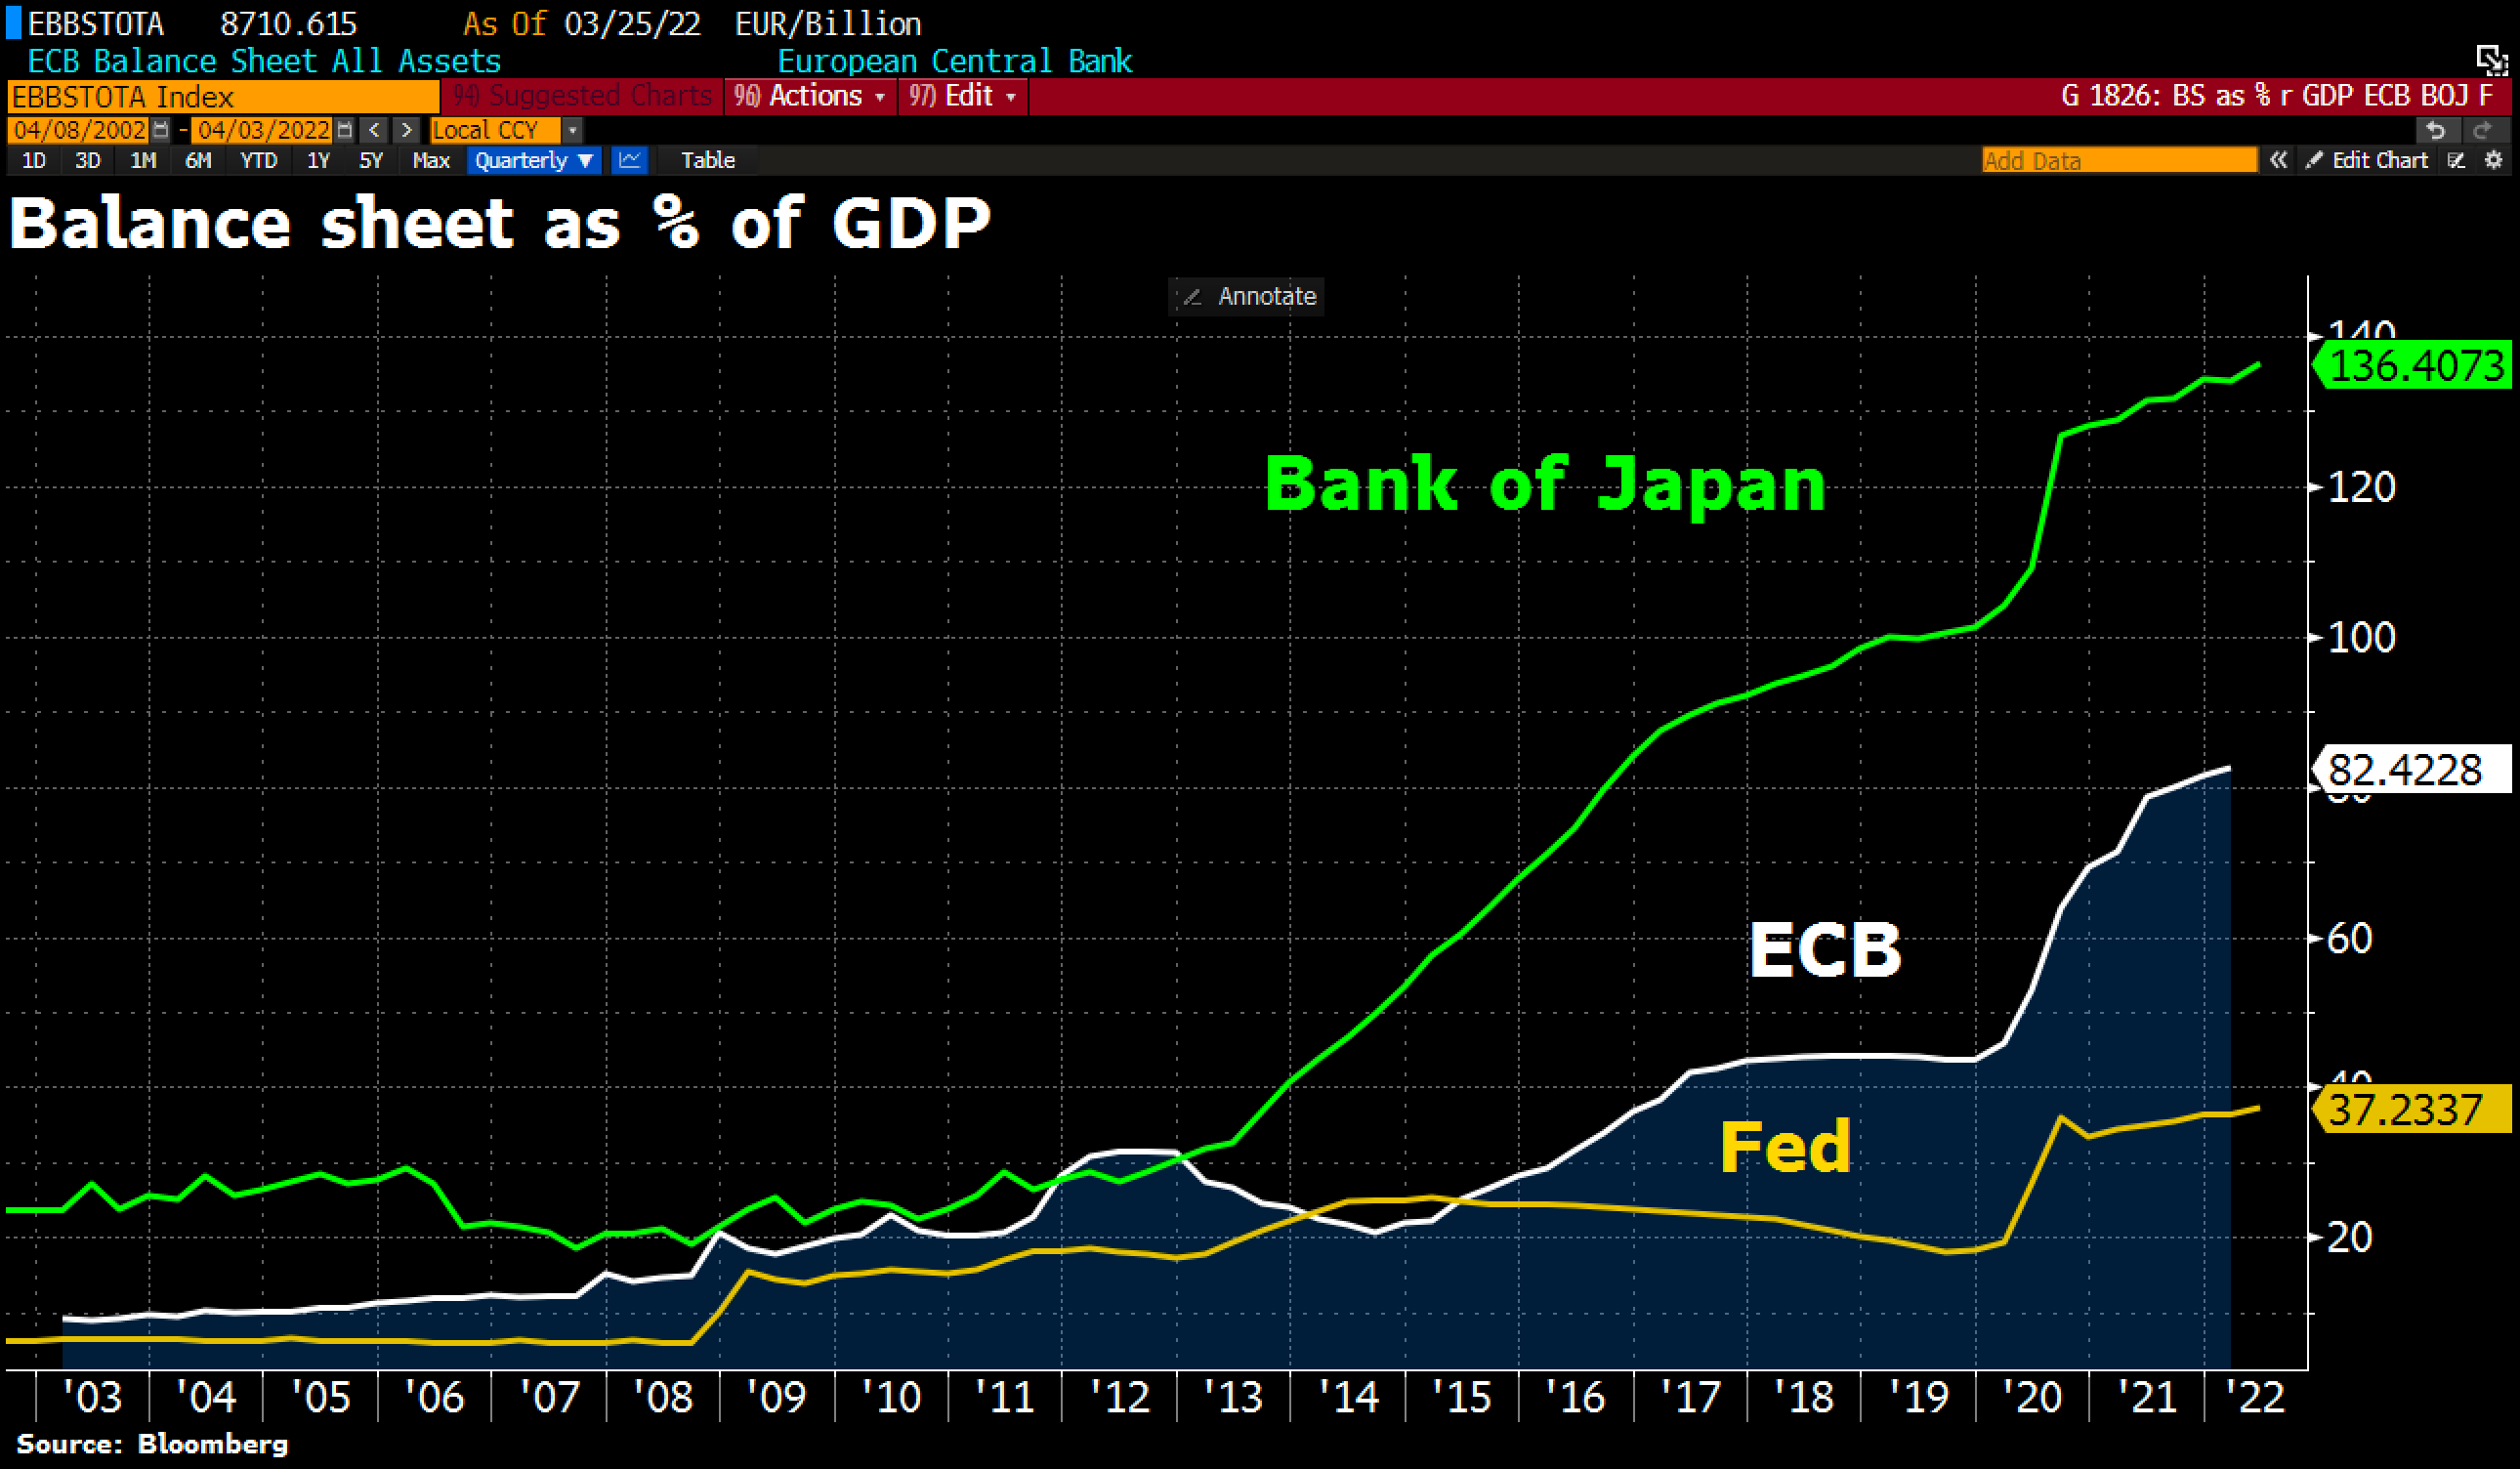
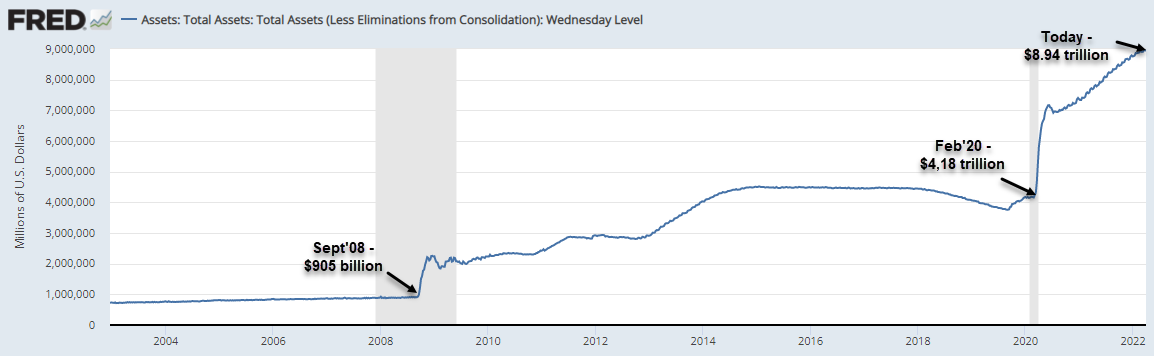
With Brainard indicating that QT (reducing balance sheet) will be accelerated, this is a big negative for financial assets, meaning stocks and credit will be under pressure.  As we can see on this chart, the Fed has aggressively been adding bonds and mortgage-backed securities, running their total assets up from $905 billion in Sept’08 to $8.94 trillion today.

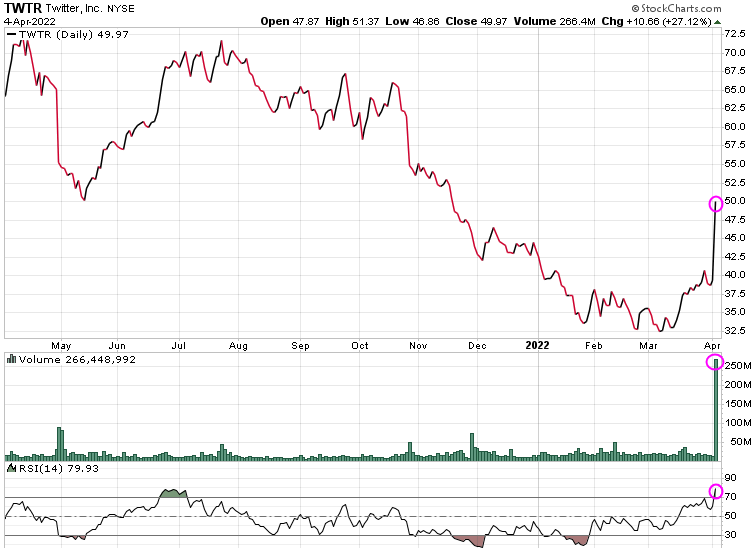
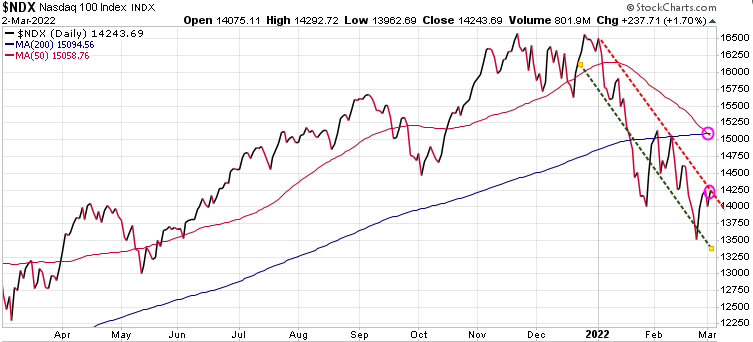
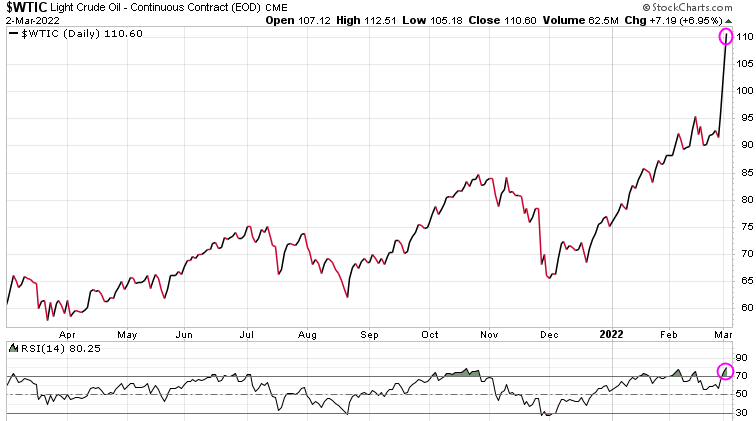
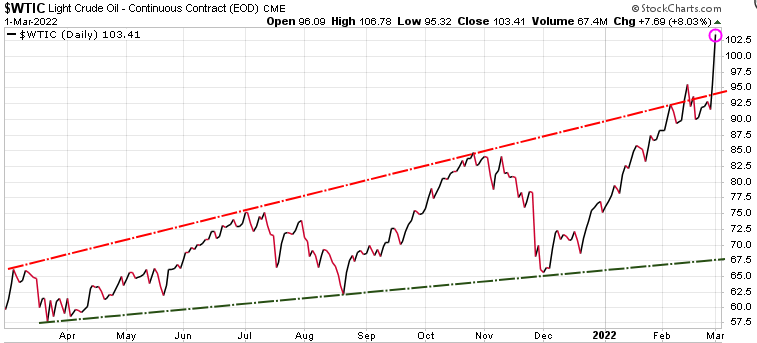
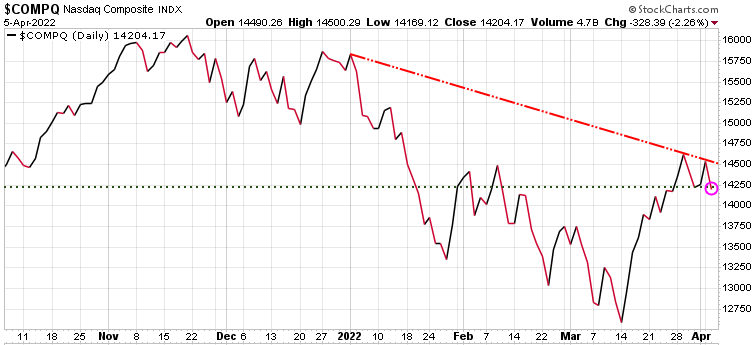
The threat of a more aggressive QT, combined with rising rates, is a negative combination for stocks, especially tech stocks that are not yet generating cash flow and must borrow money to keep the lights on.  The Nasdaq dropped 2.26% after Brainard’s comments. Rising rates, QT, and any escalation in the Russia-Ukraine conflict are not a good combination for stocks.

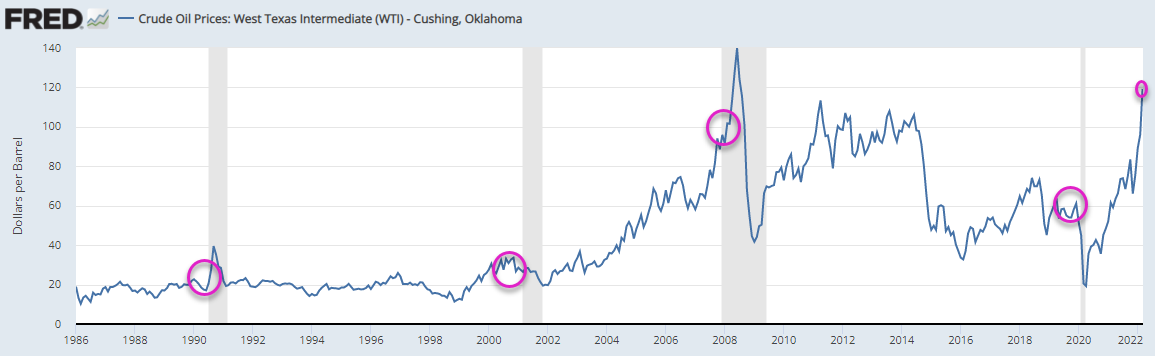
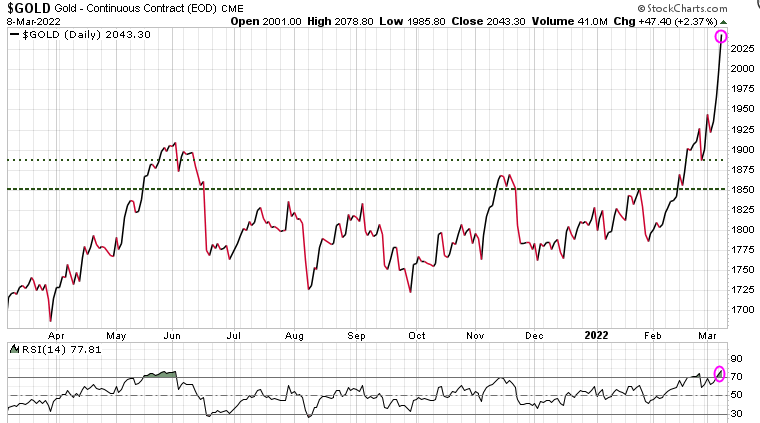
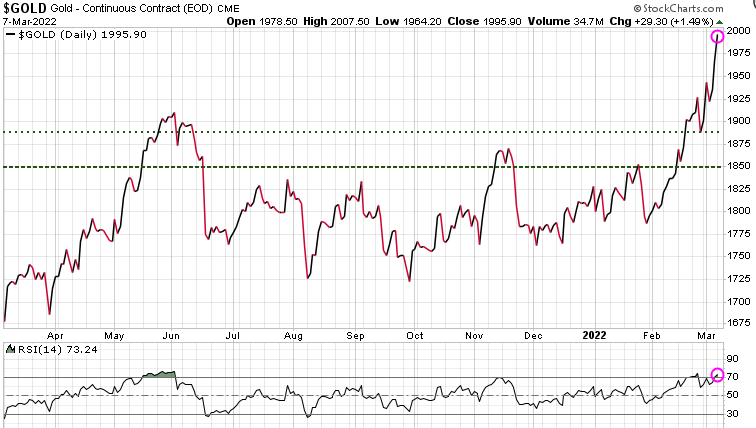
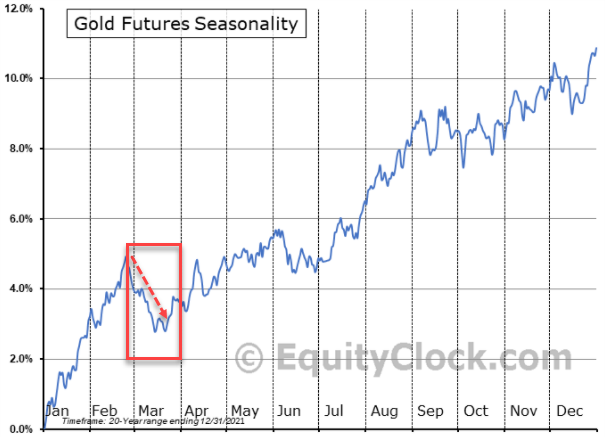
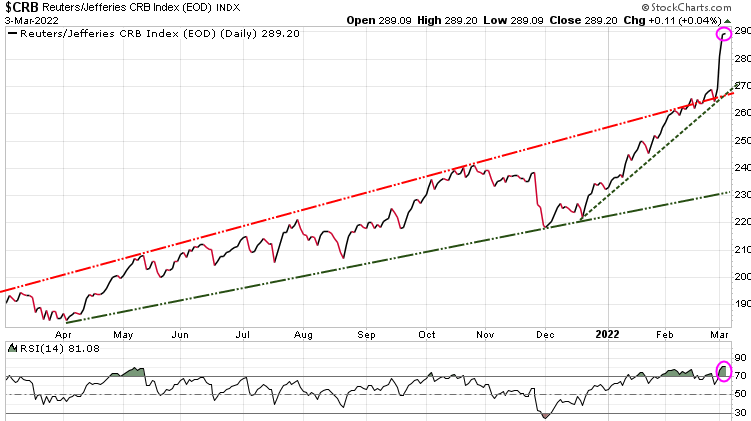
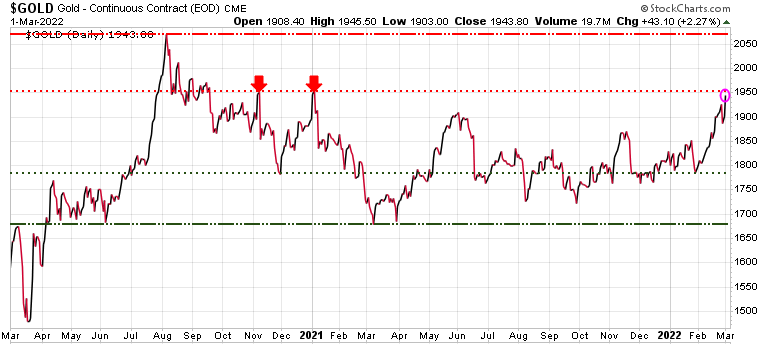
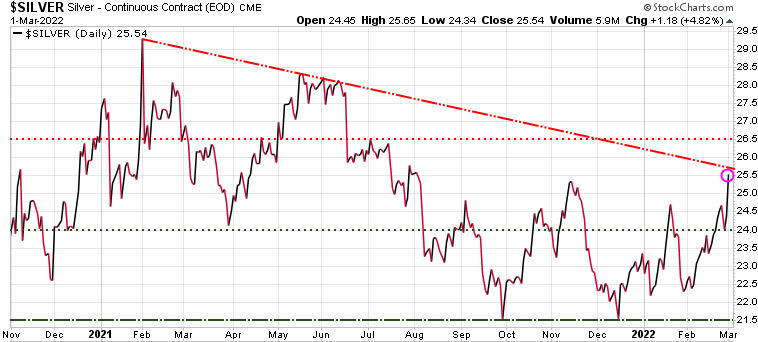
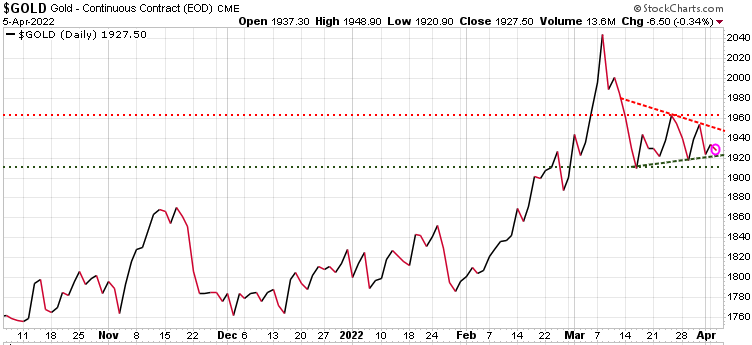
Gold has been stuck in a fairly tight range over the past month, which is discouraging. If it cannot gain traction with soaring inflation and a war, you have to question what will drive it higher?

If you do not have a hedging strategy, seriously consider subscribing to Trend Technical Trader (TTT) which offers numerous hedging options. Note also, TTT includes the Gold Technical Indicator (GTI).

To ensure all readers have access to this hedge service, we temporarily reduced the price by $300. Click button below to subscribe. It’s your money – take control!

Stay tuned!


Market Notes

Market Charts – April 4/22

Stocks on global indexes rose on Monday, with the Nasdaq and growth names leading gains on Wall Street, while the US dollar strengthened on talk of more sanctions against Moscow following international outrage over Ukraine civilian killings.

Adding to investor caution, the 2-year/10-year Treasury yield curve remained inverted, signaling to some market watchers that a recession may follow in one to two years.

The deaths in Bucha, outside Kyiv, are likely to galvanize the United States and Europe into additional sanctions against Moscow over its invasion of Ukraine.


Other News & Charts

Twitter shares surged 27.12% on news that Tesla Inc Chief Executive Officer Elon Musk has built a 9.2% stake in Twitter Inc.. Volume (middle chart) jumped from 12.13 million shares on Friday to 266.4 million on Monday.  Based on RSI (bottom chart), Twitter now overbought.

The biggest monetary experiment in history? Most recently, the Bank of Japan fired up the printing press again to keep long-term interest rates low. Meanwhile, BoJ’s balance sheet now equals an astonishing  136% of Japan’s GDP. In comparison, the ECB at 82% and the Fed at 37% look like amateurs.

Image

US real disposable income breaks from the upward trend as inflation takes a toll.

Is the top in? The Agriculture index (GKX) also became overbought after the run up to 592 in early March.

Stay tuned!

Market Notes

Market Charts – March 29/22

(From Yahoo)…Stocks rose while US crude oil prices fell for a back-to-back session amid signs of progress in Russia-Ukraine talks. Russia said it was easing military action in Ukraine’s capital Kyiv and northern city Chernihiv and was prepared to set a meeting between Russian President Vladimir Putin and Ukraine’s President Volodymyr Zelensky following a draft peace agreement.

The latest batch of US economic data offered a mixed picture on the state of the economy amid still-elevated inflation, ongoing geopolitical uncertainty and tightening monetary policy out of the Federal Reserve. Job openings held little changed at about 11.3 million in March, far outpacing new hires at 6.7 million to reflect persistently rampant labor supply shortages. And while the Conference Board’s latest monthly index showed a slight uptick in consumer confidence in March, the index remained below last year’s average. Plus, consumers’ one-year inflation expectations soared to an all-time high of 7.9%.


The S&P 500 has pushed through the 4600 level, which had acted as strong resistance, having held the two previous tests (red arrows). While this is a bullish move, if we look at the RSI at the bottom of the chart, we can see that it is now technically overbought, suggesting a pullback is likely soon.

A closely watched measure of the yield curve that serves as one of the bond market’s most reliable recession indicators inverted today. The  2-year/10- yield spread intermittently dipped below zero and is down from more than 160 basis points a year ago for 1st time since 2019.

Bitcoin has broken through its’ near-term resistance level that had held the previous three times it was tested (red arrows).  The world’s most popular cryptocurrency is up roughly 8% over the past two days to more than $47,000.

Last week, crypto investment products saw their highest inflows of the year, as well as their eighth positive week of the past 10 weeks.

Stay tuned!

Signs of a coming recession?

Are we headed for a recession? There are a couple of indicators that have accurately signaled the last number of recessions.

The bond market is a bit of a mess.  Treasury bonds have been getting killed for the third day in a row, taking ten-year yields back above 2%. It is a bit unusual given we are in the middle of a war,  but clearly, for now anyways, inflation concerns are driving the bond market. If we’re going to get 10% inflation this year, then it stands to reason that the Fed will hike interest rates a lot—but will they? If they do raise rates, then the economy will get hit hard and that would most likely bring on a recession

Now most investors pay little attention to the bond market, but the bond market is telling us something. An inverted yield curve has often been a potential recession signal.  ‘Inverted’ means that yields on shorter-term bonds exceed those on longer-term bonds. The current 2-Year yield is 1.88%, precariously close to the 10-Year yield of 2.14%, with the ‘spread’ being only .26%, raising fears of an inversion. The reason for the fears is because a Treasury yield inversion has reliably signaled the last six recessions (recessions highlighted by vertical grey shaded areas).

The yield curve inverted in 2019 before the 2020 Covid-induced recession. It also did so in 2007 before the 2008 Global Financial Crisis/Great Recession. And it inverted in early 2000 right before the dot-com/tech stock meltdown.

Another reliable recession indicator is crude oil. The breakout of the Ukraine war has seen oil prices spike to their highest level since the 2008 bubble burst, more than doubling the price of one year ago. As the chart illustrates, crude oil price spikes have been a reliable recession signal for decades (recessions highlighted by vertical grey shaded areas).


With the Fed now committed to ending bond purchases while raising interest rates   a bear market and recession look potentially unavoidable. The bear market would be the first event to be confirmed but given Fed’s long-overdue policy tightening, we can expect a recession to be confirmed  eventually.

Stay tuned!


Market Notes

Market Charts – March 14/22

(From Yahoo finance)…Stocks erased earlier gains to close mostly lower, with investors looking ahead to the Federal Reserve’s next monetary policy decision later this week amid an ongoing war in Ukraine and soaring inflation.

The Dow Jones Industrial Average erased earlier gains of as many as 451 points to end little changed by market close. The Nasdaq dropped 2%, and S&P 500 also turned negative as technology stocks came under renewed pressure. US crude oil prices  dipped below $103 per barrel to a two-week low, while the average price for gas at the pump held near a record above $4.30 per gallon across the US.

Meanwhile, Chinese stocks remained volatile as concerns over regulatory pressures and Beijing’s relationship with Russia rose further. According to reports over the weekend citing U.S. officials, Russia had asked for military support from China for the war in Ukraine. American depository receipts of major Chinese companies including Alibaba ), Nio and Baidu  slid in intraday trading, building on steep year-to-date losses.


The S&P 500 was down again today, now testing the previous low.  While technically we could see a reaction rally soon, such a move would likely be short-lived.  The index is seeing a series of lower highs and lower lows and until it can break out of that trend, the path to least resistance is down.

The university of Michigan posted its preliminary results of its March’22 Consumer Sentiment Survey and that figure was 59.70. Every time the survey has been this low, other than in 2011, the US economy fell into a recession (grey shaded areas indicate a recession).

Chinese tech stocks continue to slide and are now down over 73% in the past year.

As we have been highlighting to our premium subscribers, oil was extremely oversold and in the last few days has giving up over 21% of its gains.

The US 10-year up 7% today, to 2.15%, the highest level since July’19. The 10-year tends to drive mortgage rates, meaning we will be seeing mortgages rising soon.

Thinking of investing in government bonds?  While bond yields have been rising lately,  the Real Return (nominal yield minus inflation) is negative for most countries.  Here is a chart we update each week for premium subscribers and it shows that only Brazil and Mexico bonds deliver a positive return, all the others on the chart yield negative returns.  Canadian bond holders are losing 2.97% per year, US bond holders are losing 5.75% and Spanish bond owners are losing 6.37% per year.  If you invest in these bonds, you are guaranteed to lose purchasing power each year.

If you do not have a hedging strategy, seriously consider subscribing to Trend Technical Trader (TTT) which offers numerous hedging options. Note also, TTT includes the Gold Technical Indicator (GTI).

To ensure all readers have access to this hedge service, we temporarily reduced the price by $300. Click button below to subscribe. It’s your money – take control!

Stay tuned!

Market Notes

Market Charts – March 8/22

(From Yahoo finance)…Concerns over the impact that the punitive measures countries and companies have taken against Russia have weighed on US equity markets. The S&P 500 dropped another 0.7% on Tuesday to bring its year-to-date losses to 12.5%. The Dow shed more than 0.5% to sink further into a correction, while the Nasdaq Composite extended losses after sliding into a bear market earlier this week.

President Joe Biden’s formal announcement that the US would be banning Russian imports of crude oil and other energy products confirmed speculation from earlier this week, and sent oil prices up to hold near 14-year highs. West Texas intermediate crude held well above $120 per barrel, and Brent crude hovered around $130 per barrel. Gas prices at the pump also spiked to a fresh high across the US.


The Nasdaq is now in a bear market, having dropped over 20% from its November high. While we could see a bounce soon, be very cautious jumping back in with both feet.  Although all corrections become buying opportunities, you want to make sure the bottom is in before getting aggressive. If you do not have an exit or hedging strategy, serious think about subscribing to our Technical Trader service. See special offer at bottom of this page.

Gold had another great day, up over 47.00 to close the session at 2043.30. As noted yesterday, gold is now technically overbought, so a pullback soon would be expected, as soon as we get some positive news out of Ukraine.

With the US and allies banning the import of Russian  oil, the price of oil moved higher again today, reaching almost 130.00 intra-day before settling at 123.70. At the bottom of the chart we can see that oil is extremely overbought technically.

If you do not have a hedging strategy, seriously consider subscribing to Trend Technical Trader (TTT) which offers numerous hedging options. Note also, TTT includes the Gold Technical Indicator (GTI).

To ensure all readers have access to this hedge service, we temporarily reduced the price by $300. Click button below to subscribe. It’s your money – take control!

Stay tuned!

Market Notes

Market Charts – March 7/22

Stocks extended declines on Monday and oil prices soared as investors nervously considered the potential for even higher inflation and greater global economic damage from Russia’s war in Ukraine and sanctions that have ensued.

The S&P 500 closed down nearly 3% at 4,200.89, its worst day in more than a year, while the Dow fell 2.4% to 32,813.56. The Nasdaq Composite dropped 3.62% at 12,380.96 clocking in its worst day in more than a month, and formally entered a bear market after dropping more than 20% from its recent record high.


The S&P 500 has now dropped below the previous near-term support level and is testing our original call for support at 4200.

Gold has had a great run but is now getting technically overbought (see RSI at bottom of chart). Watch for a potential near-term pullback with support at 1885, then 1850.

Based on seasonality, gold is now entering negative period that typically runs to mid-late March

While investor’s focus has been understandably on the Russian invasion of Ukraine, there is another problem that is creeping up that most are not aware of…a recession. One of the best indicators that a recession is coming is the yield curve (the 10-year yield – 2-year yield).

On the chart below, inverted yield curves are identified by red arrows and we can see that when the yield curve inverts (10-year yield lower than 2-year yield) a recession always follows (grey shaded area).  As we can see, the yield curve has been heading lower since May of 2021 and if the Fed raises rates at their meeting next week, the yield curve could be inverted in the next few months.  And that means  a recession should follow.


Hopefully, you have taken our advise and established exit or hedging strategies. If you do not have a hedging strategy, seriously consider subscribing to Trend Technical Trader (TTT) which offers numerous hedging options. Note also, TTT includes the Gold Technical Indicator (GTI).

To ensure all readers have access to this hedge service, we temporarily reduced the price by $300. Click button below to subscribe. It’s your money – take control!

Stay tuned!

Market Notes

Market Charts – March 3/22

(From Yahoo finance)…The S&P 500 index fell 0.5% during the regular trading day as technology and growth stocks came under renewed pressure, and the Nasdaq Composite dropped nearly 1.6%. Treasury yields steadied after sliding earlier this week, and the benchmark 10-year yield hovered above 1.8%.

A fresh set of economic data due for release Friday morning is expected to reaffirm to investors that the U.S. economy has recovered sufficiently to allow monetary policymakers to ease their crisis-era supports. The Labor Department’s February jobs report is expected to show a fourteenth consecutive month of payroll gains, with jobs rising by more than 400,000 and the unemployment rate edging lower to 3.9% — or the lowest since February 2020 before the pandemic. Such a result would mirror the much better-than-expected private payrolls data out from ADP earlier this week.


Commodities have been hot as reflected by this chart of the Reuters/Jeffries CRB index.  Note at bottom of chart, based on RSI, commodities are technically overbought.

Russian stocks are being hit hard and the iShares Russian ETF was down another 25% today, and is now down over 80% since the invasion into Ukraine.  Note at the bottom of the chart, this ETF is extremely oversold at this point. That doesn’t mean it can’t drop lower, but suggests we should see a bounce soon. If looking to make a speculative trade here, we suggest waiting until you see a move off the floor.

Crude oil prices briefly surged to their highest levels since 2008 Thursday morning before pulling back a bit. Still, at about $110 a barrel, there are growing concerns that skyrocketing energy prices could lead to a severe economic pullback in the US and around the globe. The following chart shows the oil cycle where the cure for high oil prices is high oil prices.  As oil prices keep rising, it starts to act like a tax on consumers, ultimately affecting demand.

A worldwide recession would seriously hit demand for oil products.

Stay tuned!

Market Notes

Market Charts – March 2/22

Investor focus turned to Powell’s testimony before the House Financial Services Committee on Wednesday, during which the Fed chief said explicitly that he would back a quarter-point interest rate hike following the Fed’s March meeting later this month. Powell left open the possibility that the Fed would raise interest rates and tighten more aggressively later this year, however, given the current, persistent inflationary pressures rippling across an otherwise solid US economy.


Something to keep our eye on. The Nasdaq 100 has produced a bearish ‘death cross’ today for first time in ~2 years. A ‘death cross’ occurs when the 50-DMA short-term trend tracker (red line) , crosses below 200-DMA , longer-term trend (blue line). Many chart watchers view a death cross as the point where pullbacks often evolve into much deeper downtrends.

Oil spiked again as Russia-Ukraine war fueled panic buying and  OPEC+ sticks to plan for small April output rise despite surging prices. Oil hit in intra-day high of 112.51 before closing the session at 110.60.

Treasury yields also rebounded as investors slowed a flight to safe havens, and the benchmark 10-year yield hovered just below 1.9%.

Stay tuned!

Market Notes

Market Charts – March 1/22

(From CNN)… March is looking a lot like January and February on Wall Street. That’s not good news for investors.

The Dow fell nearly 600 points Tuesday, or 1.8%, one day after stocks capped off their second straight month of declines to start the year. The Dow managed to finish off its lows of the day though.

The Nasdaq and S&P 500 were also hit hard, with each index falling about 1.6%.

Rising oil prices, which spiked nearly 10% Tuesday to above $104 a barrel for the first time in more than seven years, are hurting sentiment. So is the rapid drop in long-term bond yields. The 10-year Treasury rate fell to about 1.7%, the lowest level since early January.


Oil has been parabolic, up another 8.03% today.  OPEC meets tomorrow and it will be interesting to see if they agree to raise production. Another option is with Iran and if sanctions are lifted, they  could add an additional 1.3 million b/d to supply.

Gold has exploded due to geopolitical events that suggest investors are not just nervous about what Putin is doing, but also whether the Western leaders are a match for him. The real concern here is that they back Putin into a corner where he feels he needs to save face and then we end of with a much bigger issue, such as a world war.

Gold was up another 43.10 and is now testing the key resistance established in November and December 2020 (red arrows). If gold can break through that resistance level, then we have a good shot of testing the all-time closing high of 2069 set in August 2020.

While gold was up 2.27% today, silver more than doubled that rise, up 4.82%.

The Canadian TSX continues to fare better than most global markets, given its heavy commodity and energy exposure.

US financials were the biggest losers today with the XLF fund down 3.69% for the day, its worst performance since June 2020.

Hopefully, you have taken our advise and established exit or hedging strategies. If you do not have a hedging strategy, seriously consider subscribing to Trend Technical Trader (TTT) which offers numerous hedging options. Note also, TTT includes the Gold Technical Indicator (GTI).

To ensure all readers have access to this hedge service, we temporarily reduced the price by $300. Click button below to subscribe. It’s your money – take control!

Stay tuned!