Posts by The Trend Letter

Market Notes

Market Charts – February 10/22

Stocks sold off and yields climbed after the Bureau of Labor Statistics’ January Consumer Price Index (CPI) showed the biggest annual jump in inflation since 1982.

The surging 7.5% jump in prices escalated calls for the Federal Reserve to raise interest rates more aggressively than previously expected and begin rolling assets off its balance sheet, in moves that would curb liquidity in the financial system and dampen soaring consumer demand and prices. St. Louis Federal Reserve President James Bullard told Bloomberg News on Thursday he wanted to see interest rates be raised by a full percentage by July and start the Fed’s balance sheet run-off process in the second quarter, in one of the most hawkish paths so far telegraphed by a Fed official.

On Tuesday, for the S&P 500 we said ‘Watch the 4600 level as near-term resistance as our model sees this as a key short-term resistance level and if we can’t push past this level we could see the market start to break down with a potential near-term low in the next 6 weeks.’

So far that 4600 has held, so the scenario laid out on Tuesday is still very valid.

This is a chart of the VanEck Semiconductor ETF and it is suggesting that we are at a potential key inflection point. As we can see, this ETF is in a rising wedge pattern where both the upper level (red lines) and lower level (green lines) have acted a key short-term resistance and support levels. As the wedge narrows, one of these levels is going to give way. We are now testing the lower level, and if it breaks then the high today may have been the top for a few weeks at least.

On the other hand, if SMH bounces off this support level, then we could see one more test of the upper level of the wedge.

The Canadian TSX has been one of the best performing indexes in the world lately and is within a hair of a new all-time high.

Stay tuned!

Again, if the near-term high is in, seriously think about subscribing to our hedging service Trend Technical Trader. We are offering it at a $300 discount so all investors can have access to these great hedging strategies.

Stay tuned!

Market Notes

Market Charts – February 8/22

The  S&P 500 was up ~38 points today, but the markets are still quite nervous. Watch the 4600 level as near-term resistance as our model sees this as a key short-term resistance level and if we can’t push past this level  we could see the market start to break down with a potential near-term low in the next 6 weeks.

Oil has been on an absolute tear in the last year+ but is now hitting some strong technical resistance. The uptrend line (red diagonal)  has shown to be strong resistance the last three times oil challenged it. Is this a near-term top? It certainly could be.  If so, the first level of support would be 85.00, and then there is a big gap down to 65.00. Any invasion of Ukraine by Russia would negate any correction and most likely give oil a push higher, although much of a potential Russian invasion is already priced in.

The yield on the benchmark 10-year Treasury is approaching 2%. January 2020 was the last time we saw the 10-year Treasury yields were above 2%. There has  been over $8 trillion of new debt added (government & corporations) since the pandemic. If the 10-year U.S. Treasury yield hits 2%, with the Fed looking to raise rate, investors are likely to get very nervous.

If you are overweight in equities seriously consider subscribing to our premier hedging service, Trend Technical Trader. To ensure all readers have access to this hedge service, we are reducing the price by $300. Click button below to subscribe. It’s your money – take control!

Stay tuned!

Market Notes

Market Charts – February 7/22

Stock turned lower to close a choppy session at the start of another busy week for corporate earnings and fresh economic data, as investors continue to assess the Federal Reserve’s path forward for monetary policy.

The S&P 500 declined after posting its best weekly rise of the year last week. The Dow traded little changed, and the Nasdaq underperformed as technology shares fell anew.

Looking at the S&P 500 chart, we can see that it is in a near-term downtrend channel and needs to break above near-term resistance at 4600 to decisively break out of that channel. Ultimately, the S&P 500 needs to break through to a new high to confirm the resumption of the bull market. Near-term support sits at 4300 and key support is the 4200 level. A break below that 4200 level opens the door for a significant decline.

Tech stocks were down led by Meta (Facebook) again. Meta is now down over 41% from its September high.  At the bottom of the chart, we can see that based on RSI, Meta is now oversold. If you are looking to dip your toe in here understand the this is like a falling knife, you need to wait till you see it start to turn higher.

Gold was up 14.00 today, and is slowly trying to work its way to test near-term resistance of 1830, and then key support at 1870. We are in a seasonal period of strength for gold, but it has had a tough time trying to break out of this wedge pattern it has been in since last May.

Note: All investors should have a hedging or exit strategy. If you do not have a hedging strategy seriously consider subscribing to Trend Technical Trader, the best hedging service we know of. To ensure all readers have access to this hedge service, we are reducing the price by $300. Click button below to subscribe. It’s your money – take control!

Stay tuned!

Market Notes

Market Charts – February 2/22

The S&P 500 managed to clock in another solid gain today, its fourth consecutive after the big sell-off in January. Better than expected earnings from Alphabet were the main driving force for today’s gains, but disappointing jobs data and a big earnings miss after the close from Meta (previously Facebook) could cause a setback tomorrow.

The CBOE put/call ratio tells us what traders are doing with their money and can be a contrarian indicator. The ratio is quite volatile, so we use a 10-DMA to smooth it out (orange line). When this ratio is low it tells us that investors are bullish with a risk-on sentiment, and when it rises, it tells us investors are becoming nervous, more risk averse.

As you can see, it has climbed to a 15-month high, in spite of the recent sharp rally, which suggests that option buyers don’t trust the rally. But given we see it as a contrarian indicator, it suggests that this rally could last longer than most anticipate.

The Canadian TSX has been one of the best performing indexes and as we can see, it has broken through its 50-DMA (red wavy line) and is not too far off its all-time highs.

Stay tuned!


Market Notes

Market Charts – February 1/22

With all the chatter about inflation it is interesting that the Atlanta Fed’s first two forecasts for 2022 call for 0.1% growth, far below what mainstream economists are saying.  The Atlanta Fed is unique in that their forecasting method only uses available data, and not projections for future data used  by most other economic forecasts.

The S&P 500 has rallied off the last Friday’s low so the question is, was that the low or are we just seeing a rally off  an oversold bear trend? Typically, after a small correction a retracement of 50%-61% would be normal. The wavy red line on the chart is the 50-DMA and if the S&P 500 can push past that, which also happens to be very close to a 61% retracement, then the bull market could continue. However, if that level holds and the market turns south again, we are likely to see new lows.

Gold has been in a wedge pattern since August 2020. It has been making painfully slow progress this week but progress it has been. Our models show we could see a rally here over the next few weeks

Stay tuned!


Market Notes

Market Charts – January 31/22

Since 1950, the market followed its January performance 85% of the time. As we can see on the chart, this January is a down month,  suggesting the year will be a down year.  But interestingly, in the previous two years the January performances were down, but the performance for the rest of the year were positive. So there are no guarantees, but it is one trend to keep an eye on, one of many we update our subscribers on throughout the year.

As we told subscribers in Sunday’s report the S&P 500 was technically oversold, so a short-term rally was to be expected. We need to keep a keen eye on the 4300 and 4200 support levels for the S&P 500 (green horizontal lines). If we do see a test of 4200, we should then see a rally to the 4400 level.

Gold has been very choppy, having a tough time due mainly to the strength in the $US. We are in a strong seasonal period for gold, but it cannot gain any tractions with that strong $US. We are still bullish, but we need to see it break out of its wedge pattern to the upside.

Stay tuned!

Market Notes

Market Charts – January 27/22

The market continues to struggle making any gains and seems to still be very concerned with the US Fed plans to start tightening and raising rates. We continue to see wide volatility, with the market unable to hold intra-day gains, nor does it want to close on the lows.  Intra-day we are seeing investors selling the high and buying the low, each with little conviction.

The S&P 500 is approaching our initial near-term support at 4300, but the key support is at 4200.  Note at bottom of chart the Relative Strength Index (RSI) is at 24.32 and any reading below 30 is considered oversold.

Note: Trend Letter subscribers should keep an eye out for a new BUY Alert, possibly tomorrow. 

With expectations of the Fed raising rates in March, the $USD has surged.

We are in a seasonally strong period for gold, but with the $USD surging, it has been a strong headwind for gold, which was down down 34.70 today.  Watch the 1760 level (horizontal green line) it is key support for gold.

Note: All investors should have a hedging or exit strategy. If you do not have a hedging strategy for if /when the markets resume their steep sell off after a brief rally, seriously consider subscribing to Trend Technical Trader, the best hedging service we know of. To ensure all readers have access to this hedge service, we are reducing the price by $300. Click button below to subscribe. It’s your money – take control!

Stay tuned!

Market Notes

Market Charts – January 25/22

Equity markets had another down day, unable to rally above yesterday’s close, suggesting the near-term bottom is not likely in just yet. Tomorrow is the Fed meeting where Powell will take questions from the press and he will likely try to calm the markets, but must also address the inflation problem. The Fed is really between a rock and a hard place.

Most Americans do not own stocks other than those who have pension funds, so they do not care if the stock markets are getting hammered, but they care very much about how their food and gas prices are rising.  So their priority is for the Fed to fight inflation, not save the stock markets

The  markets have been extremely volatile the last two days, especially yesterday where we saw major swings, with the S&P 500 recovering from a loss of 3.98% and finished the day positive. That was only the 3rd time in history that has happened, and the previous two times happened just before the financial crisis on 2008.  So be warned, as this suggests there will be more losses to come.

We do expect that we will see a bounce very soon, and while this bounce could be a short-term buying opportunity, do understand that the risk for any rally being just a ‘dead cat bounce’ are quite strong.

One sector we are watching for a rally is the Semiconductors. They are been hit hard and are approaching what our models target as a potential short-term Buy target just above the 430 level.  If you are interested in making this trade, do not buy it until you see that 430 support level hold. And if you do buy this range, be sure to set a SELL Stop to exit the trade if/when it turns back down. Trend Disruptor subscribers will be sent an alert if this trade is triggered.

If you do not have a hedging strategy for if /when the markets resume their steep sell off after a brief rally, seriously consider subscribing to Trend Technical Trader, the best hedging service we know of. To ensure all readers have access to this hedge service, we are reducing the price by $300. Click button below to subscribe.

Stay tuned!

Market Notes

Market Charts – January 24/22

In our last Trend Letter, we noted that the key support level for the S&P 500 was 4200 and if it hit that level, we could expect a solid rally.  Today, the S&P 500 dropped close to that 4200 level at 4222, before rallying to close the day at 4410.  Watch the 4435 (first red dashed line)  level as initial resistance, which represents at 38% retracement to the early January high.  Investors must be careful as we typically see that after an initial bounce, the low often gets re-tested.

The Fed meeting is on Wednesday and depending on the decision from that meeting there is still room for plenty of volatility. There is still risk of lower lows.

Stay tuned!


Market Notes

Today’s charts – December 2/21

From MarketWatch…

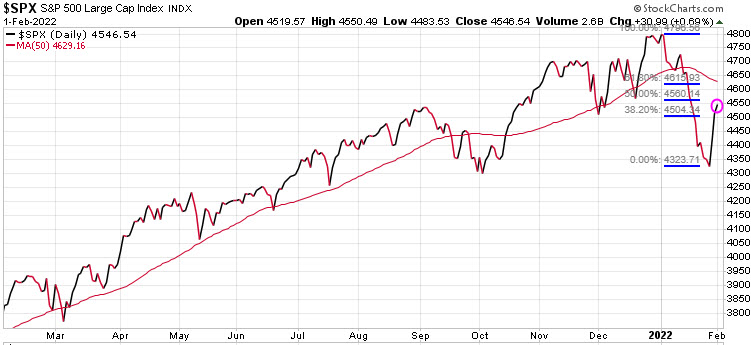
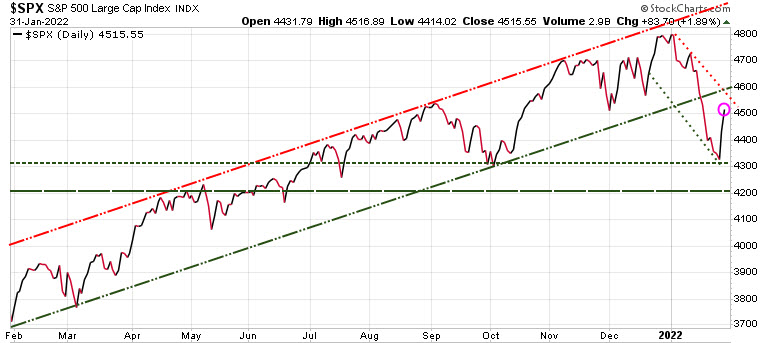
Stocks finished higher for the first time in three sessions but for some bulls the downtrend may feel longer, amid a slide characterized at times by stomach-churning swings and white-knuckle climbs higher.

Investors have been on edge because the omicron-inspired jitters have resulted in some erosion of upward trend lines for the main stock benchmarks and bears wanted to see if another shoe would drop on Thursday to help solidify the downtrend.

“The bouncing in the markets due to incoming news has slowed, with markets led by cyclicals and the recovery trade,” wrote Rob Haworth, senior vice president and senior investment strategist, at U.S. Bank Wealth Management, in emailed comments to MarketWatch.

On Thursday, health officials confirmed another case, a Minnesota resident who had recently traveled to New York City for a convention, experienced mild symptoms and has since recovered. The new case makes it likely that further infections from omicron in the New York area.

“The hope is that Omicron is more benign than expected and any shutdowns will be limited in time and scope,” the UBS strategist wrote.

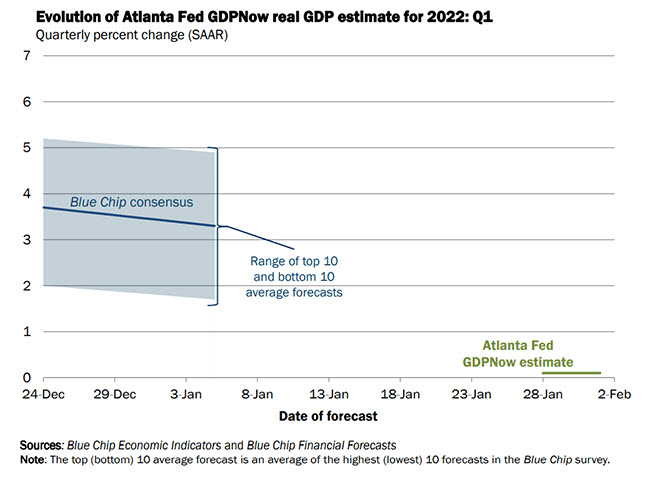
Note: Tomorrow we get the non farm payrolls, a report that tends to move markets, both up and down.


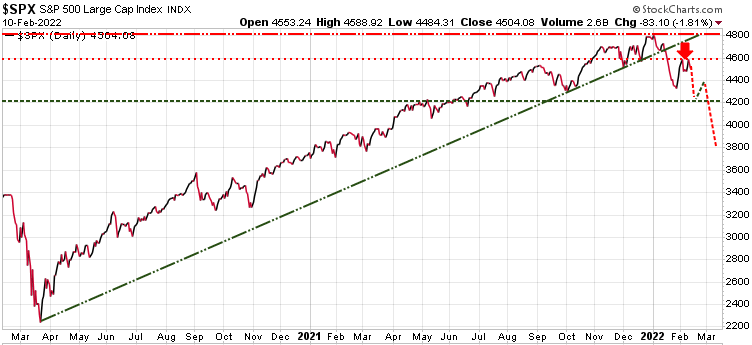
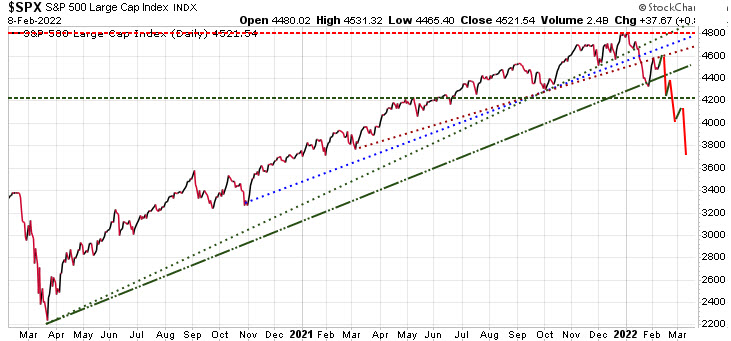
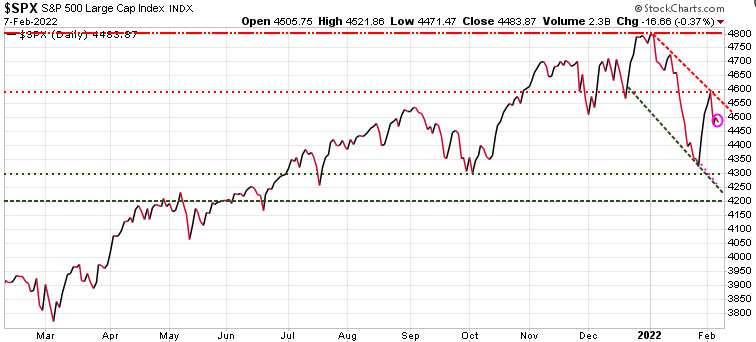
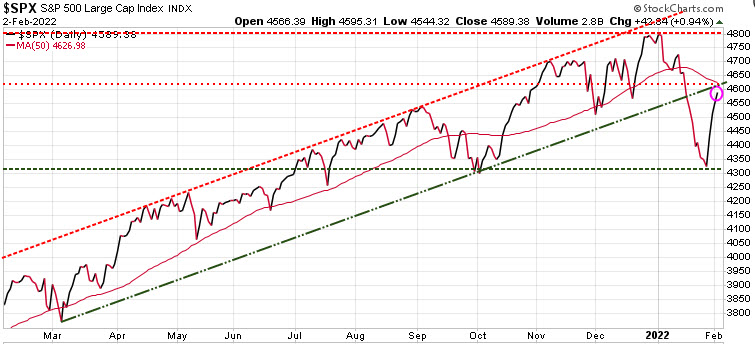
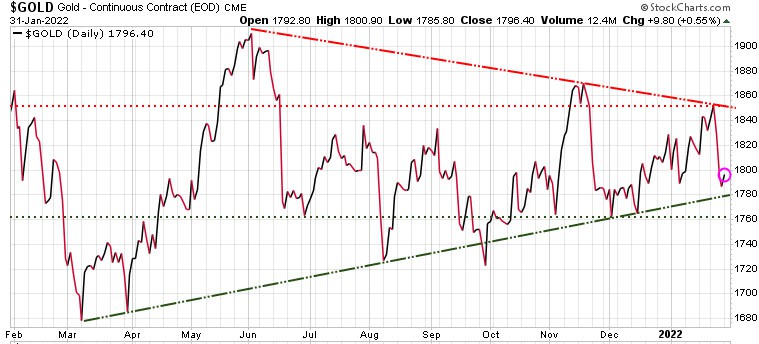
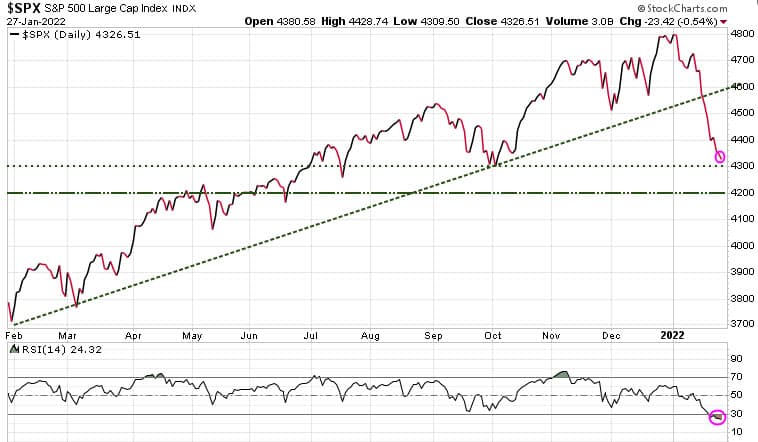
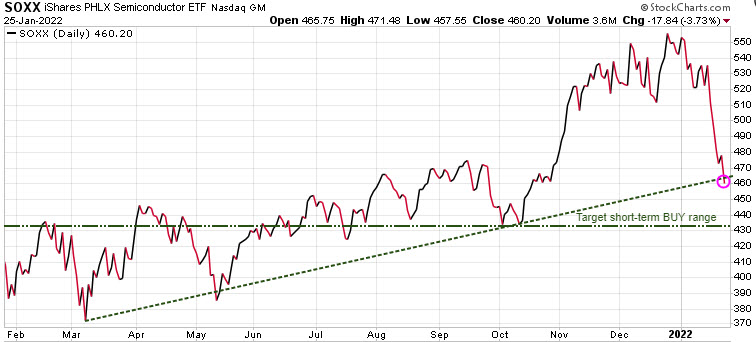
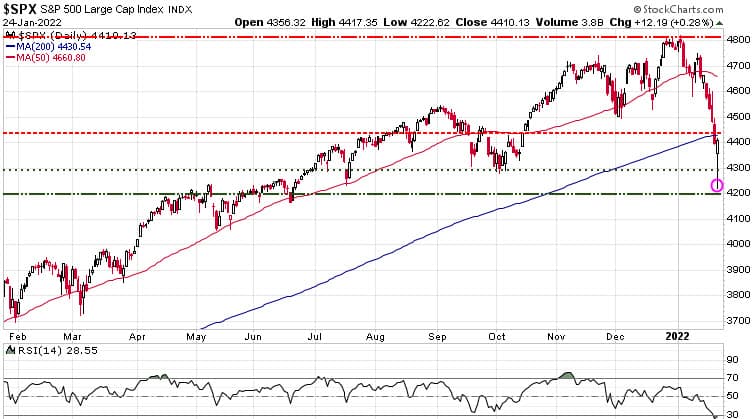
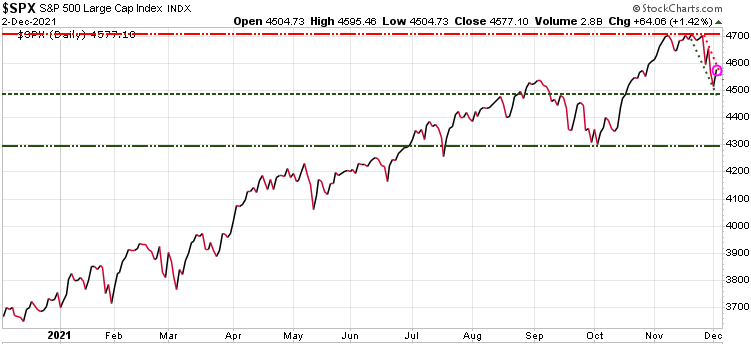
The S&P 500 briefly touched our near-term support level at 4495, but was able to bounce off that level today. If that support level does not hold, then the next support is at 4295, and a break below that level would signal a deeper correction is likely.

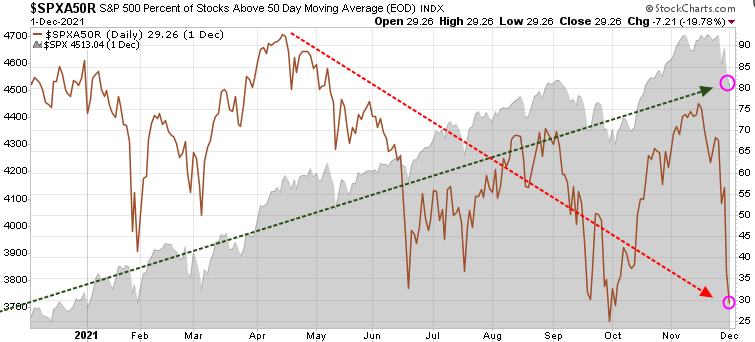
Here is an ominous chart, showing that the percent of stocks that are trading above their 50-DMA has plummeted to less than 30%. This tells us that while the S&P 500 has been in a long uptrend, the percentage of stocks participating in that bullish move has been declining since last April (red arrow).

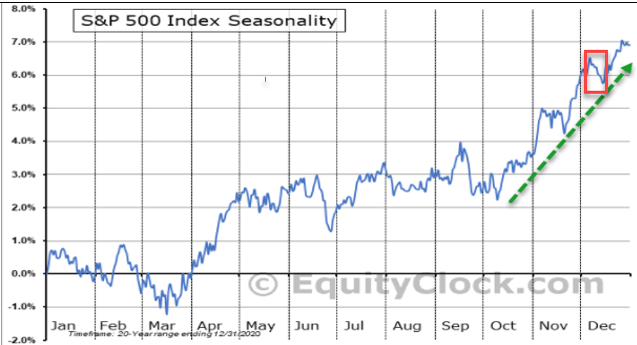
Based on seasonality, we typically get a ‘Santa Claus Rally’ from the last couple of weeks in December into early January. But all investors need to understand that we are in tax-loss selling season and that usually creates a correction in early November (red box) before the rally to end the year. .

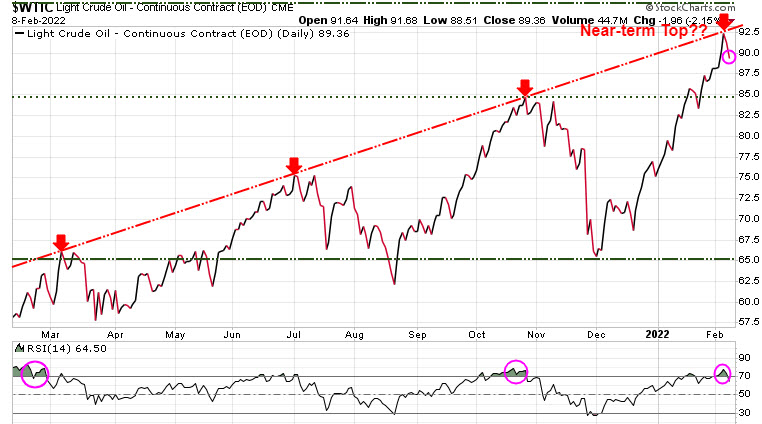
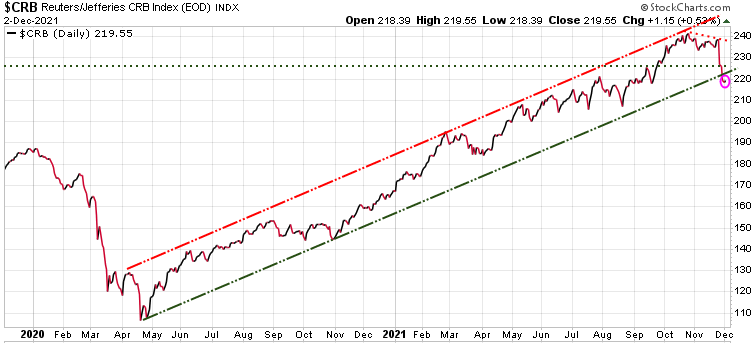
The CRB commodity index had a phenomenal run from 108 in April’20 to 243 in late October’21. But since that October high, the CRB has been rolling over with lower highs and lower lows, and then the huge gap down this past week, knocking it out of its uptrend channel.

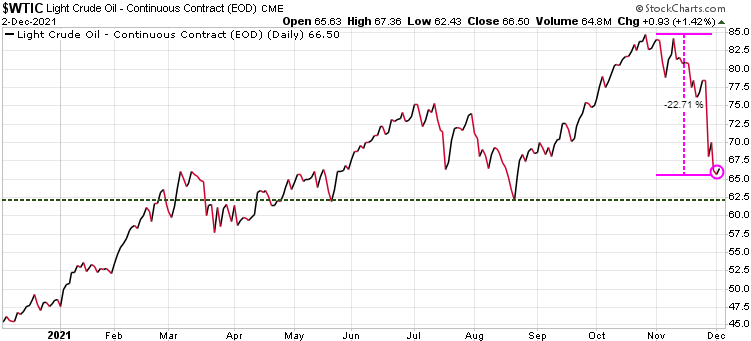
Oil was up .93 today but still down close to 23% since the high in late October.

Every Sunday evening we give subscribers full updates on equities, bonds, currencies, commodities, and precious metals. If you are not yet a subscriber, the Black Friday sale is up until this weekend, offering some excellent prices to our services.

Our Black Friday specials are up until the end of this week. See below for some great Special Offers on all our services.

 Trend Letter:
Since start-up in 2002 Trend Letter has provided investors with a great track record, giving exceptionally accurate information about where the markets are going, and it has explained in clear, concise language the reasons why. Using unique and comprehensive tools, Trend Letter gives investors a true edge in understanding current market conditions and shows investors how to generate and retain wealth in today’s climate of extreme market volatility.

A weekly publication covering global bonds, currencies, equities, commodities, & precious metals. Over the 20 years Trend Letter has been published, it has achieved an incredible average return of 65% on its closed trades.

Timer Digest says“Trend Letter has been a Timer Digest top performer in our Bond and Gold categories, along with competitive performance for the intermediate-term Stock category.”


Technical Trader:
Trend Technical Trader (TTT) is a premier trading service, designed to profit in both up and down markets. Included is our proprietary Gold Technical Indicator (GTI).

TTT had another excellent year in 2020 averaging +27.3% per closed trade with an average holding time of 9.5 weeks, or +149% annualized overall.

Over the past 5 years TTT’s closed trades have averaged +40% annualized.


Trend Disruptors:
Disruptive technology trends will propel our future and the reality is that no industry will go untouched by this digital transformation. At the root of this transformation is the blurring of boundaries between the physical and virtual worlds. As digital business integrates these worlds through emerging and strategic technologies, entirely new business models are created.

Trend Disruptors is a service for investors seeking to invest in advanced, often unproven technology stocks on the cheap, with the objective to sell them when masses finally catch on. Covering Artificial Intelligence (AI), Virtual Reality (VR), Augmented Reality (AR), 5G, Quantum Computing & many more.

Trend Disruptors has realized average annualized gains of 178% over its 3 years of service.

Special Offers

ServiceRegular PriceSpecial PriceSavingSubscribe
Trend Letter$599.95$349.95$250Trend Letter $349.95
Technical Trader$649.95$349.95$300 Trend Technical Trader $349.95
Trend Disruptors$599.95$349.95$250 Trend Disruptors $349.95
Better Deals
Trend Letter + Technical Trader$1,249.90$549.95$699.95 Trend Letter & Technical Trader $549.95
Trend Letter + Trend Disruptors$1,199.90$549.95$649.95 Trend Letter & Trend Disruptors $549.95
Technical Trader + Trend Disruptors$1,249.90$549.95$699.95 Technical Trader & Trend Disruptors $549.95
Best Deal
Trend Suite: Trend Letter + Technical Trader + Trend Disruptors$1,849.85$649.95$1,199.90 Trend Suite: TL + TTT + TD $649.95

.