Market Charts – April 6/22
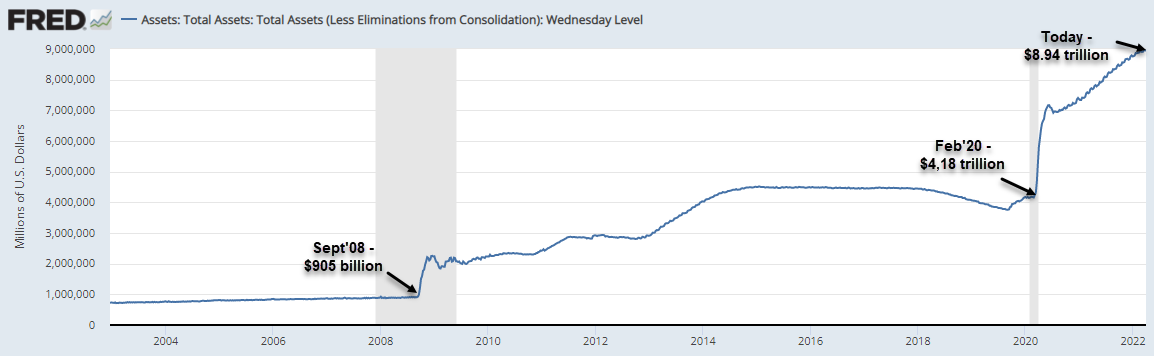
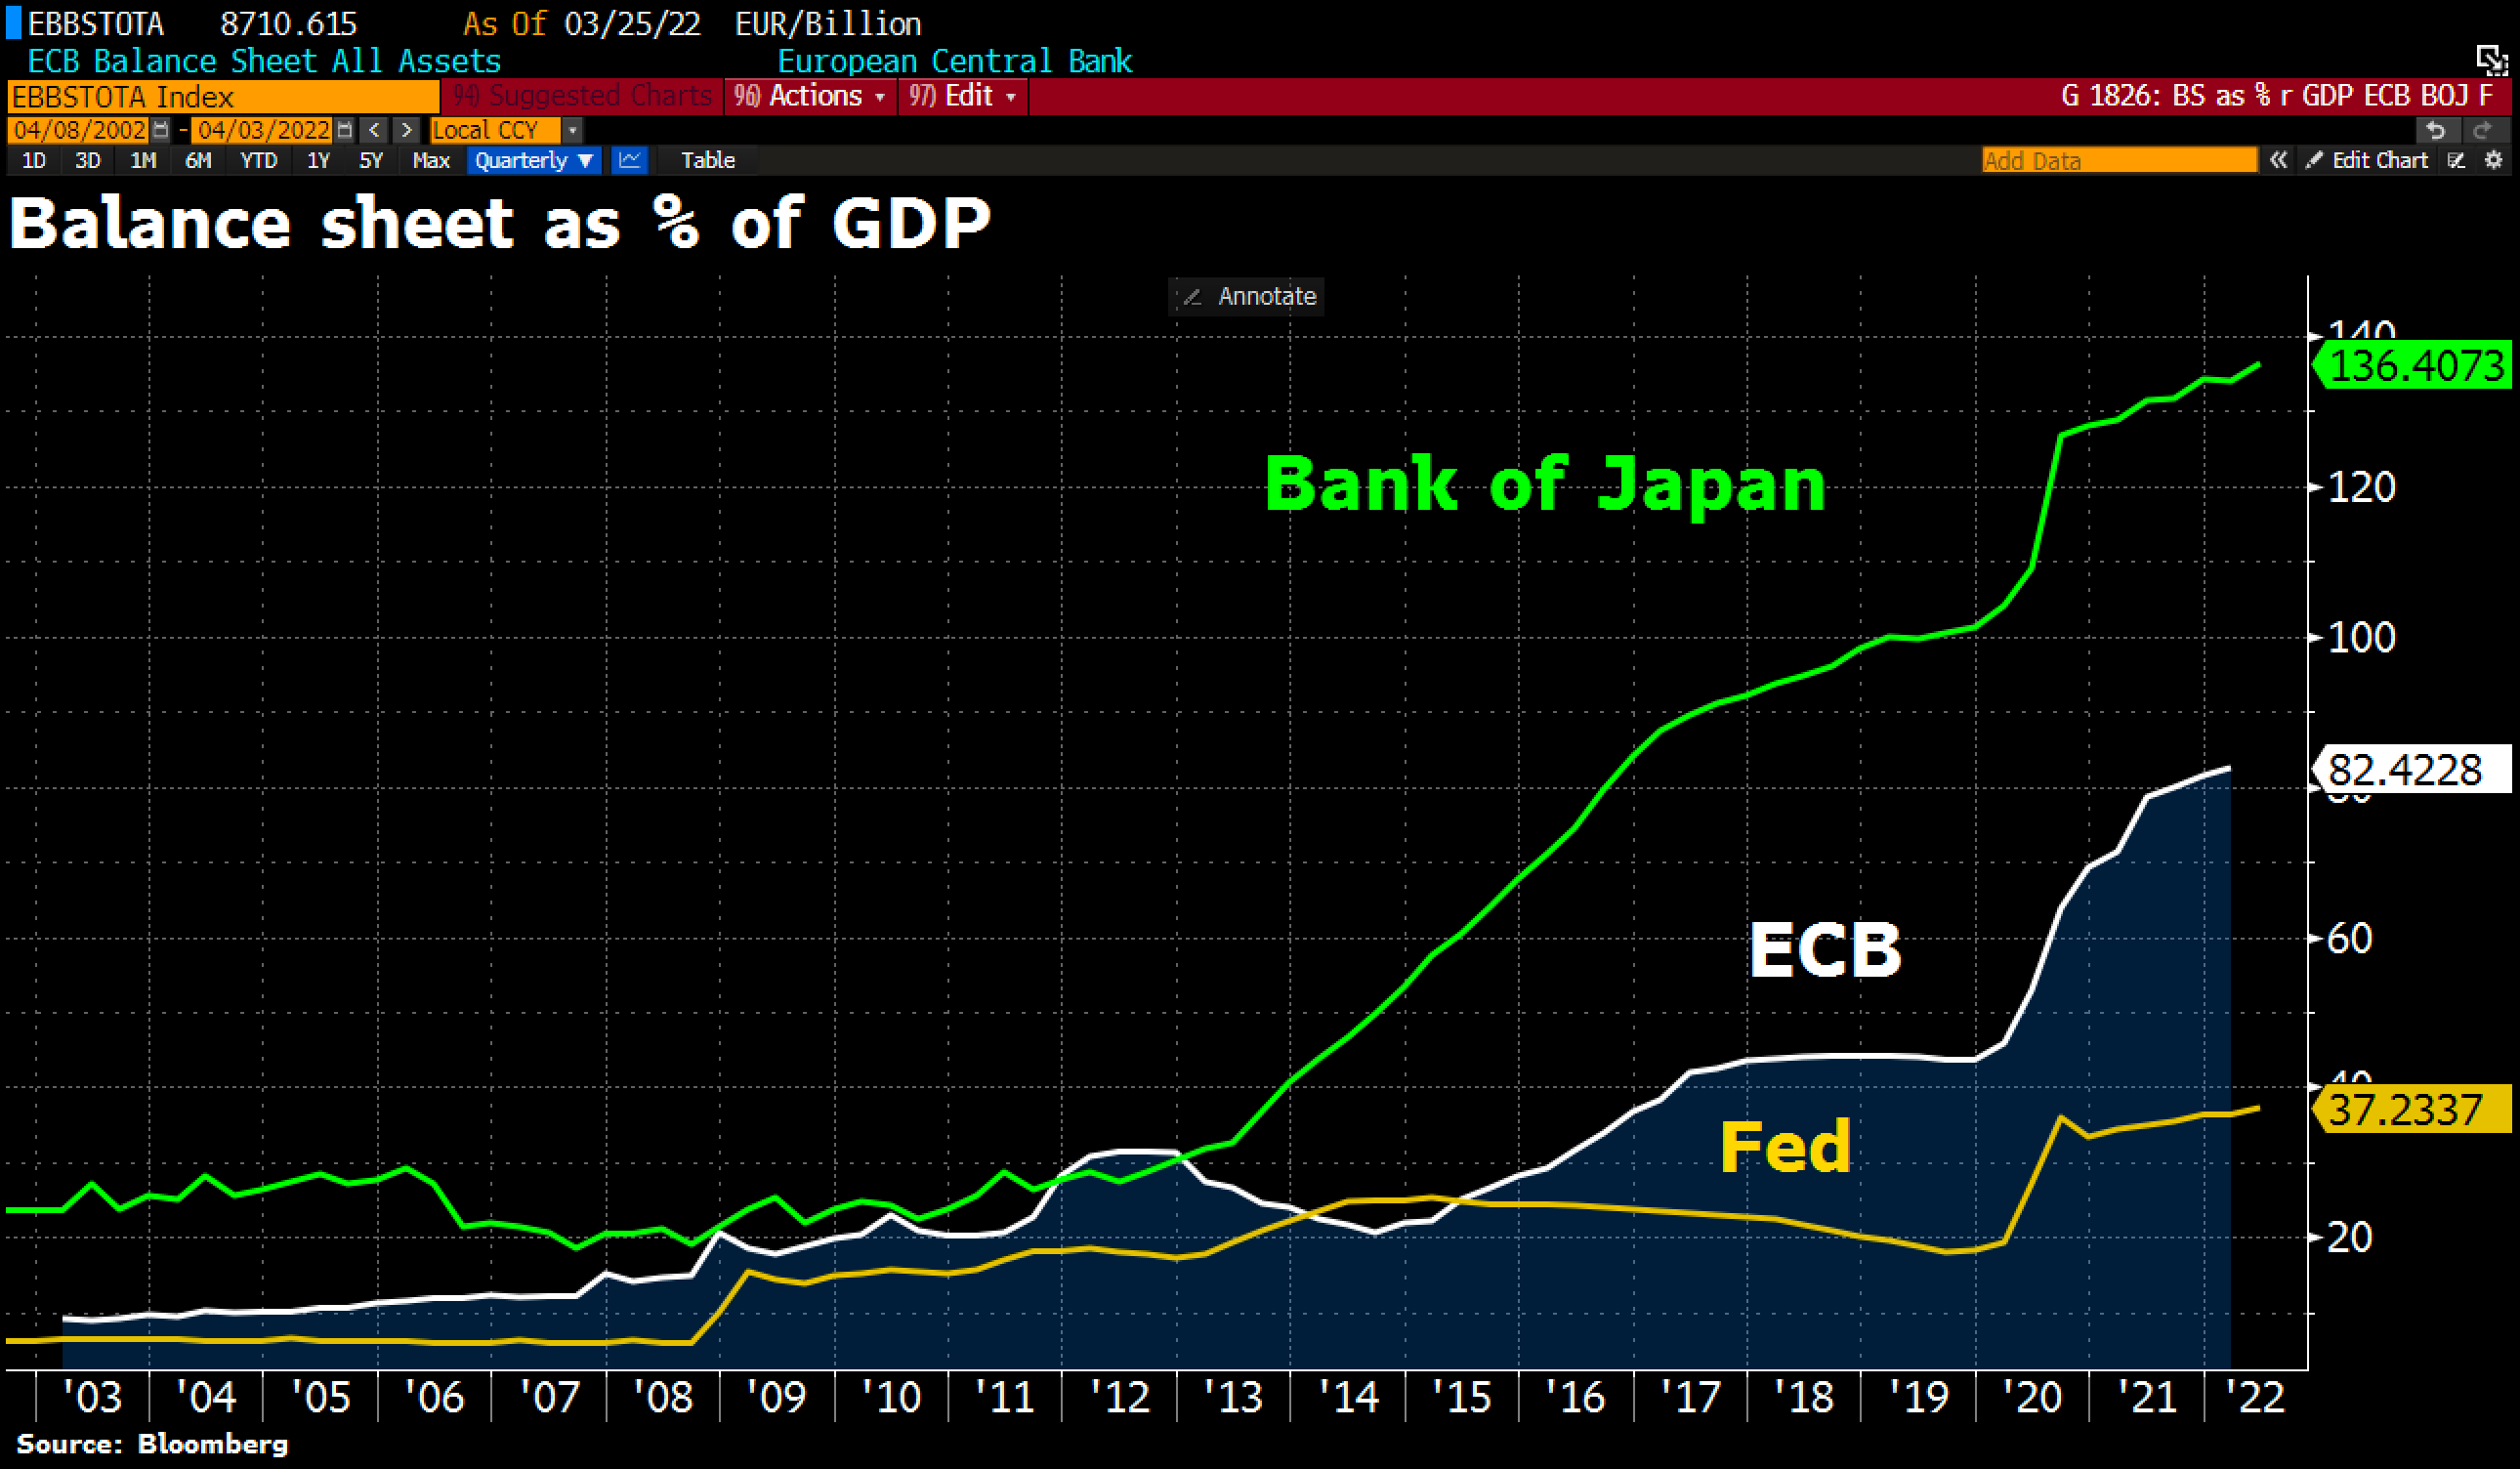
(From Yahoo Finance)… Conversations detailed in the March 15-16 Fed meeting minutes released Wednesday suggested policymakers will soon begin to unwind the central bank’s $9 trillion balance sheet, including $4 trillion in asset purchases amassed to calm markets after the pandemic hit in early 2020. The minutes also indicated many participants in the Federal Open Market Committee (FOMC) “would have preferred a 50 basis point increase” in benchmark interest rates in March, when the Fed raised rates for the first time since 2018.
Other headwinds investors have to continue to navigate are developments in the Russia-Ukraine war. The United States imposed another round of sanctions on Wednesday that included a ban on American investments in Russia.
Meanwhile, testifying before the House Financial Services committee on Wednesday, US Treasury Secretary Janet Yellen warned that Russia’s war in Ukraine will stoke ‘enormous economic repercussions around the world,’ including disruptions to the flow of food and energy.
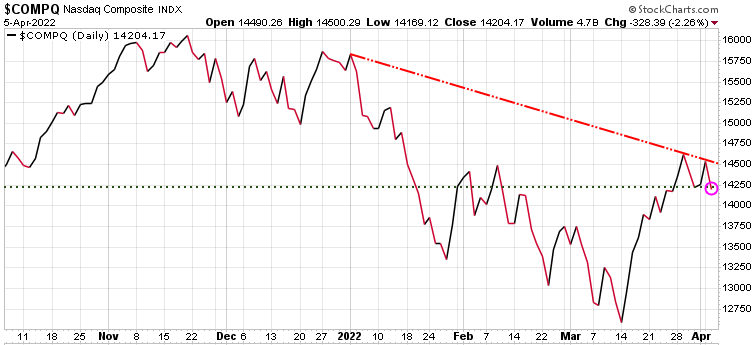
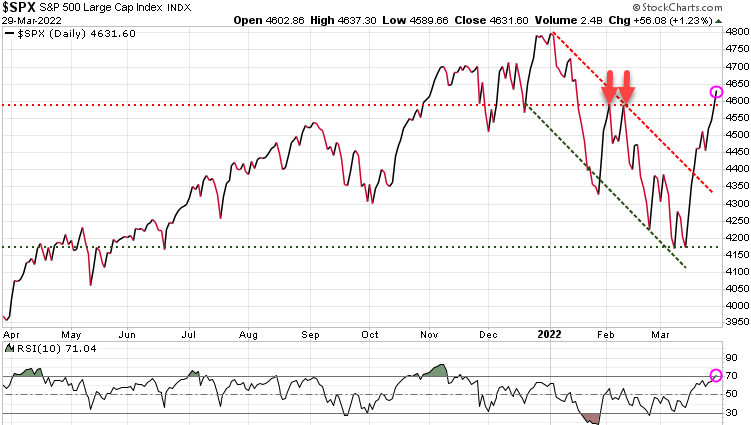
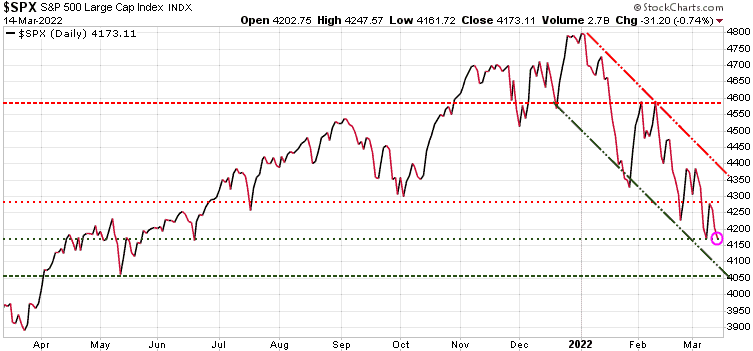
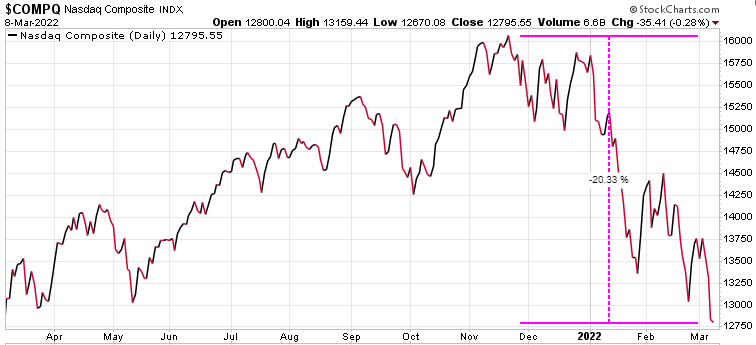
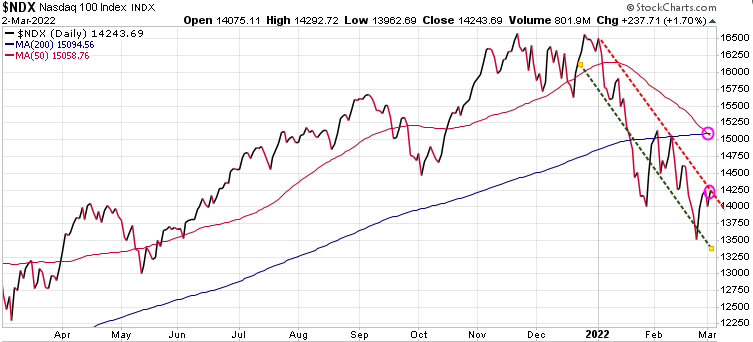
This news extended the stock market declines from Tuesday.
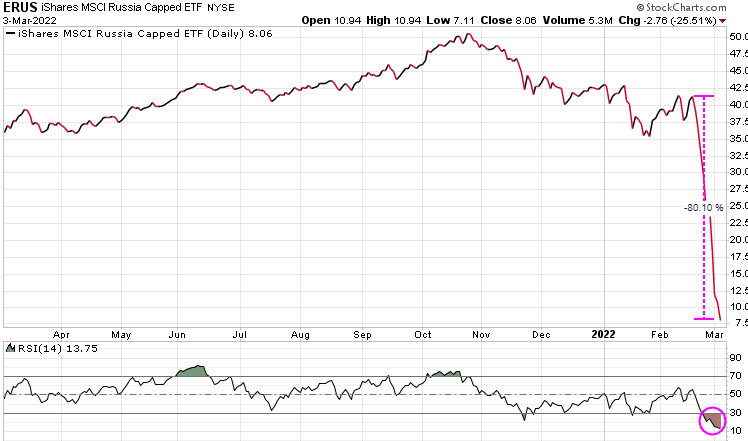
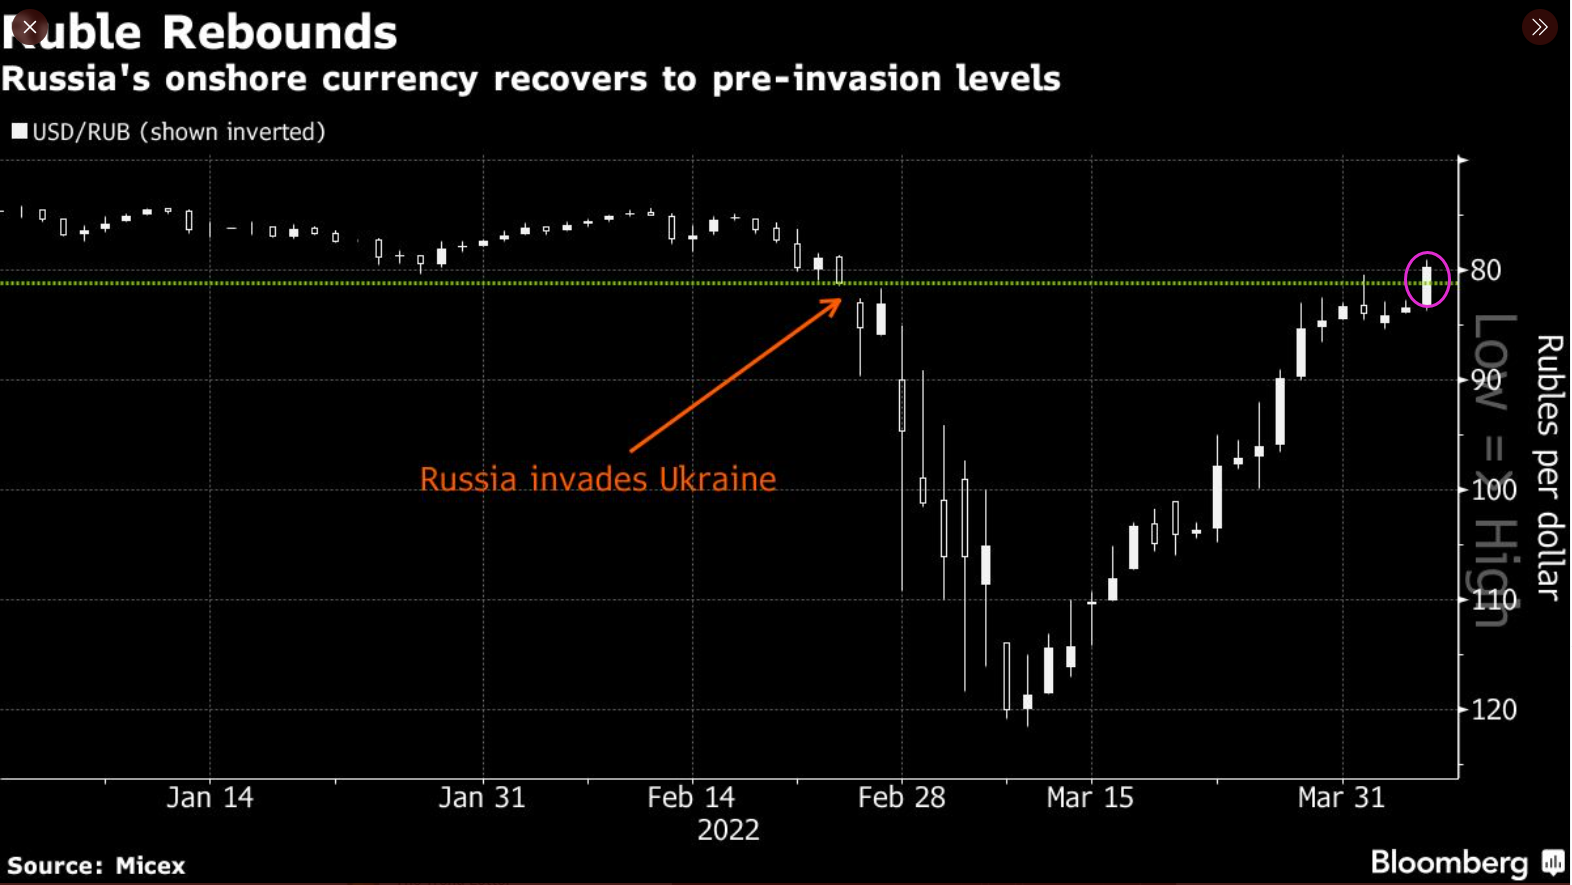
The Russian Ruble has erased all of its invasion losses, bucking default risks, and sanctions. International sanctions on Vladimir Putin’s regime sank it to a record low of 121.5 rubles per dollar, triggering memories of the battering it took during the 1998 Russian financial crisis. Biden even called the Ruble ‘Rubble’. But now, the Ruble has surged, all the way back to where it was before Putin invaded Ukraine, closing at 79.7 in Moscow on Wednesday.
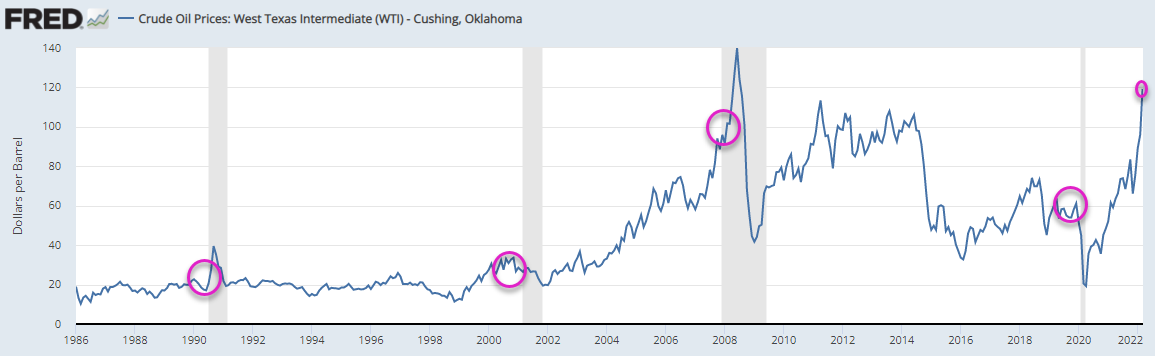
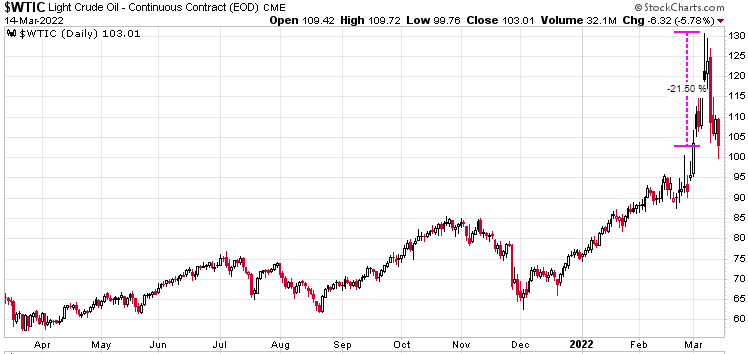
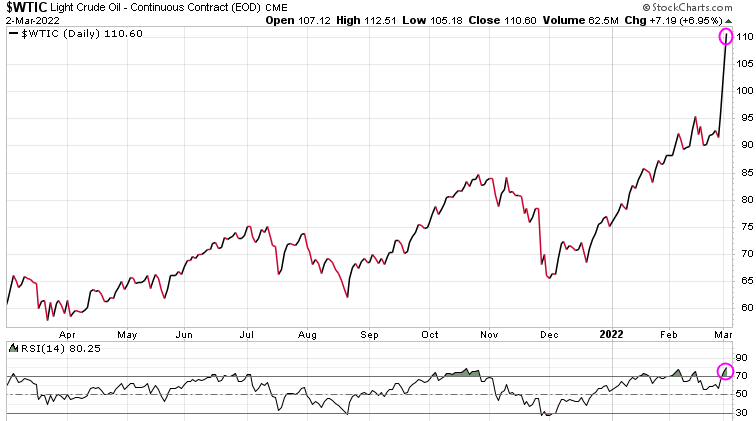
Despite a wide-ranging set of sanctions on the Russian government and its oligarchs, and an exodus of foreign businesses, the actions have been largely ineffective as foreigners keep guzzling Russian oil and natural gas. Even as Russia remains mostly cut off otherwise from the global economy, Bloomberg forecasts the country will earn nearly $321 billion from energy exports this year, up more than a third from 2021.
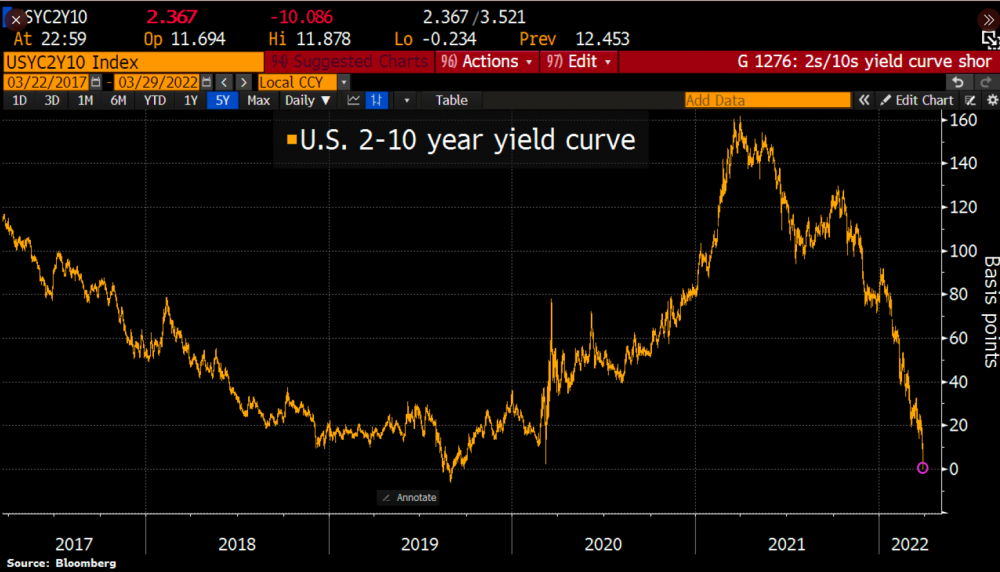
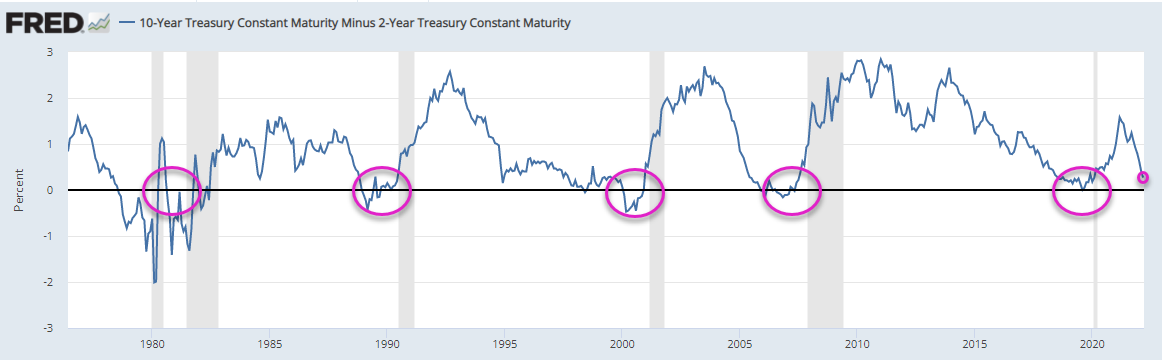
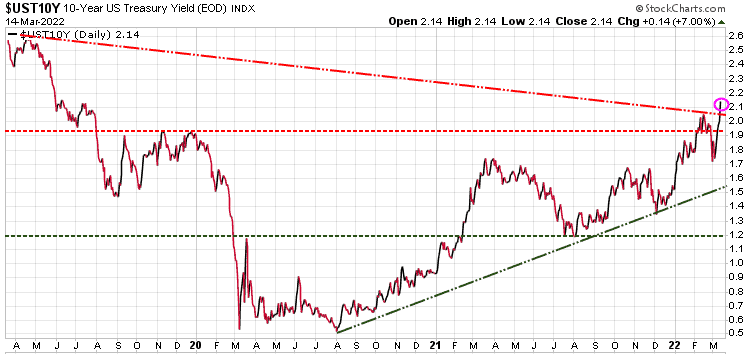
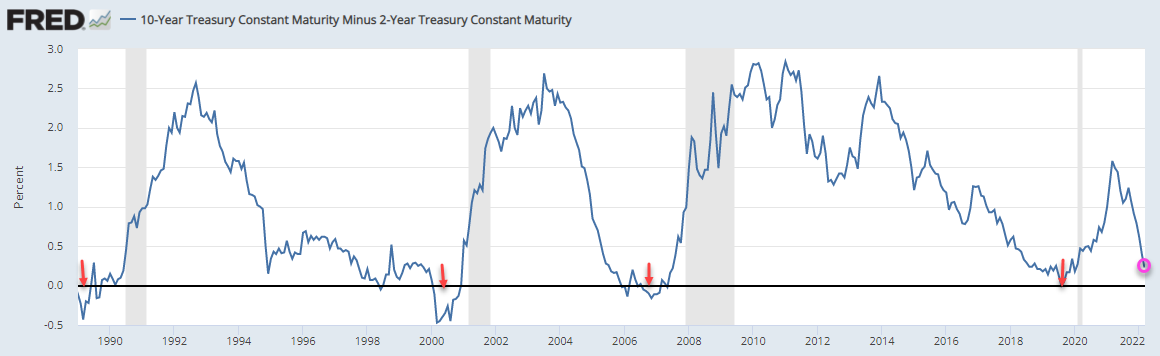
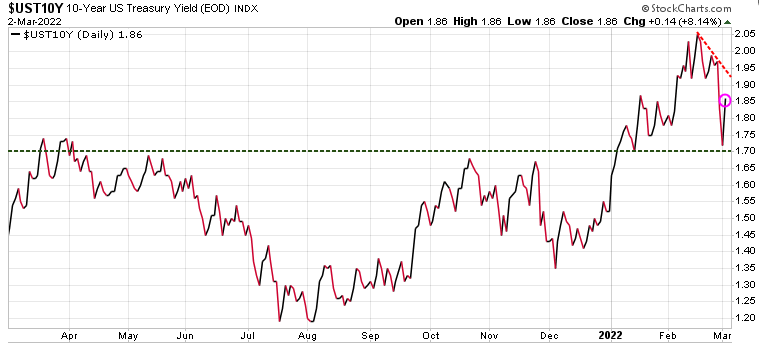
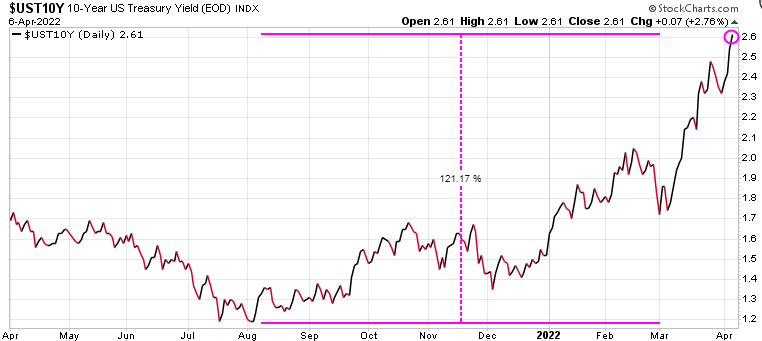
Bond yields keep rising (bonds lower), with the US 10-year yield now up 121% since last August.
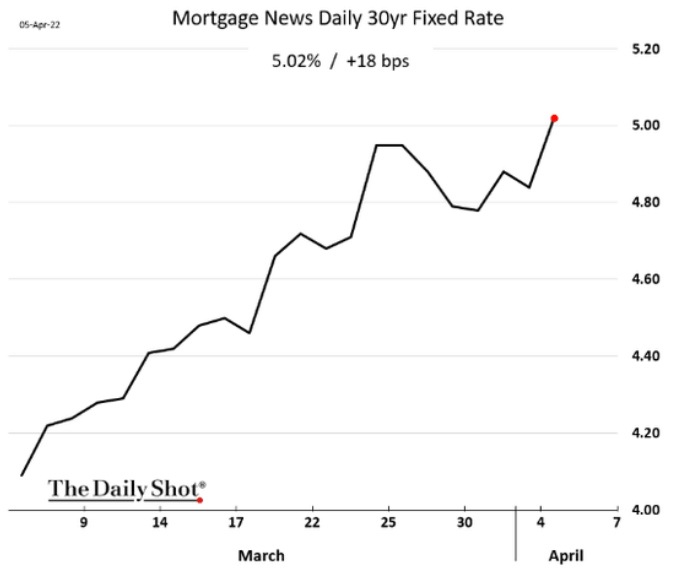
Mortgage rates also on a steep rise with the US 30-year up 18 bps to 5.02%.
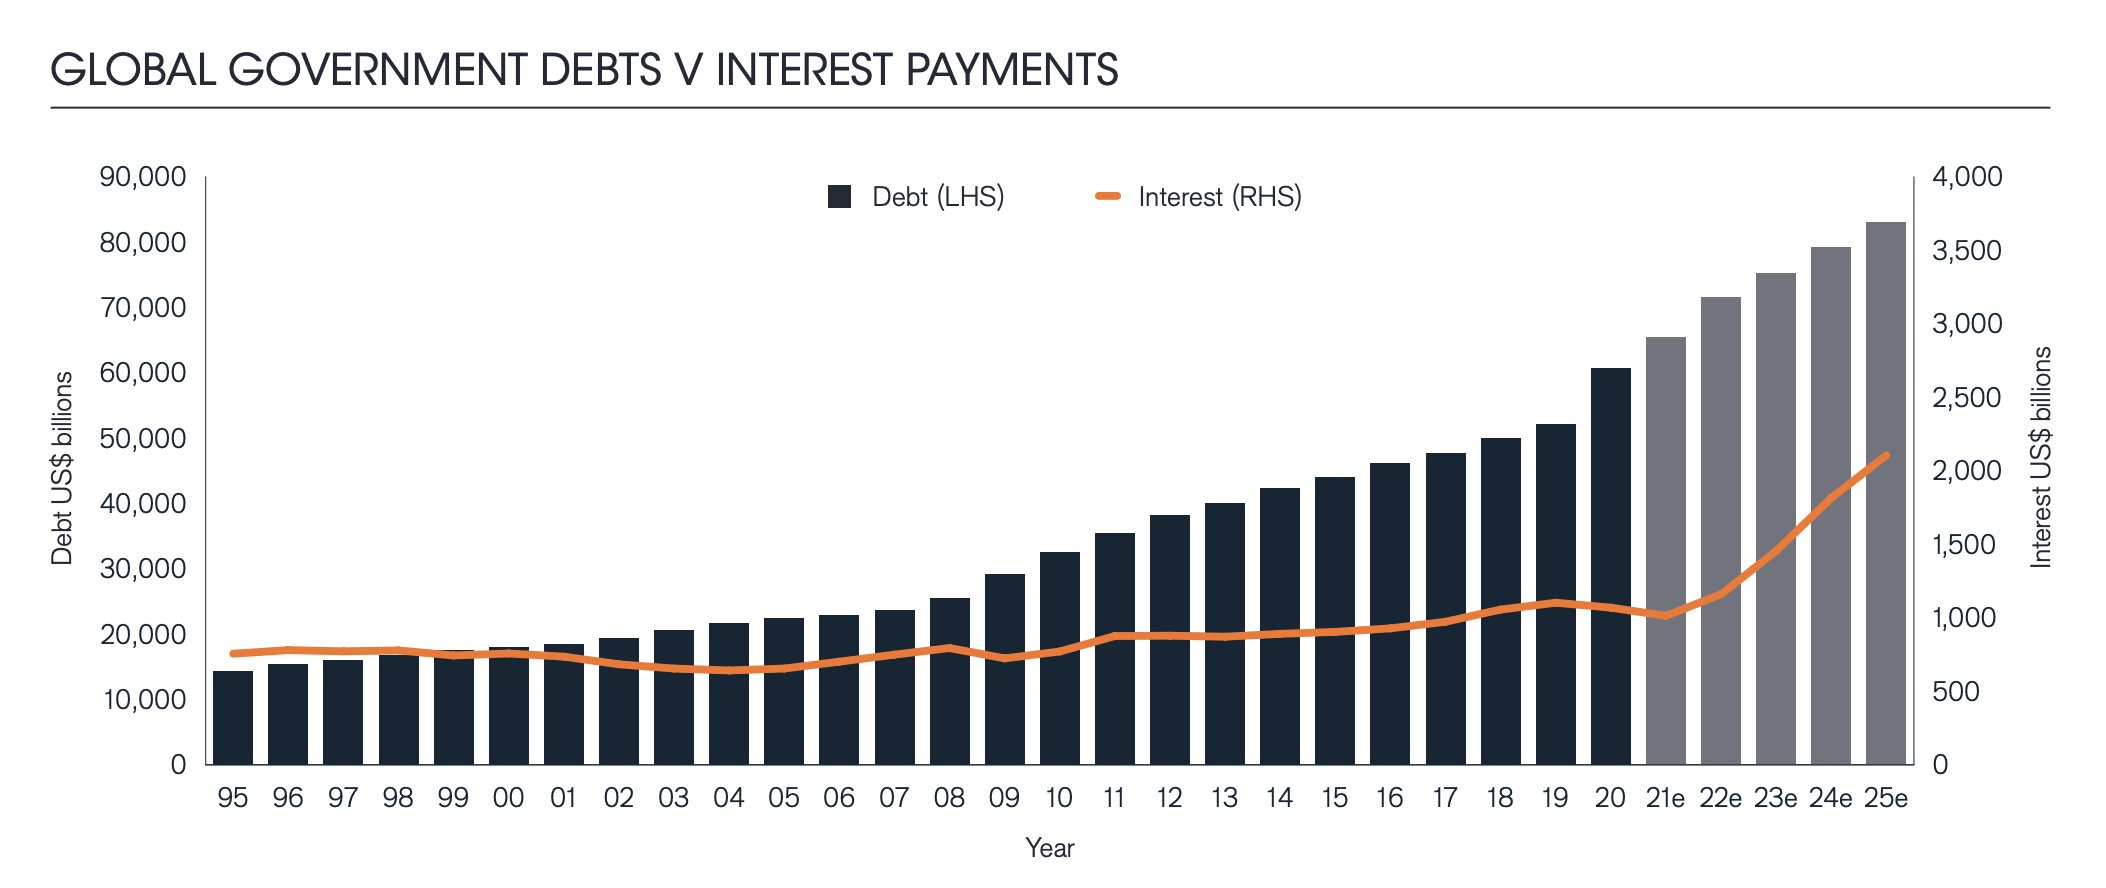
Global sovereign debt is expected to climb by 9.5% to a record $71.6 trillion in 2022, according to a new report, while fresh borrowing is also broadly set to remain elevated. According to the Sovereign Debt Index, published Wednesday by British asset manager Janus Henderson, global government debt jumped 7.8% in 2021 to $65.4 trillion as every country assessed saw borrowing increase, while debt servicing costs dropped to a record low of $1.01 trillion, on record low interest rates.
However, debt servicing costs are set to rise significantly in 2022, climbing around 14.5% on a constant-currency basis to $1.16 trillion.
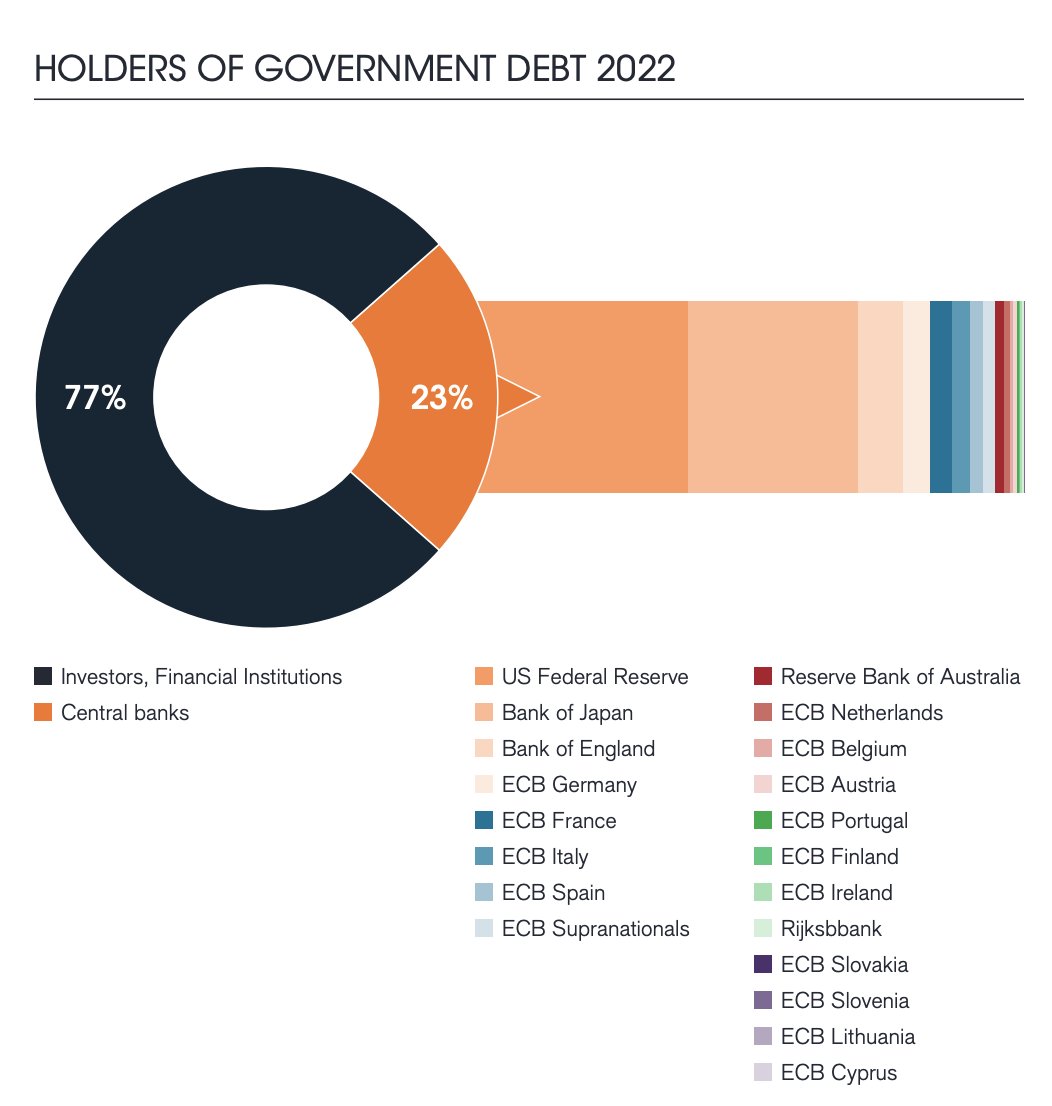
Central Banks are the largest creditors of sovereigns., holding 23% of the debts issued by the world’s governments. Central Bank holdings of gov’t bonds grew by 9% or $1.3 trillion to $14.8 trillion in 2021. If these Central Banks are true to their word and start to apply Quantitative Tapering (QT), who will pick up the slack?
Stay tuned!